

|
stocks & Markets blog |
|
It just seems such a strange market at the moment. We are up near All Time Highs across many Indexes (ok, that is more in the US and not so much in Europe), yet the stack of Macro issues just seems to get ever larger and the potential impact of each new factor just seems to get worse.
Of course in the UK the big story is Brexit and we are getting down to the final weeks and it is still not clear how this will play out although there does seem to be a sense that a Deal with the EU is going to happen but this is not certain and even if it does occur there are no guarantees it can get through Parliament. We also have the new issues where the Iran / Saudi rivalry has gone up a notch and there are lots of fears of potential military action but it is probably an outside chance still as the US is unlikely to get involved with a Presidential Election soon and Iran lacks the capabilities to fight on a large scale and it is more likely that they will continue with proxy wars using the likes of Hezbollah etc. I can’t imagine the Saudis starting another Front when they are rather busy in Yemen and we can be fairly sure they will be defending their Oil facilities a lot better from now on.
The Global Economy is still just as unclear as everything else – on the one hand there has been some slightly more positive news on a few things but I did see an OECD Forecast that had revised down Global growth for future years and the one that stood out to me was that they expected China GDP growth to slow to below 5% fairly soon – that is of course inevitable because growth cannot stay so rapid as a Country gets ever larger but this would be so much slower than the growth China has shown for probably the last 20 years or so. China has really been the ‘growth engine’ of the World and if growth slows to this extent it implies much slower growth in the established and stagnating Economies like in Europe etc.
With all this about, the strength in the Markets is remarkable – my suspicion is that much of it is due to Negative Interest Rates and more Quantitative Easing (QE) – I note that just recently the European Central Bank (ECB) announced “QE Infinity” which differs to the previous QE programmes in that there is no limit to it – that is scary I think and all this Monetary Experimentation might appear to be working now but I can’t help thinking we are storing up loads of trouble to come. Of course another factor of this is Interest Rate Cuts and we just got one from the US and it is very unlikely that any Central Bank will be raising Rates for some time. Stagflation seems to be the name of the game. Mello Chiswick – November 12/13 Before I report on how my Portfolio behaved (or rather, didn’t behave), I want to just quickly mention the next Mello Event which is due to take place on Tuesday 12th November and Wednesday the 13th in Chiswick. I intend to be there on the Tuesday afternoon and into the evening and there is a Discount Code going around where you can get Tickets for half price if you are quick – the Code is ML1950 and you can book at the link below: https://melloevents.com/event/ These are without doubt the best Investor Events around and well worth attending. There are usually loads of decent Companies with stands and presenting and it is a superb opportunity to meet up with other Private Investors who are serious about Stocks. Last Week My Portfolio was damaged by 0.7% last week which of course isn’t a huge amount but I just hate the drip, drip, drip of small reductions in the value of the Portfolio. I am not sure if there were any particular culprits and indeed igIndex IGG helped quite a bit by a good jump up but I think it was just the typical malaise that seems to be dragging on smaller Stocks at the moment. I still have some Index Shorts but I don’t think they hurt much last week. In light of what I started out with on this blog, I am not intending to do much in terms of trades but I am going to buy more IGG very soon – I will cover this more in the Charts bit below. I am just staying cautious and biding my time but I want more IGG for that chunky dividend now that they appear to have stabilised the trading within the business. I did actually look at my Income Portfolio last night and I am pleased to say that it is now up 10.4% for the year so far and that is very decent (especially as I barely do anything to it). Blog Slate A few days ago I published a Blog that talks about how all Investors would probably benefit from putting more thought into Selling decisions and this was colourfully explained using some excerpts from a very good ‘Investors Chronicle’ article from a few months back about how Fund Managers are very good at Buy decisions but their Sell decisions actually erode their performance. I also issued a Non-Finance Book review about a key engagement during the Battle of the Bulge in World War 2 and if you are interested in the final days of the Nazis then this is a stonking read. I started a blog last night about ‘Over-thinking’ but although I have created a decent plan for it I didn’t really get far with the writing – sometimes the flow just isn’t there and last night this was clearly the case. I don’t see any real problem though and I am sure that in coming weeks I can dig away at this one and get it to a final state. It is an important subject so I want to get it completed. After much delay I intend to issue the ‘Stock Buy Checklist’ for blue-sky AIM Stocks and this should appear later in the coming week – it doesn’t need much work although I do want to make sure I have covered the relevant points. Depending on how time plays out, I hope that @Conkers3 and myself will be recording a new TPI Podcast and with my recent purchase of a USB Microphone I want to get this done and demonstrate how this should have resolved the irritating sound quality issues we were having. Other than that I have loads of Draft Blogs in various states of disrepair so I am happy that the flow can continue nicely. I would like to do a ‘Stock Blog’ again soon and have some I am interested in so I should be able to select a suitable Stock to scribble about. Talking of Historical Events If you look at the ‘Blog Index List’ that sits on the WD2 website, then you can find all the Blogs I have scribbled in the last 5 years (yes, it is that long since the whole WD thing appeared !!) and here are a couple which I don’t think have had an outing for a while: http://wheeliedealer.weebly.com/educational-blogs/pin-the-tail-on-the-monkey-musings-on-portfolio-management-part-1-of-2 http://wheeliedealer.weebly.com/educational-blogs/pin-the-tail-on-the-monkey-musings-on-portfolio-management-part-2-of-2 OK, now some Charts. S&P500 As always the pretty pictures are screenshots from the excellent SharePad software that I use and if you click on them then they should grow larger so you don’t have to squint so much. First off we have the Weekly Candles and this is more interesting than I had expected and my Blue Arrow is pointing to a ‘Shooting Star’ Candle which hints at a Turning Point and we could see the S&P500 drop back from this level. I won’t show them, but if you look at the Nasdaq Comp (or 100) you can see a similar Candle. The DOW isn’t so clear although again it put in a Down Candle on the Week. 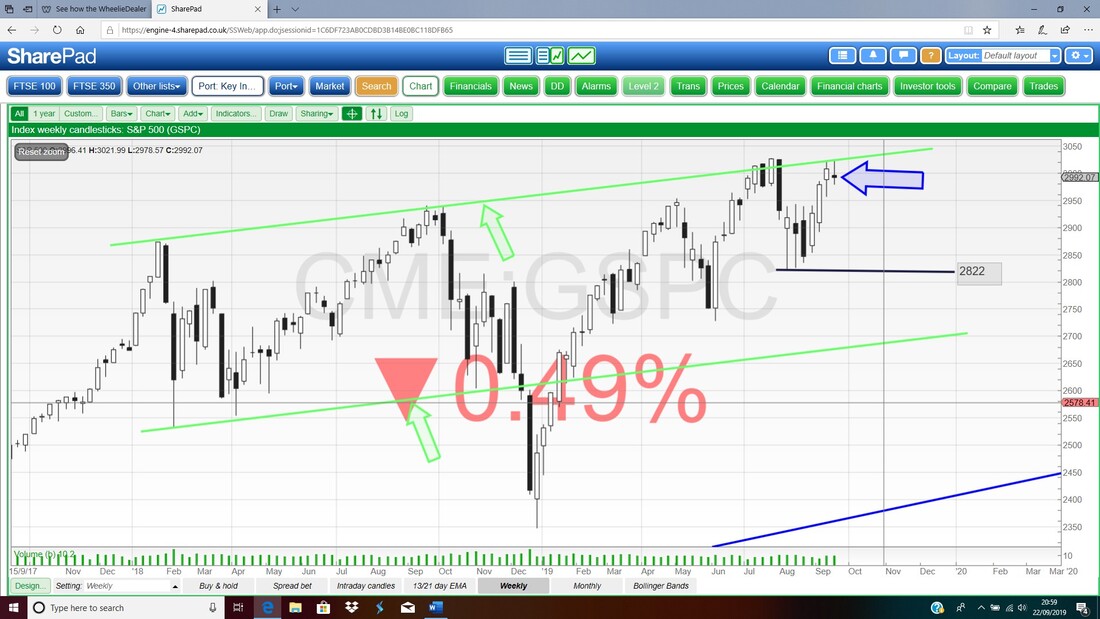
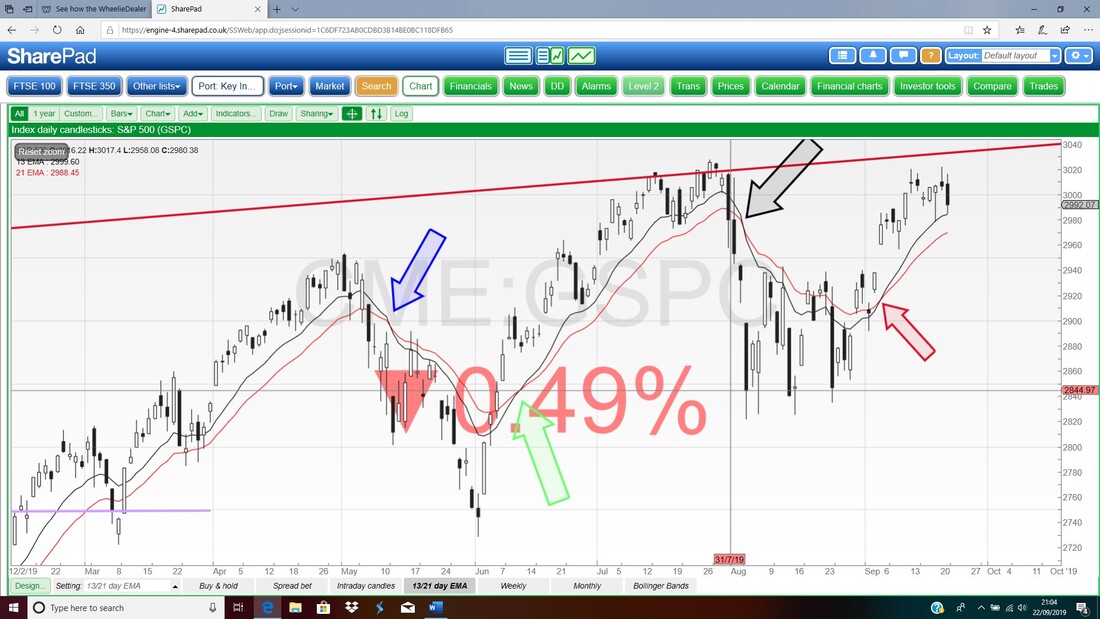
Next up the Daily Candles for the S&P500 and I would like you to note the Red Arrow which points to a ‘Bull Cross’ between the Black 13 Day Exponential Moving Average (EMA) and the Red 21 Day EMA. For now this is Bullish but if we get the opposite Crossover, then that would suggest falls ahead.
Next up the Daily Candles with the Pink Zone marking the Upper and Lower Bollinger Bands. My Black Arrow marks a Down Candle from Friday and note how this turned down off the ‘Shooting Star’ Candle which is highlighted by one of the Ellipses. Note this fell back from a Daily High of 3022 and if you look back another 5 Days there was another Shooting Star which I have put in another Ellipse. This looks like a ‘Double Top’ and is a bearish pattern.
If the S&P500 does drop back a bit more, then the Blue Line (marked by my Blue Arrow) could be support. 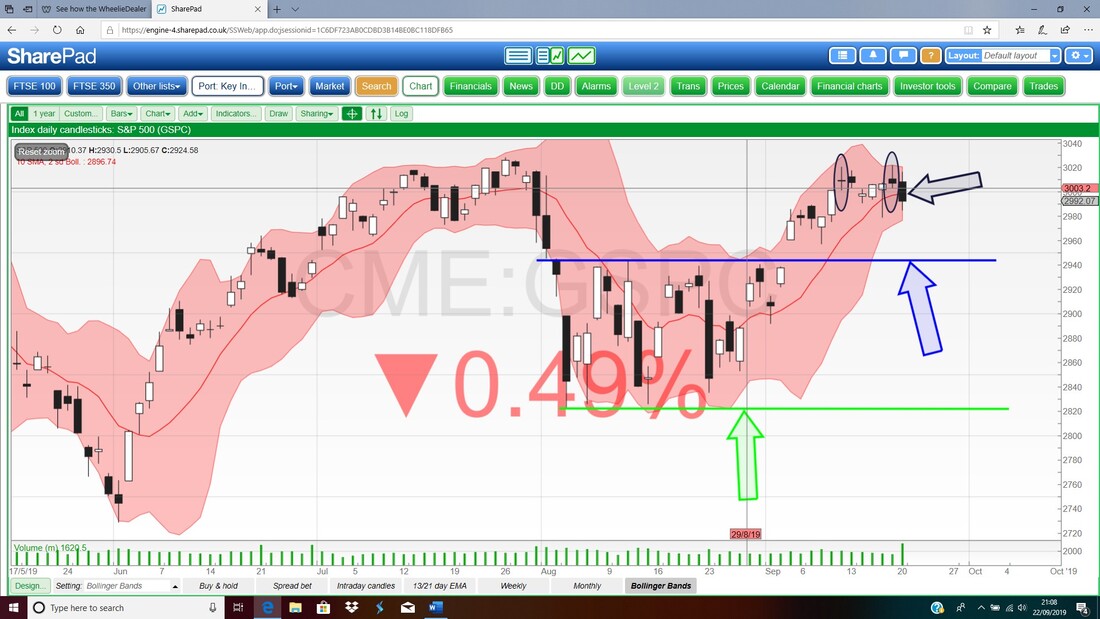
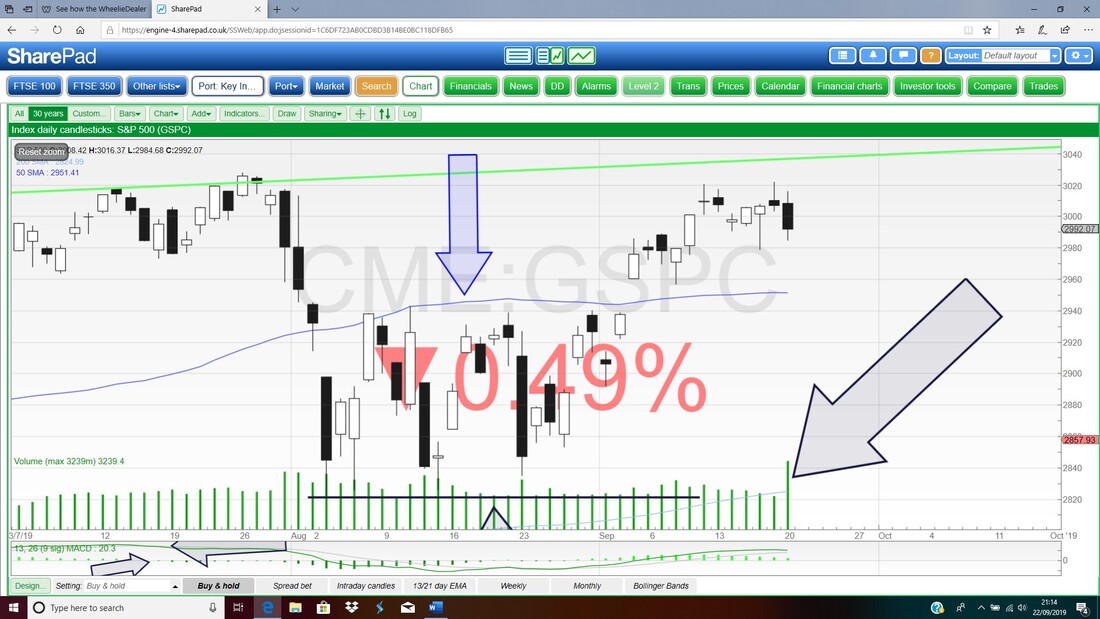
I just spotted this. On the Chart below we have the Daily Candles for the S&P500 and my huge Black Arrow is pointing to a big spike up in Volume for Friday which was a Down day.
FTSE100
First up the Weekly Candles. My Black Arrow is pointing to a possible ‘Hanging Man’ Candle which could mark a Turning Point down. If we see the US Markets drop back, then it is highly likely that the FTSE100 does similar. It is easy to forget we are in the historically weak time of the year with September usually being awful and October can deliver nasty surprises. We shall see. 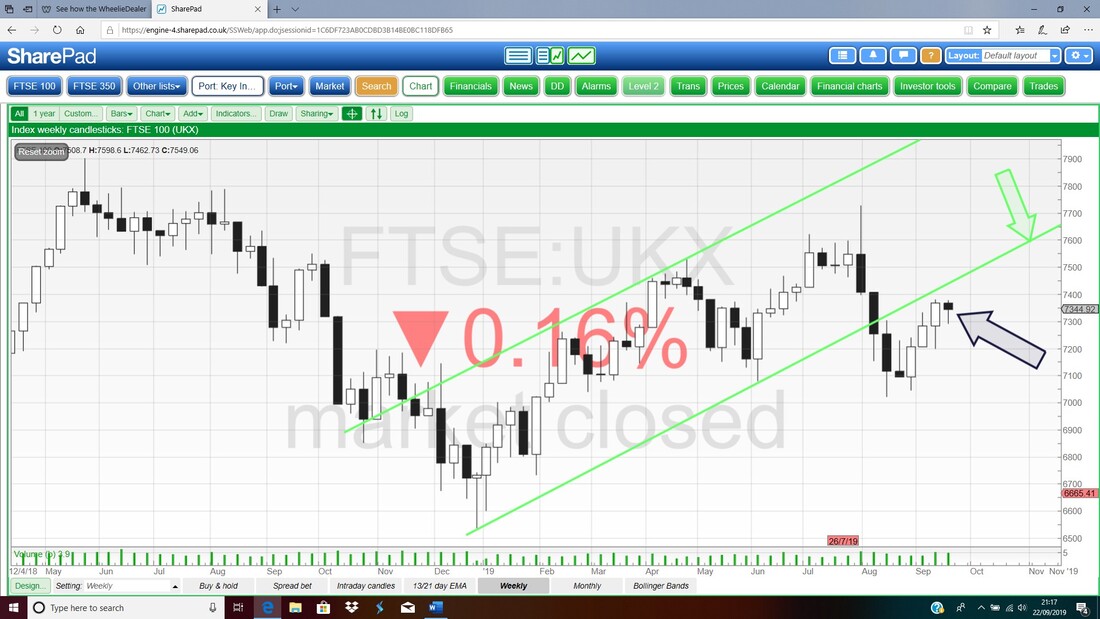
My Chart below has the Daily Candles with my Red Arrow pointing to a Bullish Cross between the 13 and 21 Day EMAs – at the moment this is ‘in force’ and implies upside but of course this is a slightly slower Indicator than things like Daily Candles.
It was this Bullish Cross that was my main reason for reducing the FTSE100 Shorts I had on recently. However, if we see a Bear Cross, then I will most likely add to my Shorts again. 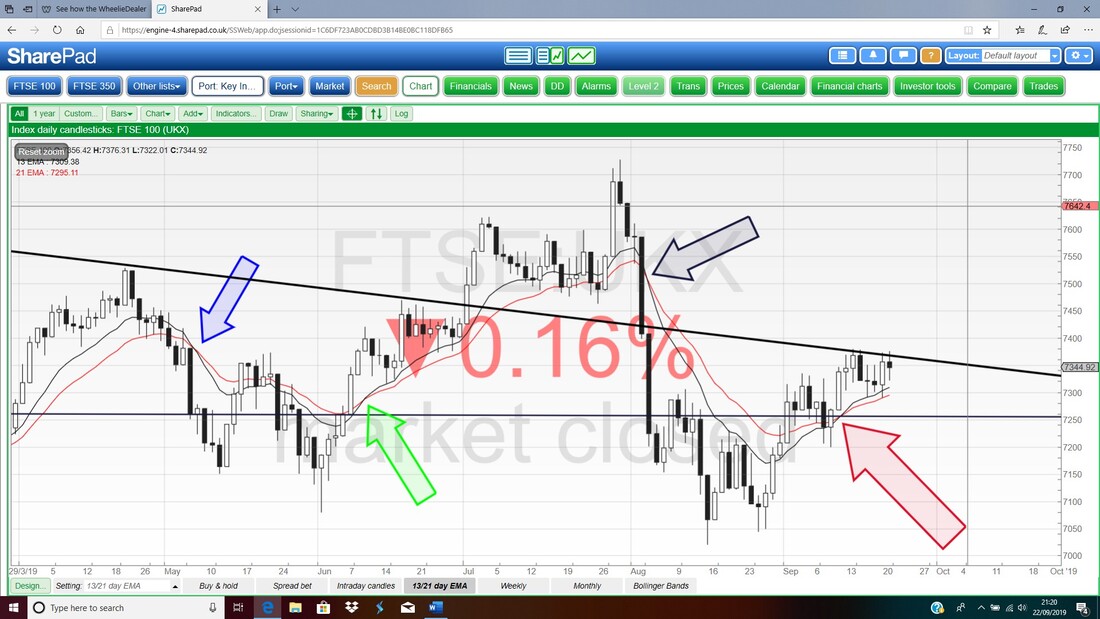
Finally for the FTSE100 we have the Daily Candles with the Pink Zone marking the Upper and Lower Bollinger Bands. My Blue Arrow is pointing to a ‘Long Tails Doji’ from Friday and this just tells us that Bulls and Bears were fighting hard. Note however that the Price has dropped back from the High from about a Week ago which was at 7380 and this is now important near-term Resistance.
I showed the huge Black Ellipse last week I think and the point here is that this marks a big Zone of Resistance so if the FTSE100 can get over 7380 then this Zone will be tough to wade through. I also note there was a big Spike in Volume on the FTSE100 on Friday but I won’t show it here. It could have been a ‘Triple Witching’ Options Expiry day or something but it is unusual. 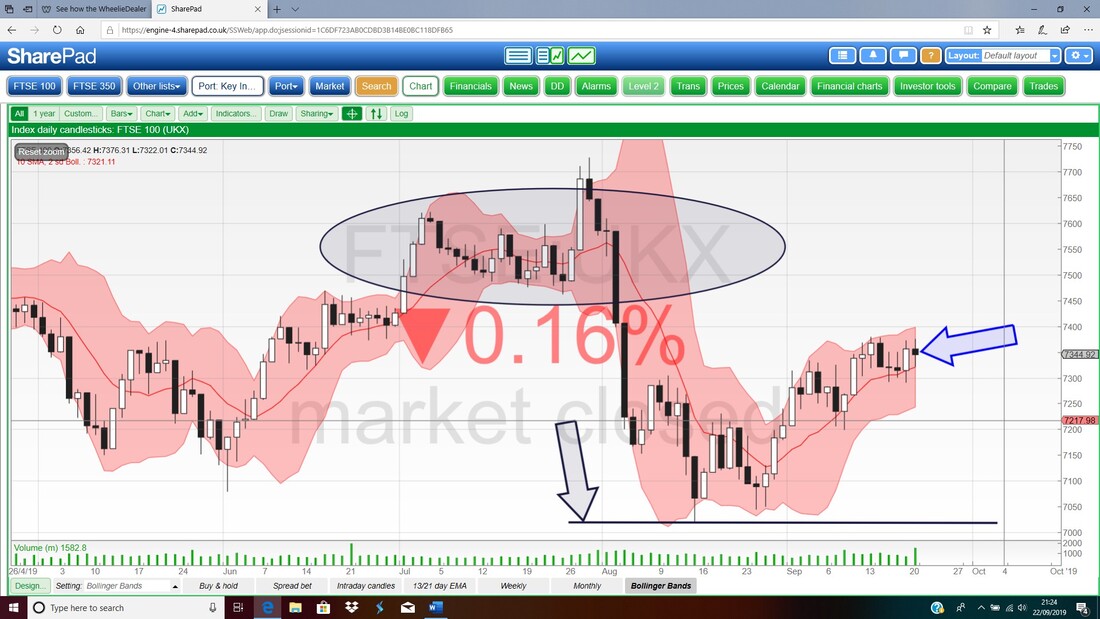
IgIndex IGG
A few days ago IGG put out a decent Trading Update and it looks like things are stabilising in the Business after the hit that was taken following the ESMA Margin Deposit rule changes. I hold IGG in both my Income Portfolio and my normal ISA and I have been watching these closely because I fancy more for the Income Portfolio because as my Screen below shows, the Forecast Dividend Yield is 6.7% and this looks reasonably safe because IGG has a decent Balance Sheet with Net Cash. I want to ‘lock-in’ that Dividend Stream for the future. IGG is the Market Leader in Spreadbetting and CFDs (Contracts for Difference) and has been going for 40 years now. On the risk side of things the biggest problem is more Regulation but there are also opportunities in other Countries and other Product areas. 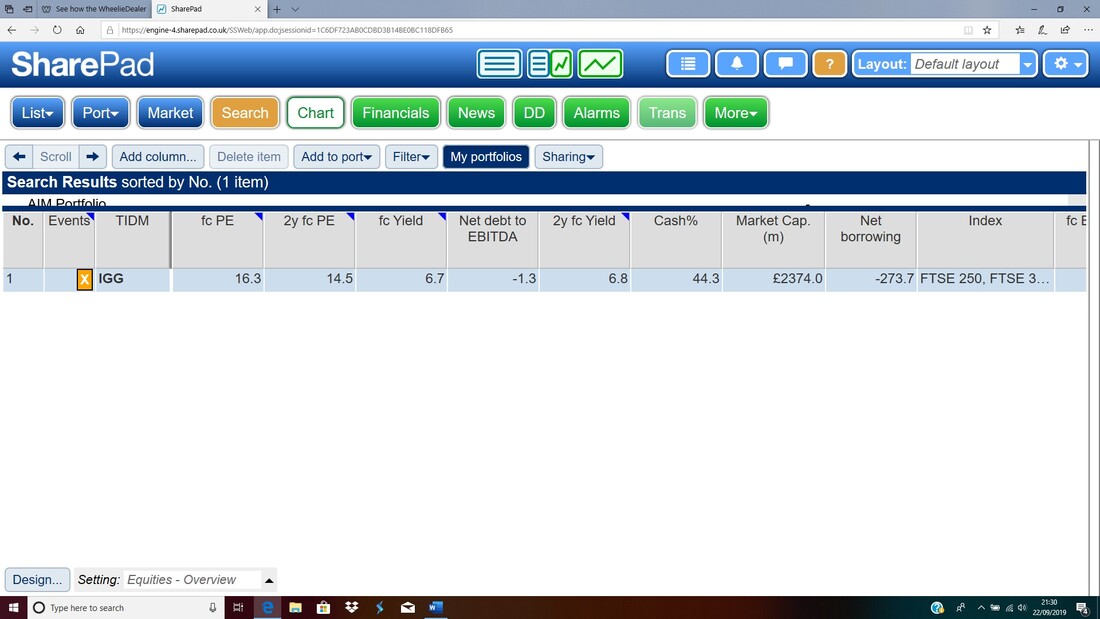
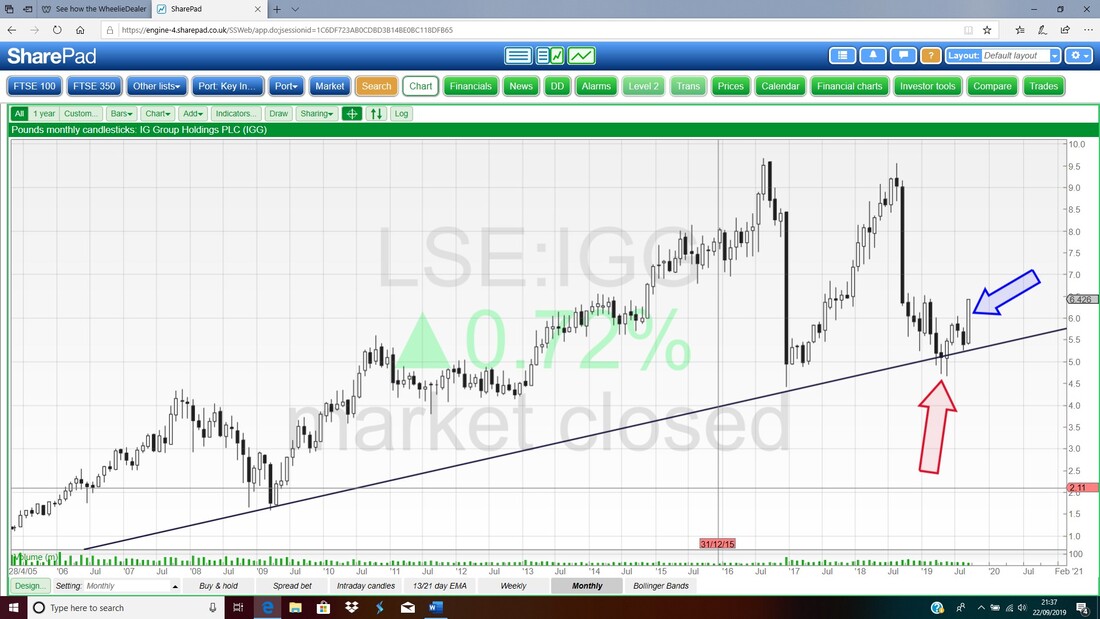
On the Chart below for IGG we have the Monthly Candles which go back to 2005. There is clearly a nice Long-term Uptrend and my Blue Arrow is pointing to a Big Up Candle for September but note this is not really valid yet because September is not complete. My Red Arrow is pointing to a Hammer Candle from April which could well be marking a Medium-term Bottom.
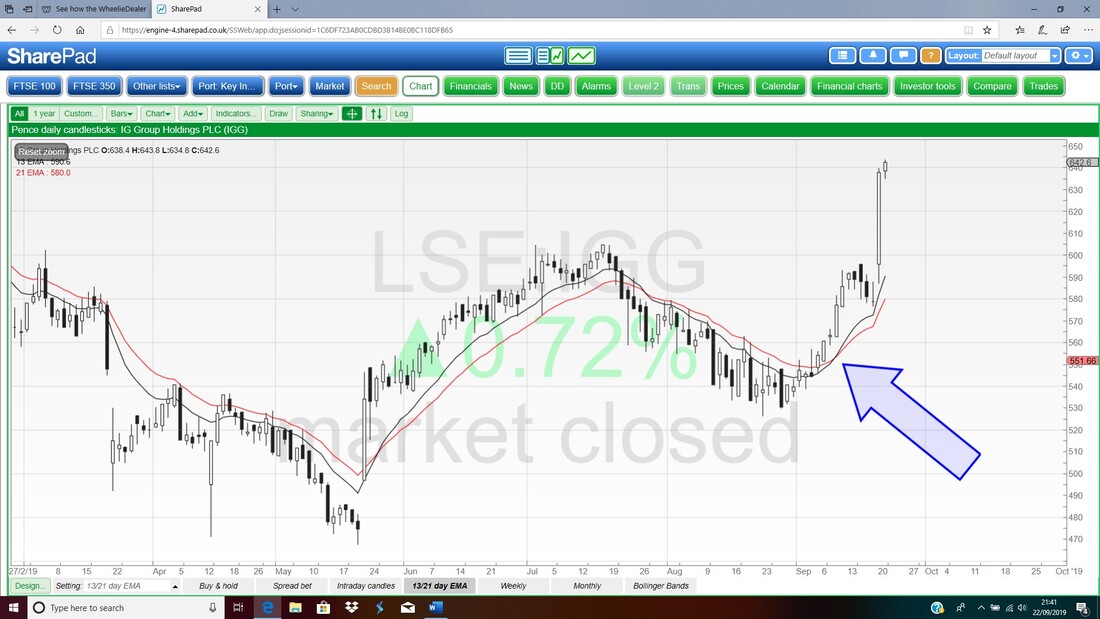
Next up my Blue Arrow is pointing to a ‘Bull Cross’ on the 13/21 Day EMAs for IGG and this suggests Bulls are in command for a bit.
And last up we have the Weekly Candles for IGG. The key thing here is the Resistance where my Red Line (Red Arrow) is at just under 660. If the Price can Close over this Level then I suspect it will soon move up to perhaps 850p or so. My Ellipse is marking a Big White Up Candle from last week which is Bullish.
Finally I should mention that IGG goes Ex-Dividend on this Thursday 26th September 2019 for 30.24p a Share. That’s it for this Weekend – have a good week and best of luck for everyone, Cheers, WD. 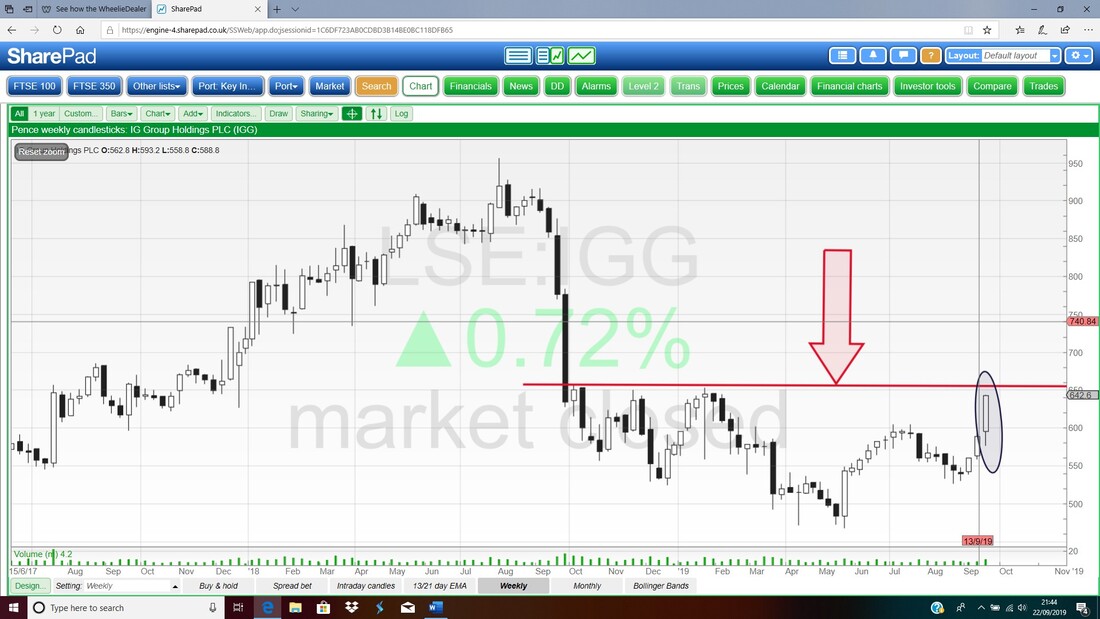
0 Comments
Leave a Reply. |

Stocks & Markets WheelieBlogsThese tend to be more Markets and Stocks related and timely - the Blog Page on the Main WheelieDealer Website has the 'Educational' stuff (well that's the theory anyway !!). Archives
October 2021
Categories
All
|
