

|
stocks & Markets blog |
|
I had a great day out fishing on Friday and it was so nice to do something that was almost ‘normal’ and to cement that we even went to a Pub Garden afterwards - although the place was a bit of a dump and the words ‘Social Distancing’ had little meaning !!
The beer was lush though so I am not moaning and the sun was out so life was very acceptable for a nice change. We had an excellent day by the pond with loads of nice Carps coming out and they were a decent flow – whenever I go fishing I want to see fish but I don’t want too many so that it becomes a chore and I don’t want so few that I get bored and fed up.
It is a bit of a battle because my mate is a ‘Fish Magnet’ and has decades of experience and has done match fishing for years where speed and volume of fish landed is usually the yardstick. We were really lucky though because apart from a bit of a lull while Dave ate a Bacon sandwich, they were coming out nice and steady and I caught 3 really decent fish and probably another 8 or so average but acceptable Carps – they all put up a decent fight and were interesting fish. There was only one pathetic Roach that was smaller than my hook !!!
With all this Lockdown silliness it is easy to forget the nice things of life and doing something I enjoy but don’t do very often (I don’t think I have been near a lake for 2 years) was a real treat. We had a great spot under shade of trees and I generally find fishing lakes are down long country lanes and getting out into nature is a real joy. It was also nice because we were down near Gatwick and with the current situation there were no planes to spoil the tranquil atmosphere. I feel very regenerated after this day out and being able to utterly ignore the Markets for a day was also a real pleasure, and my Portfolio also rose a fair bit so that was the final icing on the cake. That’s what all Fridays should be like. TPI 27 Back on Wednesday @conkers3 and myself recorded the latest Podcast TPI 27 and we did the usual thing of randomly meandering from topic to topic and we covered loads of Stocks and Sectors and gave some thoughts on the Markets in general. As always you can find us on the ‘Conkers Corner’ channel on Audioboom, Apple, Overcast and Spotify and you can also find it at this link on Soundcloud: https://soundcloud.com/user-479955511/conkers3-wheeliedealer-27-covid19-vaccine-hopes-azn-clin-ipf-vtu-auto-sfor-mpac-net Last Week Markets seem hugely choppy lately and the volumes are noticeably very low (you can see this on the Index Charts) with the result that my Stocks are all over the place with many being up and many being down each day. Anyway, in the light of this to have finished the week with a small gain of 0.15% for the Portfolio is fine and with this backdrop and with my recent run of form, any week I am not down is a bonus !! This means that for the year so far (since 1st January 2020) my Portfolio is down 6.5% which is disappointing after I had got things back to break-even (LOL, that’s funny, the Portfolio got itself back to level pegging and it had very little to do with me. In fact, it is my stupidity partly that has dragged it back down !!), but I guess with the state of the economy and judging by how things were a few months ago, I really can’t complain too much. I am pretty sure I hold decent Stocks in the main and as long as I stop doing dumbass things (ok, that is unlikely because I am always ballsing it up), then I can build from where things are now. As per our discussions on the Podcast and in line with recent comments in my blogs and on Tweets, I am not doing very much at the moment and I am definitely being cautious because Autumn is often a tricky period and with such a strong run up on Markets recently, a pullback of significant size would make a lot of sense. I am however pretty much 100% invested and happy to stay that way but I am on the lookout for any signs that I need to Hedge my Portfolio with Index Shorts. With how things are at the moment I am reluctant to add to my Long stance with any more exposure but once the Autumn is out of the way, I will be looking to add a Long Spreadbet on an Index etc. The Economic outlook is clearly pretty ropey and the recent UK GDP figures were a huge miss at just 1.8% of recovery (the expectations were for over 5%) but despite this the direction of travel is really for improvement from a very dire position. Sadly loads of people are going to lose their jobs and have already suffered this and it is not obvious that the UK Government has much capability or skill to be able to prevent this. We are due a Budget in coming weeks I think and that may help particular sectors a bit but it could well be way too late for many people. On the positive side there was some more decent Economic news out of China with something like 3% GDP growth, but the Economic situation in the US is really unclear. On the one hand the quick abandonment of a general Lockdown might have helped their Economy but on the other hand the recent surge in Virus Infection numbers has led to lots of localised Lockdowns – so the picture is very fuzzy. Everything is so confusing and unclear that I will just stick to reading the Index Charts and doing what they tell me to do !! Something Fishy from the distant past As always you can find the full archive of Blogs I have scribbled over the last 7 years on the ‘Blog Index List’ page on WD2 and many ‘Guest Blogs’ which have kindly been written by Readers and friends over the years. This week I am bringing a WheelieBlog to your attention that was written not so long ago in May 2019 but it is well worth a refresher (this is a link to Part 2 but there is a link to Part 1 at the top of it): https://wheeliedealer.weebly.com/educational-blogs/market-inefficiencies-and-overconfidence-part-2-of-2 Blog Slate During last week I published a Guest Blog from @IanShadrack which covers some interesting points about how to plan for Retirement and helps with things like setting financial goals and budgeting for your spending. I also did a fair bit of work on the second Blog relating to Bango BGO and my intention is to get that completed this coming week but there is still a lot to do. I will put my full focus onto the BGO one but if I don’t manage to finish it this week then I will just keep going on it and release it once it is done. After that one is nailed I have a head full of ideas for Blogs that I want to write and I also have a long list of various subjects which I can use for inspiration. I also have several Draft Blogs written and if I am struggling to find a subject I am fired-up about writing, then I can fall back on one of these Drafts to make sure something appears. I always find it much easier to write when my heading is buzzing with an idea and I am motivated to write it, than when I have thought of an idea and lost interest during the writing process !! I am also juggling the usual facets of my life and trying not to do too much WheelieDealer stuff and to enjoy the Summer – but don’t worry, I am not going anywhere and my intent is that you will always be able to read and hear stuff from me for many decades to come !! Now I am inspired to do the Charts !! Gold All the Charts I show are taken from SharePad as screengrabs and if you click on them you should be able to see more details on your screen. As always it is best practice with Charting (Technical Analysis) to start with the ‘Big Picture’ and to then drill inwards to shorter timeframes. With the Gold Chart on SharePad we are treated to many years of data and the Chart below goes back to around 1965 (when I was born !!). The first thing that hits me is that this is a very ‘spiky’ Chart and clearly Gold has been in the habit of doing lots of Peaks which then drop back. We of course have no precise way of knowing it this is going to happen yet again, but when I look at the steepness of the recent rise it does make me wonder. My Red Arrow points at the All Time High around $1921 back in September 2011 and clearly this is strong Resistance as we move up now. As always, if Gold can Breakout over $1921 then we should see it run higher and this would be a really Bullish development. My Blue Line (marked by my Blue Arrow) is showing a long-term Support Line which is useful for Gold Holders. 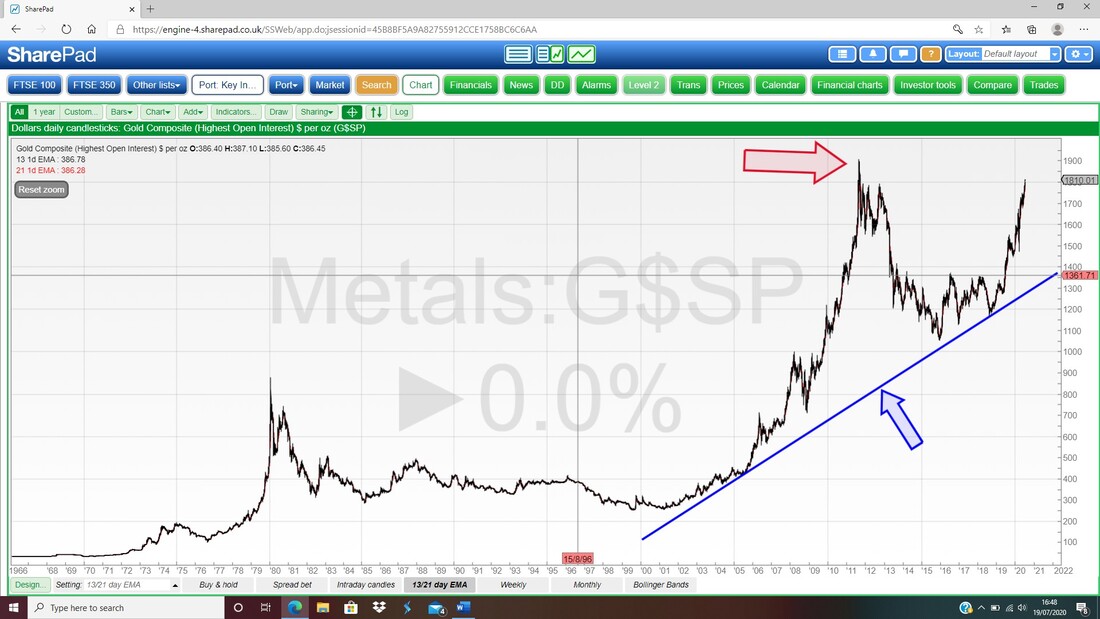
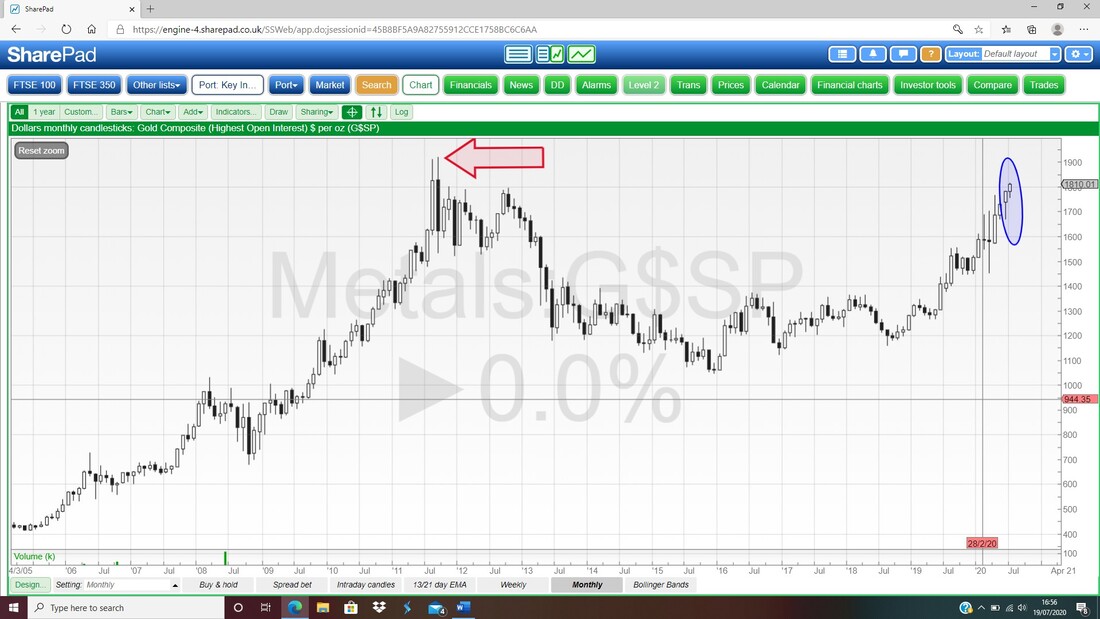
My next Chart shows the Monthly Candlesticks and again my Red Arrow is pointing to the All Time High from 2011. My Blue Ellipse is capturing both the Candles for June and for July, but the latter is not valid yet until a complete Candle is created, so we must ignore it. However, the Candle for June is pretty Bullish looking and suggests more upside.
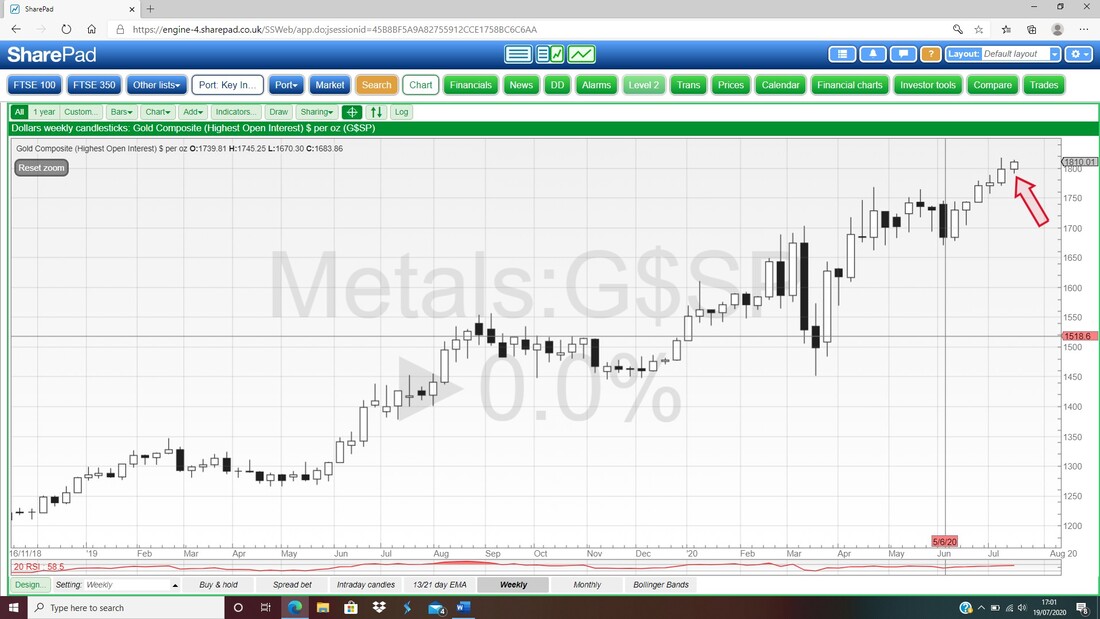
Next up we have the Weekly Candles and I have zoomed in a lot. This time my Red Arrow is pointing to a Doji Candle from last week and this could be a warning sign that there is a Pullback coming; but even if the Gold Price does fall back, it might just be a healthy Consolidation move before an attempt on that All Time High at $1921. If you look at the Candle from the week before, this one has a ‘Wick’ up above it and that hit Resistance at $1818 which means this is the important short-term Resistance that needs to be broken through.
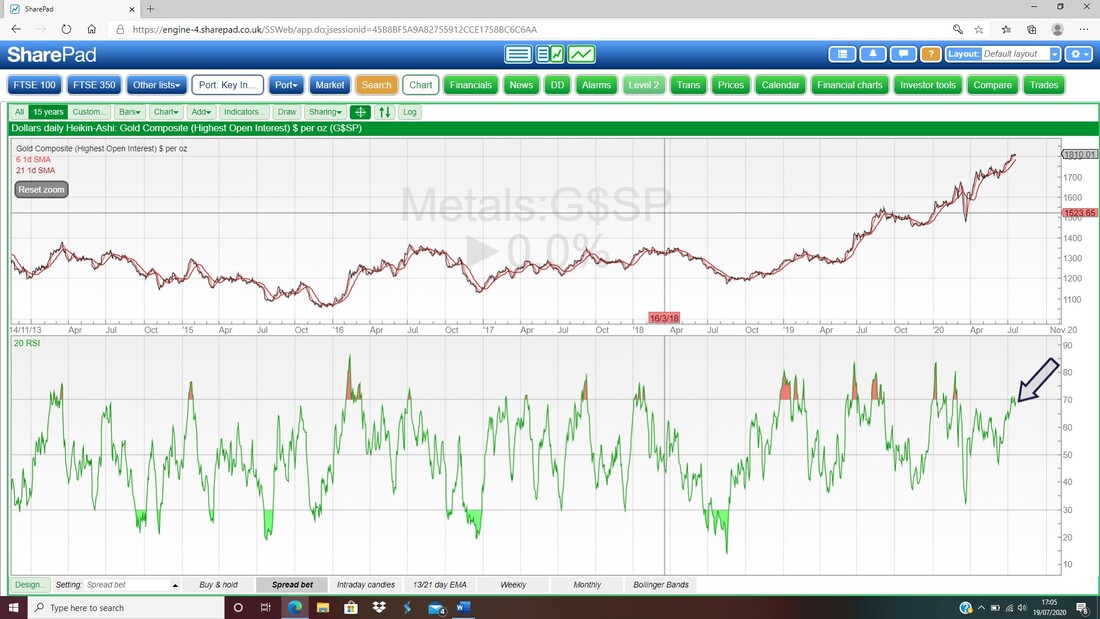
In the bottom window on the next Chart we have the Daily RSI (Relative Strength Index) and where my Black Arrow is we are on a Reading of RSI 69. This is a very high Reading and usually RSI 70 is seen as ‘Overbought’ for most fairly liquid Assets, but if you look to the left you should be able to see that Gold has often had an RSI up above 80, which means that it is not impossible for Gold to go higher in the short term, but it is clearly at elevated levels and people are getting very excited (as an aside, you probably don’t find many Gold Bears around at the moment, it could be a very crowded trade to be Long on Gold….).
Out of interest I have included the Weekly RSI for Gold which is in the bottom window on the Chart below. On a Reading of RSI 66 where my Blue Arrow is, this is not as high as on the Daily but it still pretty high.
Extreme RSI Readings do not mean that Gold is necessarily going to drop heavily or anything but it tells us that some sort of Consolidation Period is highly likely. This could mean a sizeable drop when the Consolidation is done by Price, or a Sideways Grind where the Consolidation is done by the use of time. 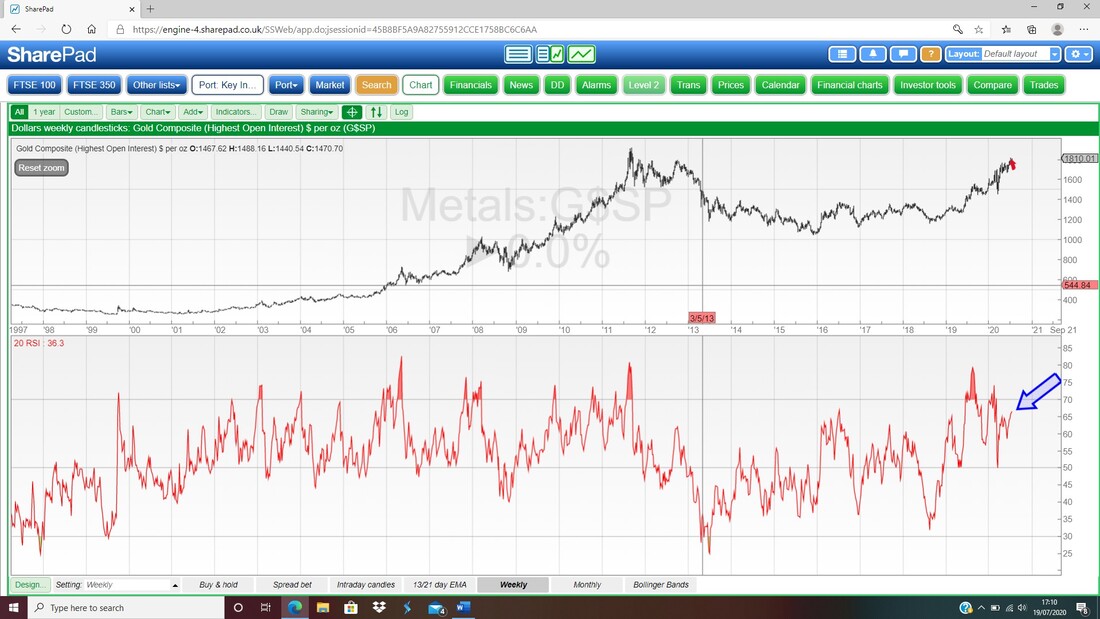
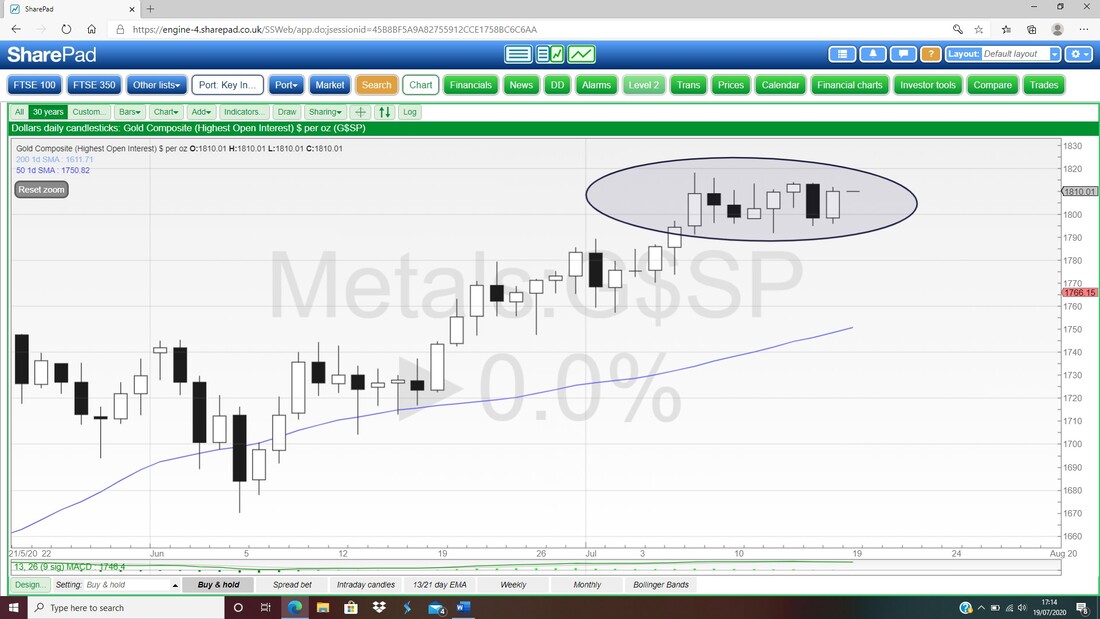
Finally, we have the Daily Candles for Gold and my big Black Ellipse is essentially there to highlight that like so many other Assets, much of the recent moves have been in a Sideways Range. This looks like a Consolidation before another move up to me. As I mentioned before, $1818 is the key short-term level and to the downside there is loads of Support not far below.
Brent Oil Composite
This is quite similar to a Chart I showed recently I think. This shows the Daily Candlesticks and the key thing here is the Blue Line marked by my Blue Arrow at $44. That is the key Resistance that needs to be broken through and I suspect it will happen. If it does, then the next Target is where my Red Arrow is at $45.5. My Black Arrow is pointing to a Doji Candle from Friday and the Brent Oil Price has been pretty sideways for a while. To the downside, there is decent Support at $40 and then around $37. My Green Arrow is pointing to where we had a Bull Cross between the Black 13 Day EMA Line (Exponential Moving Average) and the Red 21 Day EMA Line and these are still Bullish because the 13 Day is above the 21 Day. 
Below we have the Daily Candles for Brent Oil with the Pink Zone marking the Upper and Lower Bollinger Bands. The reason I am showing this is because with the Price going sideways for a while, the Bands are naturally tightening up and when this happens it usually ‘Resolves’ with an explosive move – but it can be Up or Down and we cannot know which in advance. I suspect it will break to the Upside and there is a bit of a ‘Flat Top Triangle’ going on if you look back over a few weeks.
Please ignore that random Arrow - I only noticed it when uploading the document to my Website !! 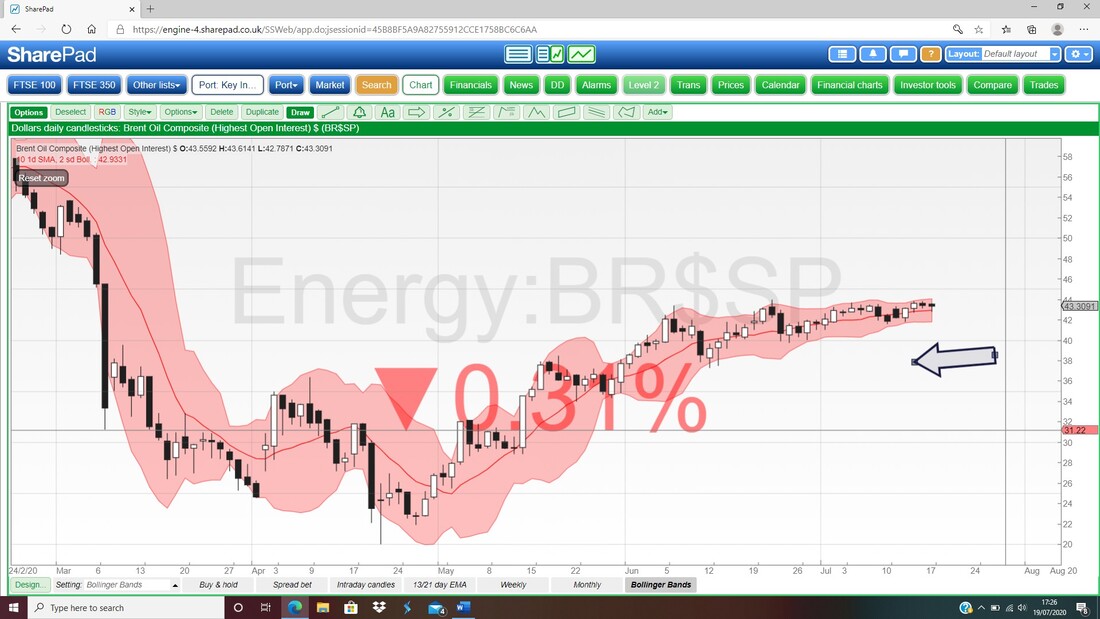
S&P500
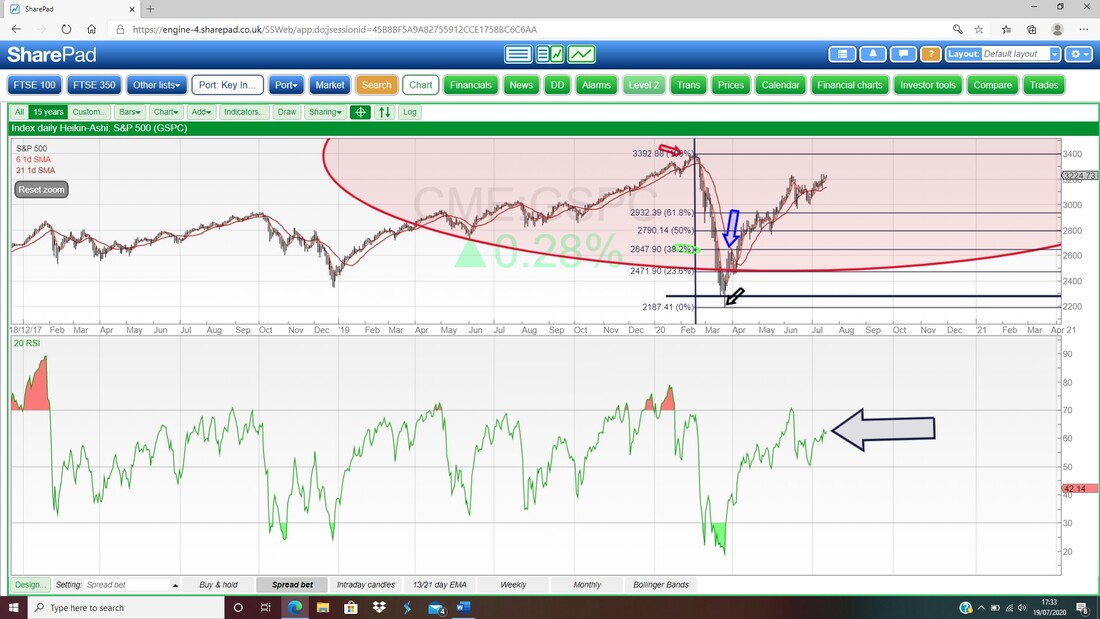
My Chart below has the Daily Candles for the S&P500 and this is still very much in ‘Bull Mode’ when it comes to the 13 and 21 Day EMA Lines with my Red Arrow pointing out the Bull Cross some time ago. My Black Ellipse is trying to capture the recent activity for the last 3 Days and it has been pretty much going Sideways. The key here is Resistance at 3238. 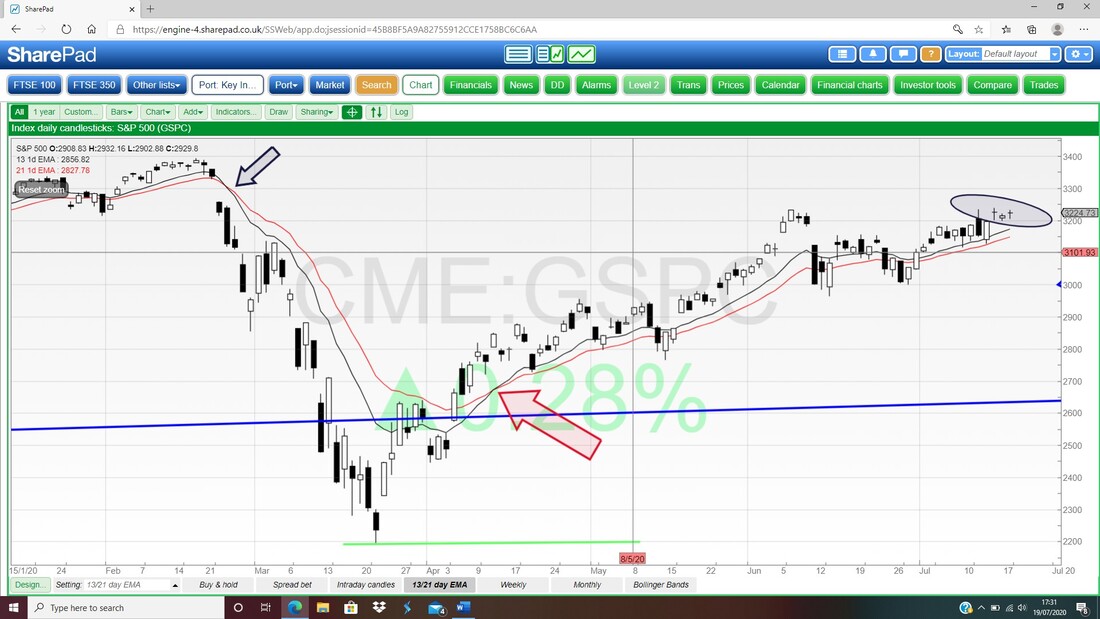
The bottom window below has the RSI for the Daily S&P500 and on a Reading of RSI 62 it is not overbought and can go loads higher if it is in the mood.
FTSE100
My Chart below has the Daily Candles for the FTSE100 but my main interest here is those 13/21 Day EMA Lines. Back where my Red Arrow is we had the decisive Bull Cross where the Black 13 Day EMA crossed over the Red 21 Day EMA and since that the FTSE100 has been rising. However, as I pointed out recently in my Weekend Blogs (and I probably talked about it on the Tweets), where my Black Arrow is we had a Bear Cross which could have been a marker of the start of trouble for Bulls ahead. But, as it turns out the Bear Cross has quickly been negated by a Bull Cross where my Green Arrow is, and with pretty much every other Major Index in the world going up, it would be weird for the FTSE100 to be falling. I have mentioned countless times how much I love the 13/21 Day EMA Lines and the clear and reliable Signals they give. The only real drawback is that they can give False Signals when Markets are chopping about and really if you get a Bear or Bull Cross, then you need to give them a few days to Confirm and it is wise to use other Indicators as well to give some clues as to whether or not it is a Valid Signal or a Duffer. My Blue Ellipse is marking the Candle from 10th July when the FTSE100 dipped down near that 6000 Level. This is clearly strong Support and as long as the FTSE100 stays above this then the Bulls have plenty to smile about. To the Upside now, the key Resistance in the short-term is at 6323 and then we are looking at 6342 and 6387 and the really important Resistance Level is at 6512 – if that is cracked, then the FTSE100 can probably charge up to 6800 or so and even 7000. 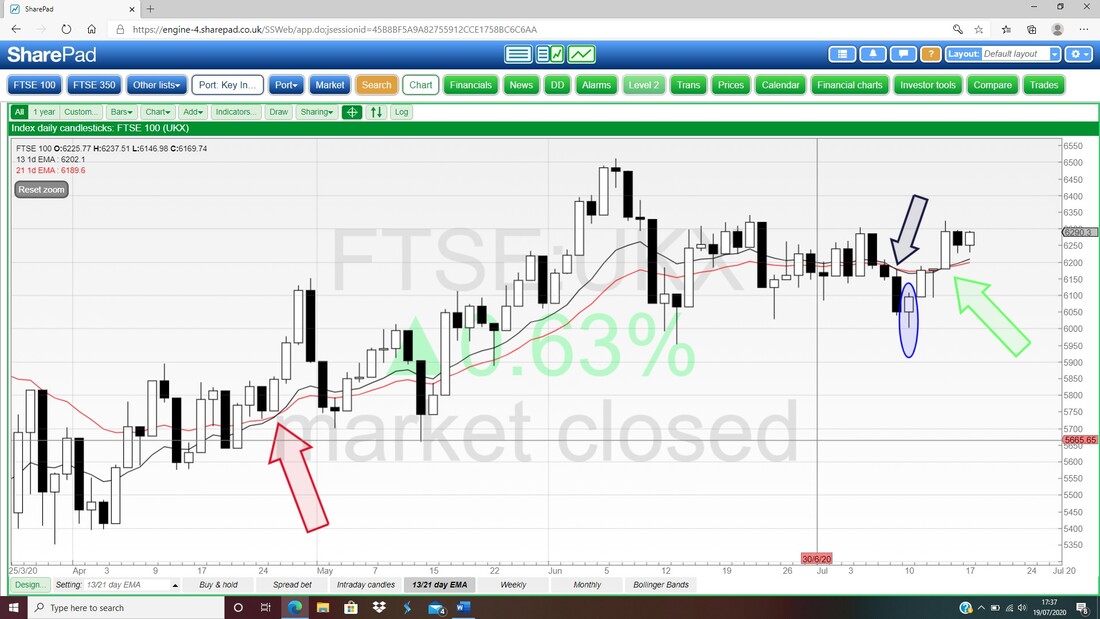
In the bottom window below we have the RSI for the Daily on the FTSE100 and on a Reading of RSI 55 this is no impediment to the FTSE100 rising.
OK, that shallots for Week and best of luck for the coming battles and I hope you all make loads of dosh !! Cheers, WD. PS. Another great sign of ‘normality’ was the return of MotoGP and if you get the chance to see it, the race from Jerez today was a stunner – it will go down as a classic and with just 13 Races on the calendar it looks like a highly competitive championship battle with many Riders in with a good chance. The thing is, because there are several ‘back to back’ races with just a week between them, there is no time for rest and for injuries to heal – this will most definitely be a key factor in the title chase. 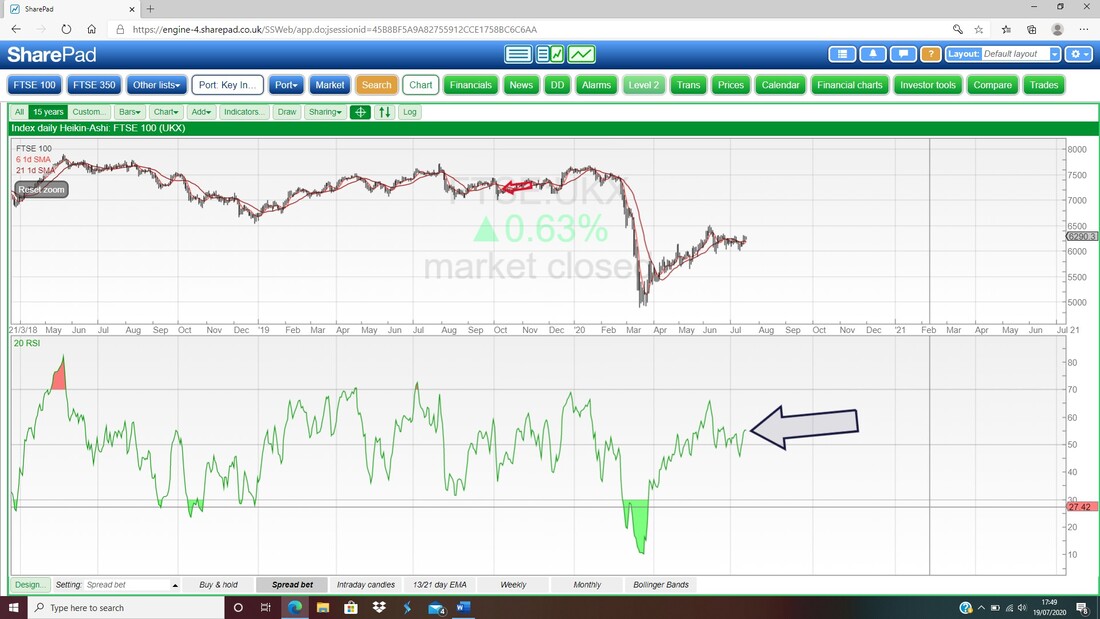
0 Comments
Leave a Reply. |

Stocks & Markets WheelieBlogsThese tend to be more Markets and Stocks related and timely - the Blog Page on the Main WheelieDealer Website has the 'Educational' stuff (well that's the theory anyway !!). Archives
October 2021
Categories
All
|
