

|
stocks & Markets blog |
|
So far not even a week of imprisonment but I am just about coping despite the utter dearth of decent TV to watch and of course no Sport that is worth the effort of lifting your eyelids for. I managed to go out for some sneaky ‘exercise’ in the Cupra for a few minutes but other than that I just got stuck in with ‘work’ such as reading Investors Chronicle. We are just heading towards Summer and of course the Clocks are changing but it would be nice if the Arctic Winds would relent and get on with the sunshine bit. I have some seeds planted but with the chilly temperatures it might be a while until the slugs get something to eat !!!
Last night I published the Blog I had promised about looking for simple Technical Indicators which pinpointed the ‘Proper’ Bottom back in 2009 and I recommend you read it as it will help you navigate the way forwards and stop you buying too many Falling Knives and hopefully instil the need for calm and patience as you let the Market come to you rather than continually trying to pick the bottom. You can read it here:
https://wheeliedealer.weebly.com/educational-blogs/simple-chart-indicators-that-signalled-the-20089-bottom That Blog also includes a fair bit on Fundamental Factors even though that was not the point of writing it. I suggest you read those bits as it saves me the time and effort of repeating it all here. Last Week It was a very welcome relief to have a bit of a Bounce last week and my Portfolio recovered about 5.5% for the week which was quite pleasant. Unfortunately though, I doubt it will last and I have been positioning for more weakness with Shorts on the S&P500 and the FTSE100. See my ‘Trades’ page for more details on those with stuff like Stoploss Levels etc. and I will most likely add another Short on the S&P500 early next week – maybe even on Monday if I get the urge. I broke my usual rule again on Friday of not waiting to the Close of the Markets to place a Trade when I shorted the FTSE100 a bit more. I had been planning a Trade for a few days and it was when the news came out that both Boris and Matt Hancock had the Virus that I felt the odds were in my favour to get more Short. I wanted to go Short into the Weekend because unlike last Weekend where I was expecting more positive news about the US Bailout etc., this time we were heading into the Weekend with not much likely in terms of good news and it was far more likely we would get a drip drip drip of the Death Count. It is very grim news indeed and I am trying to not watch the TV News too often !! With the Market mood at the moment it probably doesn’t matter too much whether or not your Trade Entry is the ultimate in perfection – it is more about getting the Trade on and being ready because when the Markets move they move fast and big. It is better to be on the Train than to be too focused on punctuality and to miss it as it pulls away from the Station. OK, you can spend an immense amount of effort on perfect timing but in all honesty when a Market moves 20% in your favour it isn’t really going to matter much if you make another 2% by your efforts. Personally, I would rather have an easy life and just make a decent amount of Money rather than the optimum amount (but spending my life staring at a screen). Latest TPI Podcast ‘Double Bill’ About a week ago we issued this this Special Double Bill edition of Twin Petes Investing Podcast which is number 19 and comes in 2 parts. We have purposefully recorded these because we know just how strung out many Readers and Listeners are and we wanted to get something issued which would help to calm some jangled nerves and to help make sense of what is going on. They have had a very favourable reception and so far loads of people have listened to them, so I can recommend them as a potential boredom reliever as we wait for the Virus to abate and for something half watchable to appear on the Tellybox. As always they are unscripted but we purposefully did even less preparation than normal because we wanted to catch the authenticity and the raw emotion which you should be able to feel from them. You can find both Parts at these Links below on Soundcloud and if you use Apple or Audioboom then go to the ‘Conkers Corner’ Channel and look for anything with Number 19 on it !! https://soundcloud.com/user-479955511/conkers3-wheeliedealer-19a-winning-shares-coronavirus-ocdo-sbry-mrw-qe-gaw-futr-tsco https://soundcloud.com/user-479955511/conkers3-wheeliedealer-19b-best-investing-indicator-of-a-recovery-oil-mcs-vrs-kgp Blog Slate On the ‘Educational Blogs’ page on WD1 where that Blog about the Technical Indicators sits, I published a Guest Blog which was kindly donated for the benefit of Readers by Simon Jackson (@Jackson_S_D on the Tweeterer) which outlines his thoughts on recent weeks and it is well worth reading. Thanks again to Simon for creating this for us. Also big Thanks to my mate Wes the Plumber who inspired me to realise that I could write a useful quick Blog for Readers about the process I go through shortly before I place a Spreadbet Trade and I will try to bash that out during the coming week. Other than that, I need to get on with changing the ‘Theme’ on my Websites which I have been putting off because I find it a bit soul-destroying but I really need to grasp the nettle and get the job done. I mean that at some point soon the Websites will look flippin’ ‘orrible but I am sure that we will all get used to them after a few years !! Previous Escape Plans from Prison This is a Series of Blogs I wrote back in 2017 and in all honesty I have forgotten what they are about !! I sort of remember writing them and from a quick scan it looks like there is some psychology stuff in there. Anyway, give it a go as you have naff all else to do and if the Police see you out ‘exercising’ for the 4th time today they are gonna get wise to you !! And no one needs to ‘shop’ 5 times a day. And that’s not your dog !! And the Chemist is really fed up with seeing you now. And no, they don’t have any Paracetamol or Bog Rolls…….. There are links to the first 2 parts at the top of this one: https://wheeliedealer.weebly.com/educational-blogs/maybe-were-not-in-control-after-all-part-3-of-3 It’s Charts time then…….. S&P500 As per normal, the Charts I show are taken from the outstanding SharePad software that I use. If you click on the images then they should grow a bit larger so you can see more detail – that of course assumes I have uploaded them to the Website proper-like. In that Blog I published last night about Technical Indicators that help us determine the Proper Bottom, I talked about Fibonacci Retracements a bit but I forget to mention that SharePad (and the more Chart-wise sophisticated ShareScope software) has the capability to draw these Fibonacci Levels without having to do the maths yourself like I did. You can also do Fibonacci Extensions which is when you extend a Trend into the future to get a possible Target. Complex stuff and frankly not something I have ever used. Right, it really didn’t take me long to figure it out and I have just drawn the Fibonacci Retracement Levels on the S&P500 for the recent moves using the SharePad Tool. You go to the ‘Draw’ Menu and you can then choose ‘Fibonacci Retracement’ and you start by clicking your Mouse at the bottom of the move (or the top if it was a move up) and then you move your Mouse up to the Starting Point of the move. On my Chart below, you start drawing your Retracement where my Black Arrow is and you drag it up until the ‘100%’ Level coincides with your Start Point which is the Red Arrow at the top. Dead easy and flippin’ nifty. Now, I have drawn this thanks to my old mate Shaun who sent me a ‘What’s App’ about this today because he has spotted that the S&P500 has Retraced to the 38.2% Fibonacci Level and I wanted to recreate that for WD Readers on my Chart. I am very chuffed because I managed to figure it out and I expect I will be using this great Tool a lot more in future. Anyway, on my Chart below don’t get too puzzled by the ‘weird’ Candlesticks – these are Daily Heiken Ashi Candles which I sometimes look at but they are a ‘slow’ Indicator and therefore of less use than some other stuff but it was the only Chart I have set up on my system that doesn’t already have lots of other scribble all over it !! It doesn’t matter, the point is that the Price fell down to the level where my Black Arrow is and then the Price ‘Retraced’ to the Fibonacci 38.2% Level and it looks pretty likely that it is turning down again now. 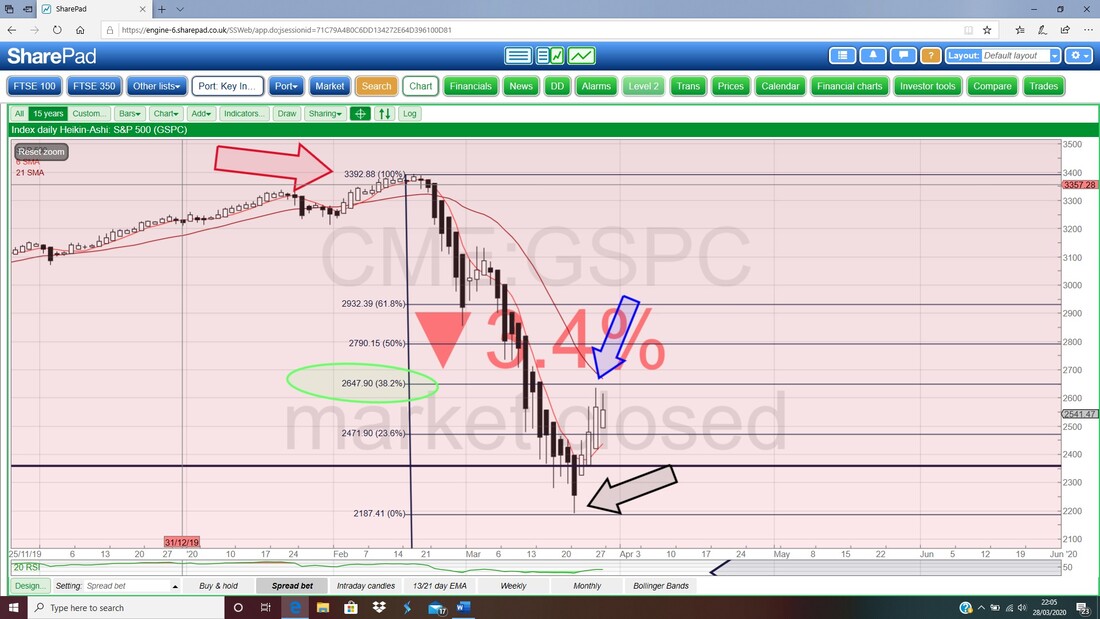
On my next Chart I am focused in on the Daily Candles and my Red Arrow is pointing at a Bearish ‘Shooting Star’ sort of Candle from Friday where the S&P500 was unable to hold the High of the Day and indeed the High of the day before (Thursday obviously !!) at 2637 is now important Resistance. If the Bulls are to really grab hold of this Market and take it higher, then they must push through this Resistance.
To the downside, the Support where my Green Line and Green Arrow are is vital – that is 2191 and if it fails then expect more hefty falls. Failure of this Support would be a Sell Signal. My Black Arrow is pointing to a ‘Bear Cross’ between the Black 13 Day EMA (Exponential Moving Average) and the Red 21 Day EMA. This is still ‘in force’ and until we see a ‘Bull Cross’ this is not a Market to be buying (except for a quick Trade, but as always it is easier and safer to make money trading with the Major Trend). 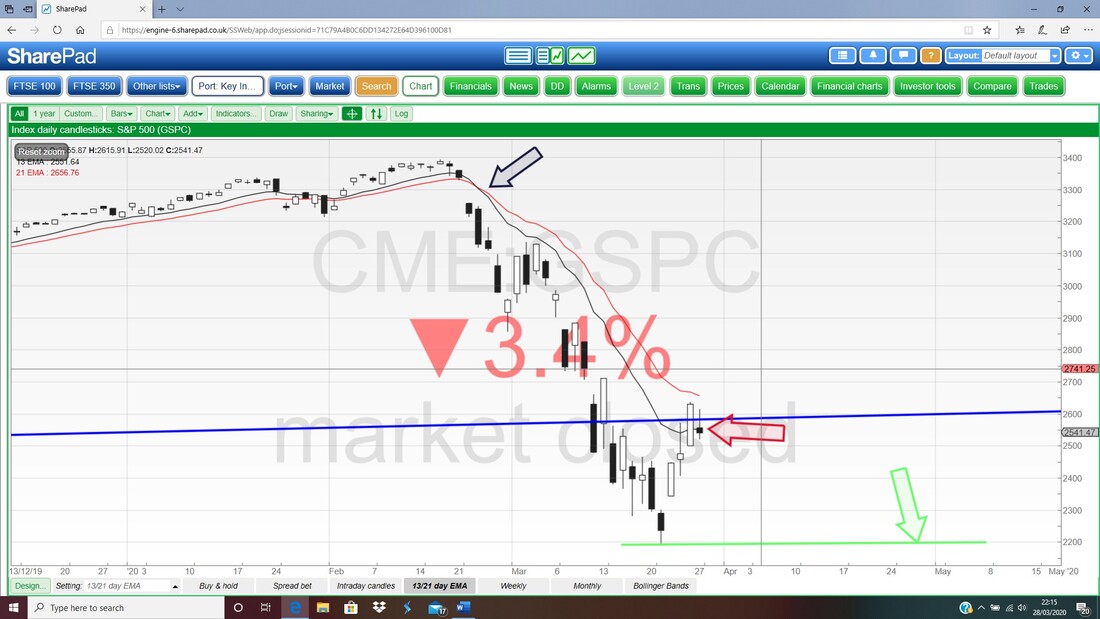
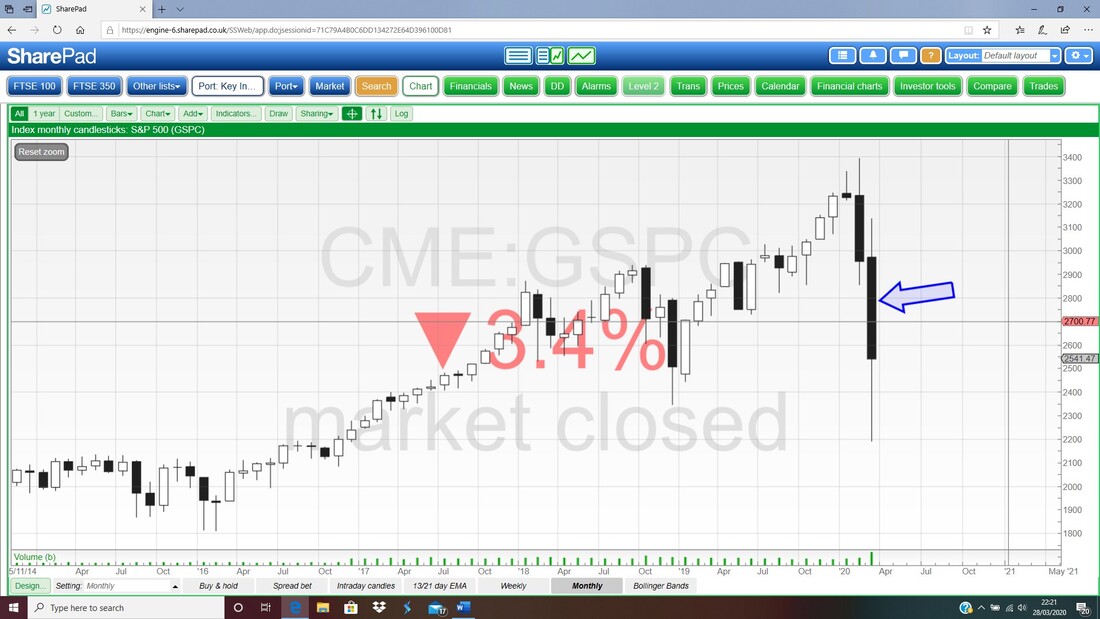
I am jumping the gun by one day on the next Chart and showing the Monthly Candles for the S&P500. My Blue Arrow is pointing at a Big Black Down Candle for March and unless we have some sort of massive Rally on Monday which creates a nice Hammer Candle, then this looks pretty Bearish.
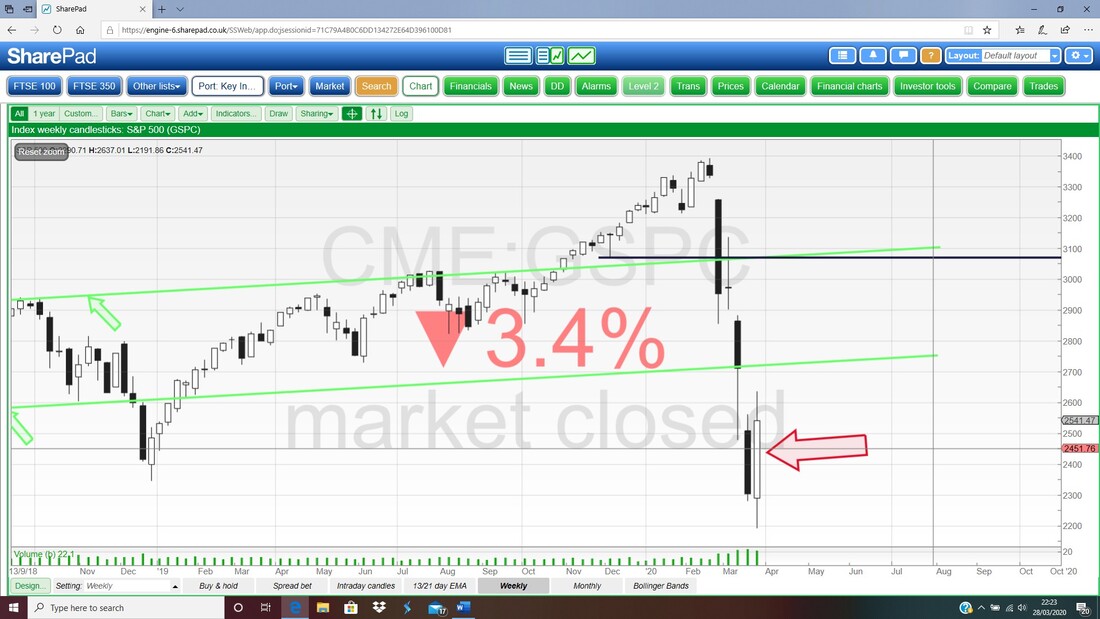
Next up we have an Indicator that is telling us something different – so we need to be on our guard because it might be right whereas others like the 13/21 Day EMAs and Monthly Candles and Fibs could be wrong. This Chart has the Weekly Candles for the S&P500 and my Red Arrow is pointing to a Bullish Engulfing Candle – if this is right, then we should rise off it straight away next week. If it fails to rise right away, then chances are this is a false Buy Signal.
Brent Oil Spot
Due to the crazy weightings in the FTSE100 it is highly dependent on how ‘Big Oil’ moves (RDSB, BP. and the Miners) and I always keep an eye on it even though I don’t often include it in my Weekend Markets Blogs. Anyway, for a change here is the Brent Oil Spot Daily Candles and first up note where my Black Arrow is that we have a 13/21 Day EMA Bear Cross holding sway and that of course doesn’t suggest Oil is gonna rise for a while. However, things are much more interesting when we focus on Support and Resistance and if you look at my Red Arrow which is pointing to the Red Support Line at about $26.37, this must hold and if it fails then expect more falls in the Oil Price. Scary. To the upside, my Blue Arrow and Blue Line are crucial Resistance and if Bulls are going to push Oil up they need to push through this Resistance which is at about $32.85. If the Bulls can manage that, then Resistance up at $40 is next and that is where my Black Ellipse is. If I was a betting man I would go for more falls but until that Sideways Range plays out, we cannot really know. Having said that, such Sideways moves after a Big Drop are often a Bearish ‘Ledge’ playing out and things can easily fall off a Ledge…… 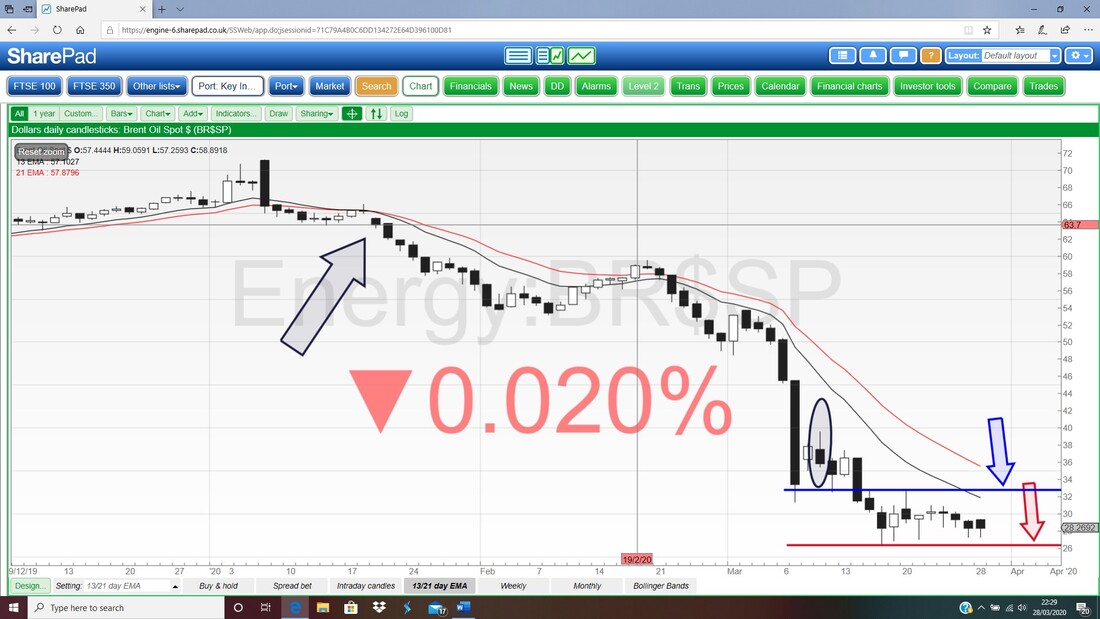
FTSE100
First up the Monthly (bear in mind there is one day to go !!), but where my Blue Arrow is the Candle for March is looking pretty bearish. 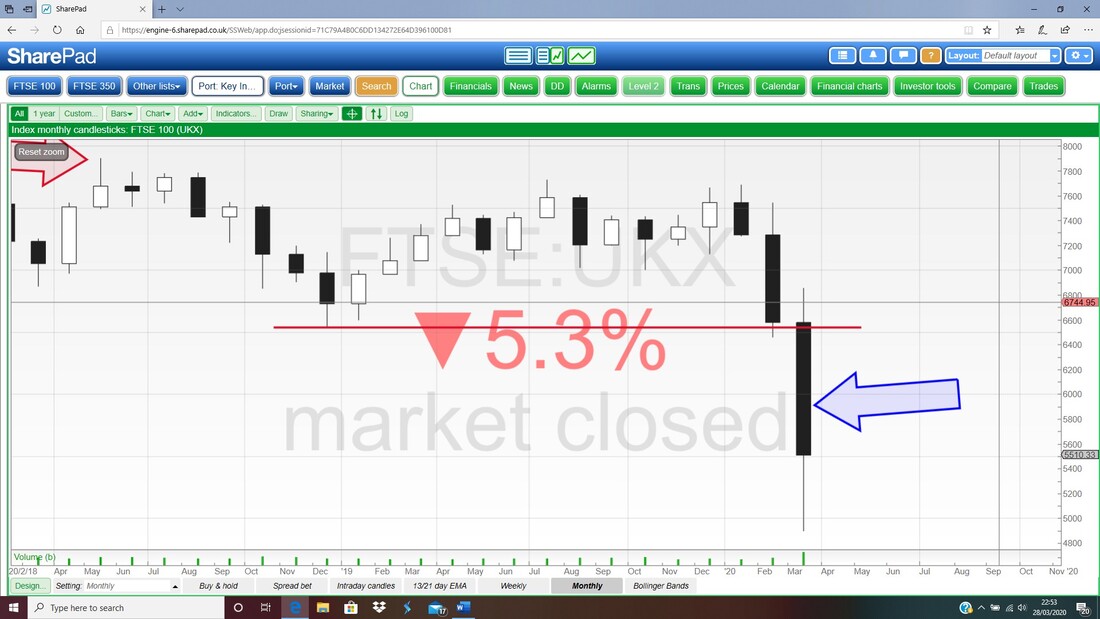
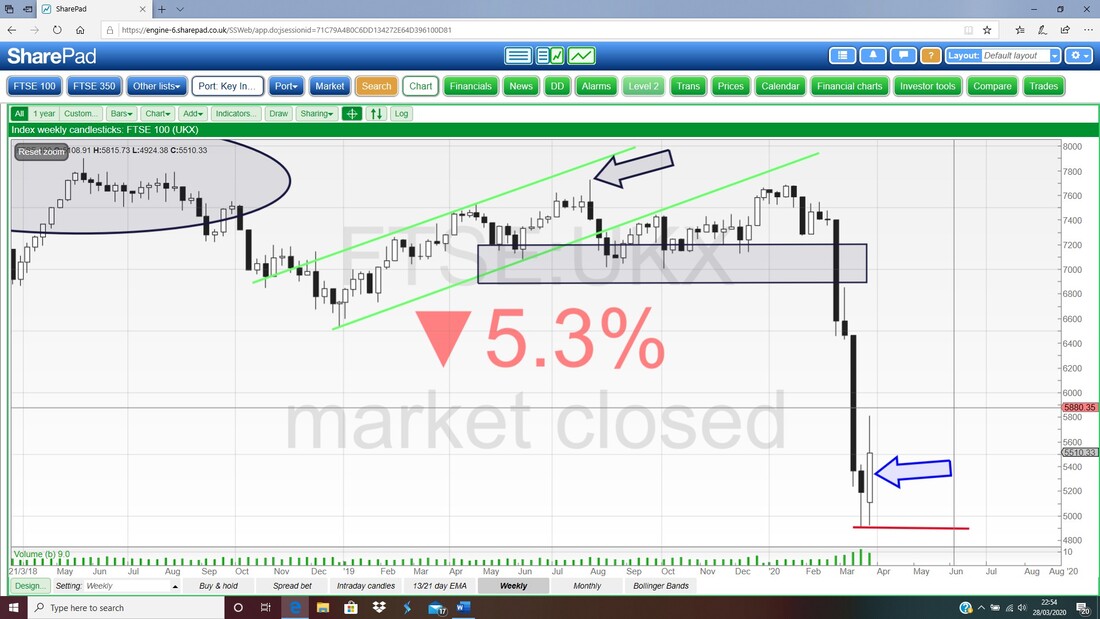
On the Weekly, like the S&P500, we have a Bullish Engulfing Candle. If this is predictive, then we need to see a rise off this next Week. The High at 5815 is Resistance that needs to be cracked if the Bulls are going to inject some life into this Market.
There are a few things on the next Chart. Here we have Daily Candles and my Blue Arrow is pointing to a Big Black Down Candle from Friday and it looks to me like this is Turning down. For Bulls to get things moving here they need to take it above Resistance at 5815 which is the High on Thursday.
To the downside, my Red Line (Red Arrow), is crucial Support at 4898 and if this fails then we will likely go much lower. Such failure of important Support is a Sell Signal. My Green Arrow marks the ‘Bear Cross’ on the 13/21 Day EMA Lines and these are in Bear Mode. 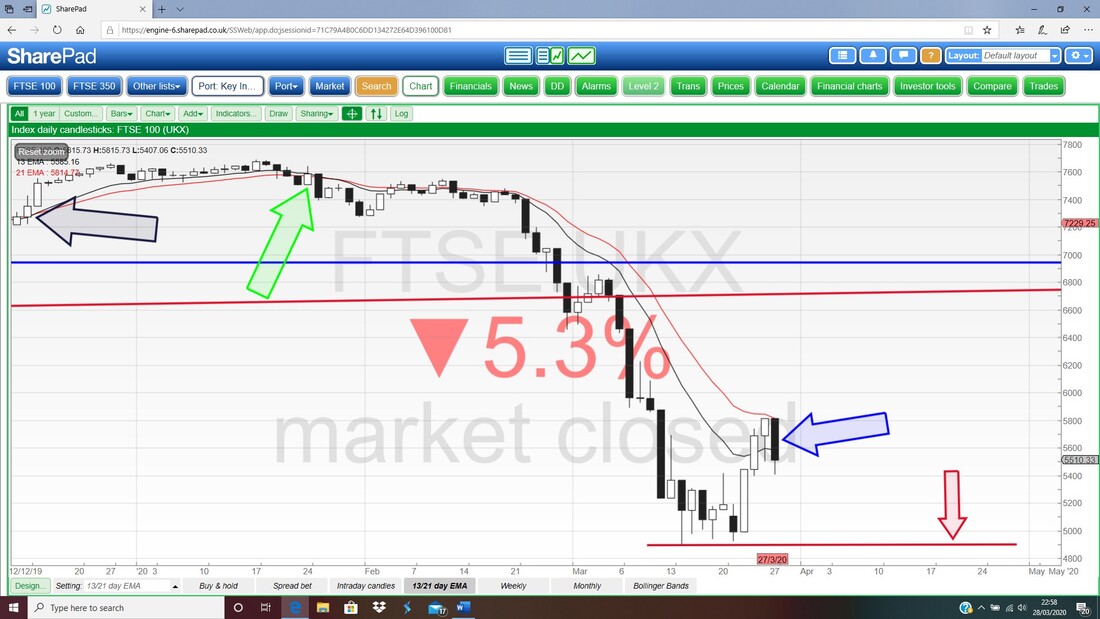
Last up here are the Daily Candles with the Pink Zone marking the Upper and Lower Bollinger Bands. I wasn’t going to show this but there is something to note which is where my Red Arrow is the Price had turned down from the Upper Band. That is textbook stuff.
OK, that’s it for now, I hope you enjoy the Podcasts and the Blogs I have published recently and make sure you stay tuned because more Blogs are on the way and no doubt another Podcast will appear in due course. Good Luck and all that, WD. 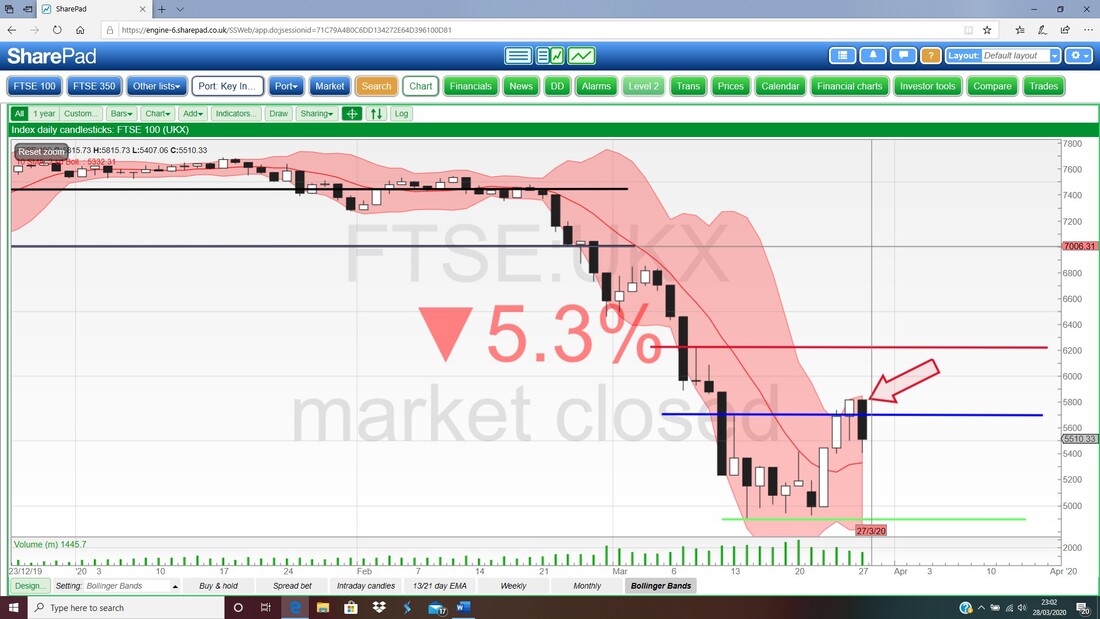
0 Comments
Leave a Reply. |

Stocks & Markets WheelieBlogsThese tend to be more Markets and Stocks related and timely - the Blog Page on the Main WheelieDealer Website has the 'Educational' stuff (well that's the theory anyway !!). Archives
October 2021
Categories
All
|
