

|
stocks & Markets blog |
|
Rightly or wrongly, we seem as a Nation to be fully in the tractor-beam of another total Lockdown and of course the economic, social, cultural, health, political, etc. ramifications of this are immense and there are no upsides here. With such a backdrop it seems to me that this is an extremely dangerous time to be buying Stocks and I am now up to 50% Hedged via FTSE100 Short Spreadbets (see my ‘Trades’ page on WD1) and I have no intentions of buying anything, and my bias will be to the sell side.
On top of all the Virus challenges, we also have a potentially very messy Presidential Election in the US and later this coming week there is another TV debate between Biden and Trump which is unlikely to calm the waters in any way. I think the Election is a couple of weeks away and it would be nice to see that sorted but my fear is that if Biden wins then Trump won’t accept it with any kind of grace (blimey, what an understatement that is) which could mean all sorts of strife both in the Courts and on the Streets.
A shock Trump win would be no better with the Left going insane and they never need much incentive to get burning their own Cities. After 4 years of the Democrats trying every trick in the book to evict Trump from the White House, there is no way another 4 years won’t create the same levels of division and rage.
And on top of all this we have the very real prospect of a ‘No Deal’ situation once the Brexit Transition Period ends along with 2021 coming into view, and although my gut feeling is that a Deal will be done, it is by no means certain and this could cause more worries for the Stockmarket to deal with. We also mustn’t ignore the fact that C19 seems to be rising across Europe and a Second Wave looks to be in fine fettle and taking hold. If the only ‘solution’ is the destruction of Economies then it seems highly likely we will see more protests and many variations on the division that is sadly all over the Western World at the moment. So you can see why I am in no mood to be heavily long on Stocks !! My Strategy is always to ‘put the hammer down’ when times are good (that’s been pretty rare in recent years !!) and when the outlook is iffy I take my foot off the gas and ease on the brakes a bit. We are most definitely in the latter situation at the moment. Last Week The Markets woke up to the potential for Lockdown last week and we had a couple of pretty rough days where my Portfolio took some pain. As a result my Portfolio was down 1.4% on the week and the YTD since January 1st 2020 is slightly up at 0.8%. I was hoping I could see more progress into Profit before we got a sell-off but it strikes me that this could be wishful thinking. I have pushed my Hedging up to 50% and I think we could be in for some tough weeks ahead. The irony is that there are many Stocks which look attractive on Fundamentals but when the overall mood goes grumpy it is very difficult for any Stocks to make upward progress and I am quite happy to sit aside and let things play out. With 50% Hedging I am protected on the downside and if the Markets miraculously rally, then I am biased to the Long side and I can easily turn my Hedges off if I need to. If I fail to react as would be best, then the Stoplosses I have on the Hedges will kick in and mean that any cognitive failures on my part are soon corrected. TPI 33 Normally when we put out a new Podcast, a few days later I will upload some ‘special html code’ to the ‘Twin Petes Investing Podcast’ page that I get sent by an expert. However, for whatever reason I have not received it this time and as a result some Readers may not realise the new Podcast has been issued. Anyway, if you have not heard it yet you can find it below. You can find TPI 33 on all sorts of Platforms such as Apple, Spotify, Overcast, Audioboom etc. If you go to the ‘Conkers Corner’ channel you will find it there. You can also hear it on Soundcloud via this link: https://soundcloud.com/user-479955511/conkers3-wheeliedealer-33-risks-of-herding-cine-boo-dddd-itm-lxi-sre-inl-ai-av-aaz If you haven’t heard them before, you might find the back archive of Podcasts worth listening to. To a large extent the material won’t date much. Blog Slate A few days ago I published an Educational Blog on WD1 about the importance as I see it of Specialisation and Focus and this also contains some discussion around ESG Funds (Environmental, Social and Governance). I also made good progress on the Draft Blog that I intend to issue to a Magazine to publish and I hope to get that finished within days and sent off to them. I am not sure if and when it will appear, but don’t worry, you will see it soon enough and it will be free to view. If the mag doesn’t want it, then I will publish it as a blog anyway (waste not, want not). I haven’t decided what to start writing next although I have the embers of an idea to write a blog about Director Dealing and what to look for etc. If I don’t go for that one next, I am pretty sure it is something I will address in coming weeks or months – it is on my extensive list of things I fancy writing about. I think we will be recording Podcast TPI 34 during the coming week so that should appear around next weekend – there really is no peace for a very wicked WheelieDealer. From previous Dark Ages Over the last 6 or so years I have written loads of Blogs and the vast majority are timeless and well worth revisiting or reading for the first time if you have only recently discovered the whole WD fiasco. If you go to the ‘Blog Index List’ page on WD2 then you can see the full gamut and all the Educational ones have Links so they are easy to select. From the archive I bring you this one which is rather wacky (I must have been on something when I wrote it !!) but I think there is an important principle when it comes to proper Long-Term Investing (not the Position Trading that I regularly see masquerading as Long-Term Investing): https://wheeliedealer.weebly.com/educational-blogs/horsing-around-this-weeks-sporting-coverage-comes-from-epsom-part-2-of-2 Better see what the Charts are predicting for us then…….. S&P500 As is always the case, the Charts I reproduce here are screen-grabs from the superb SharePad software I use and if you click on them then they should get larger on your screen so you can see more detail. If you fancy using SharePad or ShareScope then there are loads of Banners and stuff around my Websites that you can click on to sign-up and you will get a month’s free data. You will also get me a little bonus so that always helps the Wheelie Beer Fund which is getting rather large because I am not down the boozer enough !! As we all know, the US Markets really set the tone for other global Markets so I am always interested to see what the Charts over there are saying and the best representation is the S&P500 which I see as a bit of a cross between the DOW and the Nasdaq. On top of this it is always best to start with the ‘big picture’ and then to drill-down to more fine detail on shorter timeframes. I am starting off with the big picture and the Chart below has the S&P500 going back to the 2009 Credit Scrunch shellacking. Please ignore all the little Arrows and other mess on this Chart, but the main thing here is that Blue Line pointed at by my Blue Arrow and this is long-term Support and suggests if we were to get a big sell-off, then Support from this Line could kick-in around 2750 to 3000 ish. And of course the other obvious thing to note here is that historically the current Price Level at 3483 is a long distance away from the Blue Line and that is possibly an unstable condition. 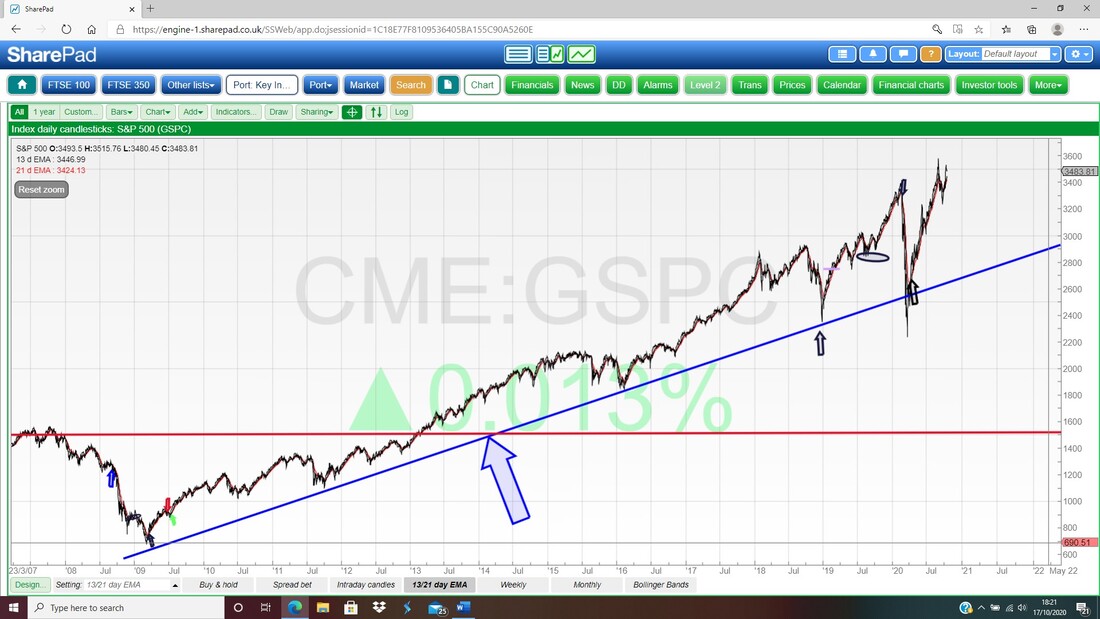
My Chart below for the S&P500 has the Daily Candlesticks but I am not yet looking at those and I draw your attention to the Blue Arrow which marks a ‘Bull Cross’ between the Black 13 Day EMA Line (Exponential Moving Average – more weight contributed in the averaging calculation to more recent days) and the Red 21 Day EMA Line. This is still ‘in force’ and as long as the Black 13 Day stays above, then Bulls should be smiling.
There is something else important to watch on this Chart. Above the Blue Arrow you should see a Black Ellipse which captures the All Time High (ATH) up at 3588 and then look at my Red Ellipse which captures the next Peak at 3550. What is worth noting here is that the Second Peak is lower than the All Time High – this might be nothing to be worried about but on the other hand it could be a sign that the Bulls are unable to recapture the previous High. The same inability to recapture the Highs is evident on the Nasdaq also – check it out for yourself !! 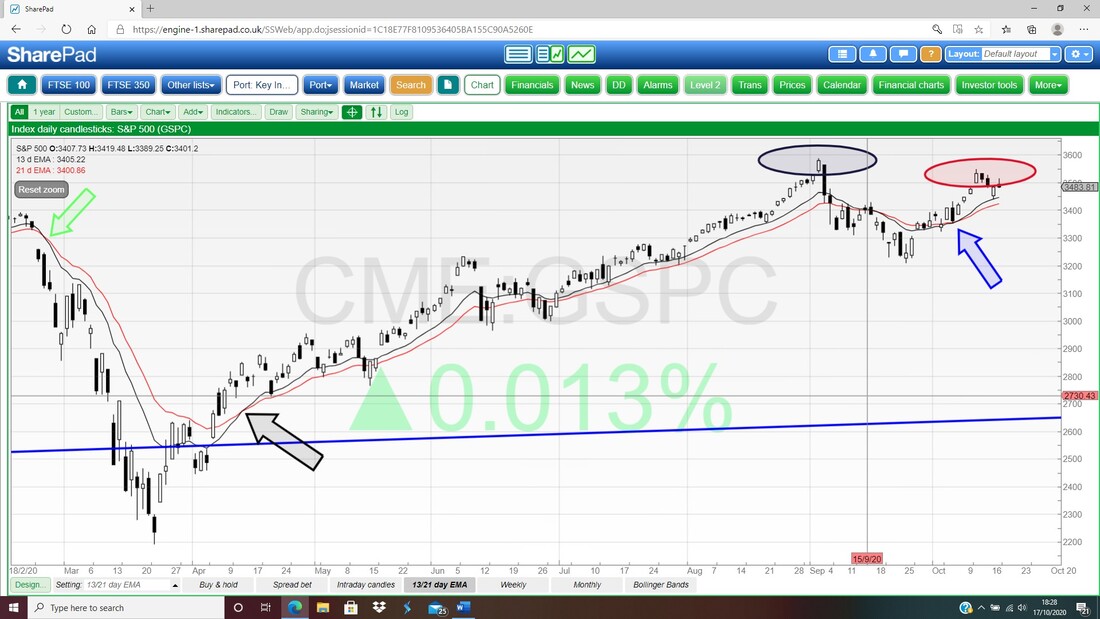
My Chart below has the Weekly Candles for the S&P500 and my Blue Arrow is pointing at a ‘Long Tails Doji’ Candle from last week. This could be a Turning Point Down after the move up of recent Weeks. In fact, there is more evidence for this from the Nasdaq which I will show you in a tad.
If the S&P500 does drop back, then there is Support at a shade above 3200 where my Black Arrow is and down below that there should be Support from 3000 and my Red Line at about 2965. 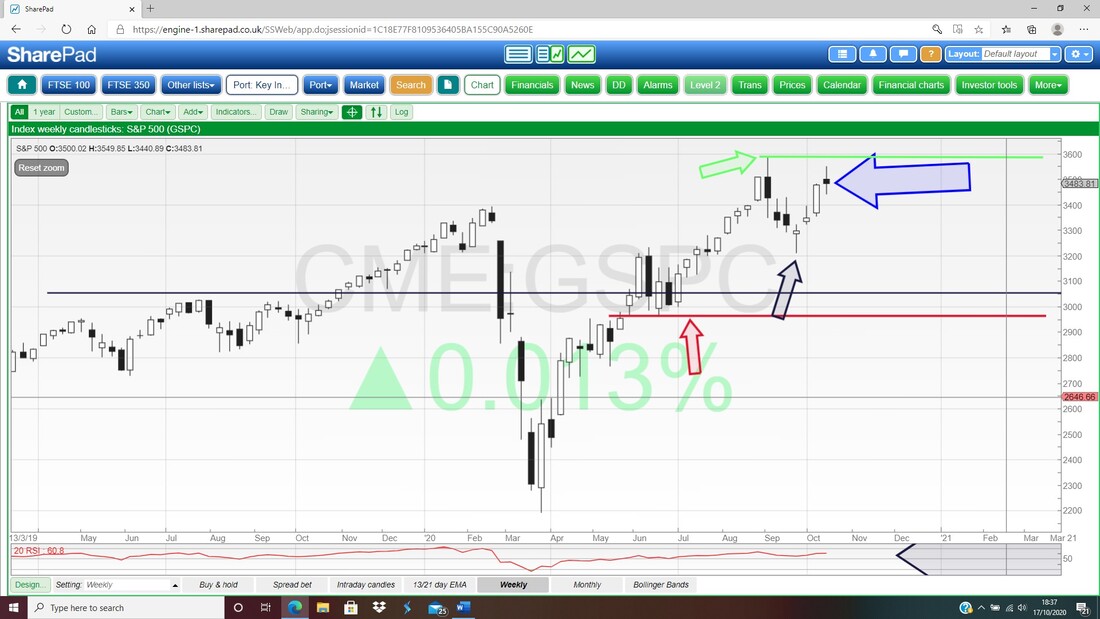
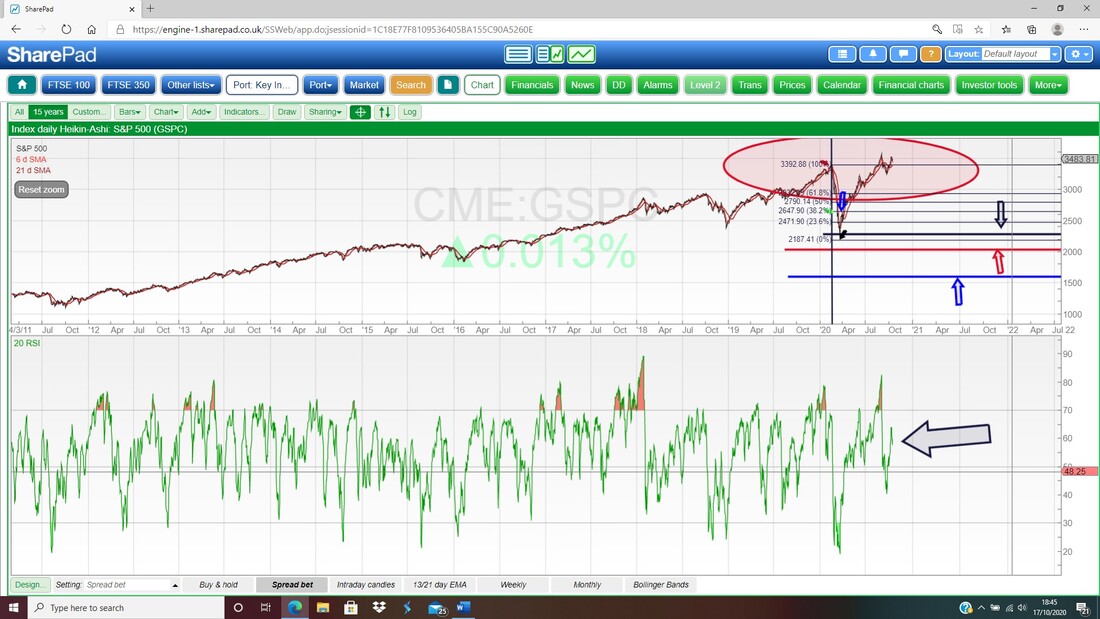
In the bottom window on my Screen below, we have the RSI for the Daily S&P500 (Relative Strength Index – I see this as the force of a move – it is like the acceleration or deceleration) and my Black Arrow is pointing to where we are now at about RSI 60. This is not all that far above the Neutral 50 level and is not Overbought in any way.
My final Chart for the S&P500 has the Daily Candles with the Pink Zone marking the Upper and Lower Bollinger Bands. My Blue Arrow is pointing to a ‘Bearish Shooting Star’ Candle from Friday and the High here was 3516 so that is Resistance that needs to be got over now by the Bulls. Above that we have Resistance at 3550 which I showed on a previous Chart.
To the downside, we have Support from the Red Bollinger Midpoint Line which is at about 3462 and my Red Arrow is pointing at this Line. Below that the Bottom Bollinger Band is at about 3365 and that could be Support. 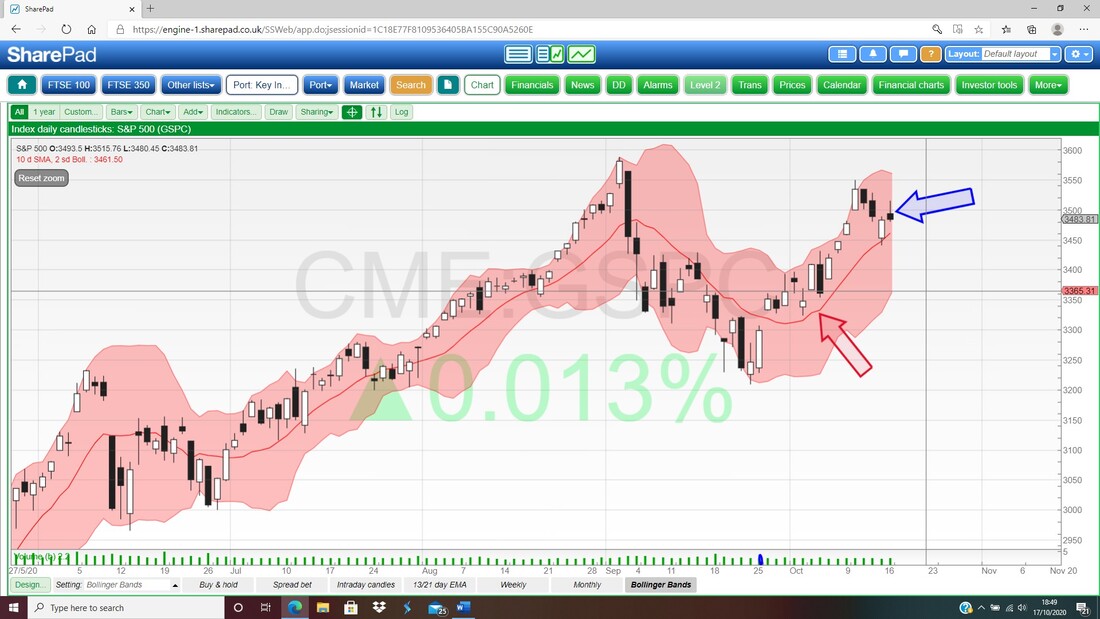
Nasdaq Composite Index
As promised, here is the Weekly Candles for the Nasdaq Comp and this is really important because it makes up something like 20% of the S&P500 and to a large extent I find that the S&P500 just follows the Nasdaq. My Blue Arrow is pointing to a ‘Bearish Shooting Star’ from last week and this suggests the Nasdaq Comp will drop back from here and this is clearer than the evidence from the S&P500. Of course, you cannot 100% rely on any Candlestick, but Bearish Shooting Stars do have a high probability of predicting a fall of some sort. 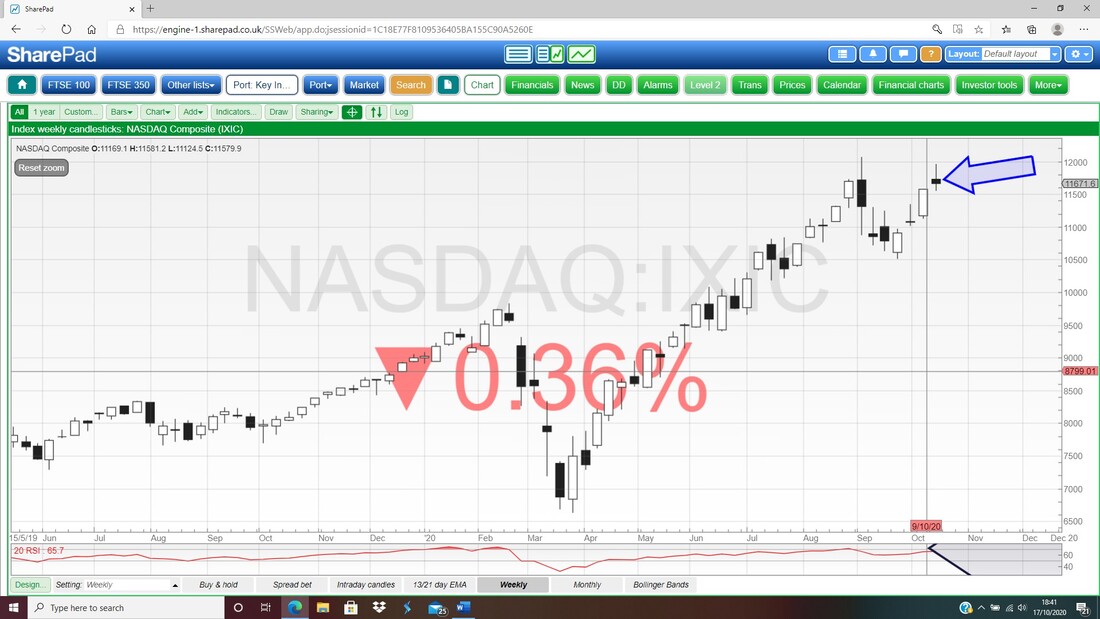
Brent Oil Composite
This is quite an interesting (and to me a bit surprising) situation where my Black Arrow on the Chart below is marking a ‘Bull Cross’ between the Black 13 Day EMA Line and the Red 21 Day EMA Line. I am Short on the FTSE100 so I am always looking at Oil because it can have quite an impact on the FTSE100. The Candles here are Daily ones and next Resistance is $43.6 and then we have $44 and $44.3 – if it can get over the latter that would be quite Bullish. To the downside the important Support is now where my Red Line is at $38.8. It’s quite amazing that we have the 13/21 Bull Cross although it could be that Brent Oil is in a bit of a Sideways Range. With Economies around the globe struggling, it is hard to see much upside for Oil. It seems that China is doing better than others but I wonder how long that can last and will that be enough demand to offset a fall in demand elsewhere? 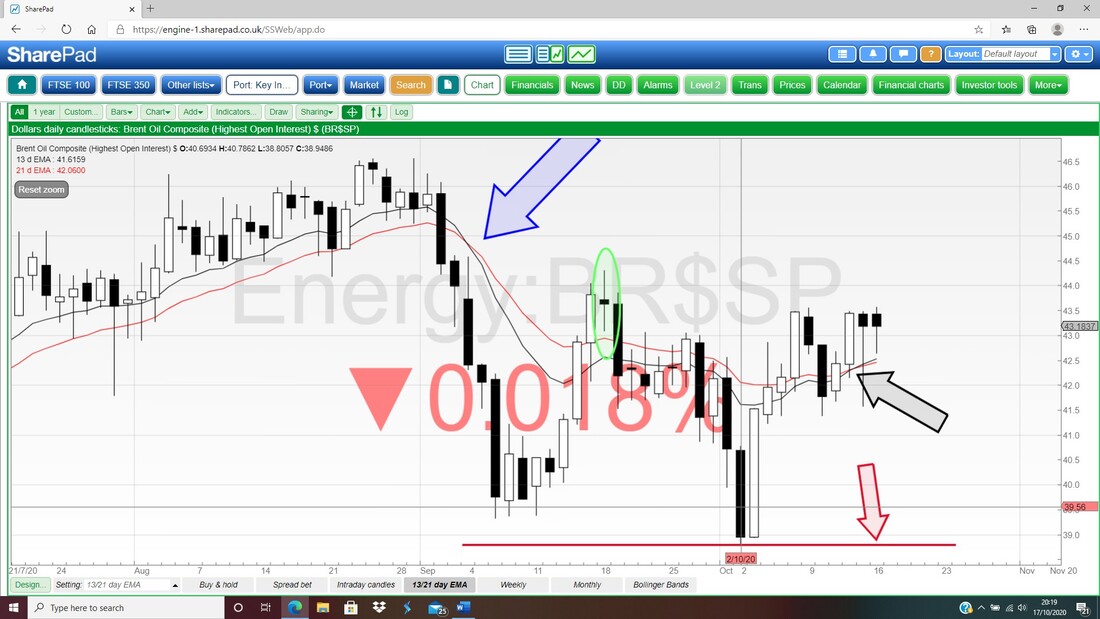
FTSE100
First up the Daily Candles for the FTSE100 but I am really looking at the 13/21 Day EMAs here. My Blue Arrow is pointing to where we had a very short-lived Bull Cross where the Black 13 Day EMA crossed over and above the Red 21 Day EMA Line but then within a few days it had done a ‘Bear Cross’ and this is significant because the Bulls were handed a golden opportunity on a platter and they failed to capitalise on it. Note also my Green Line and how this is a declining Line of Resistance – I will look at this more in a mo. 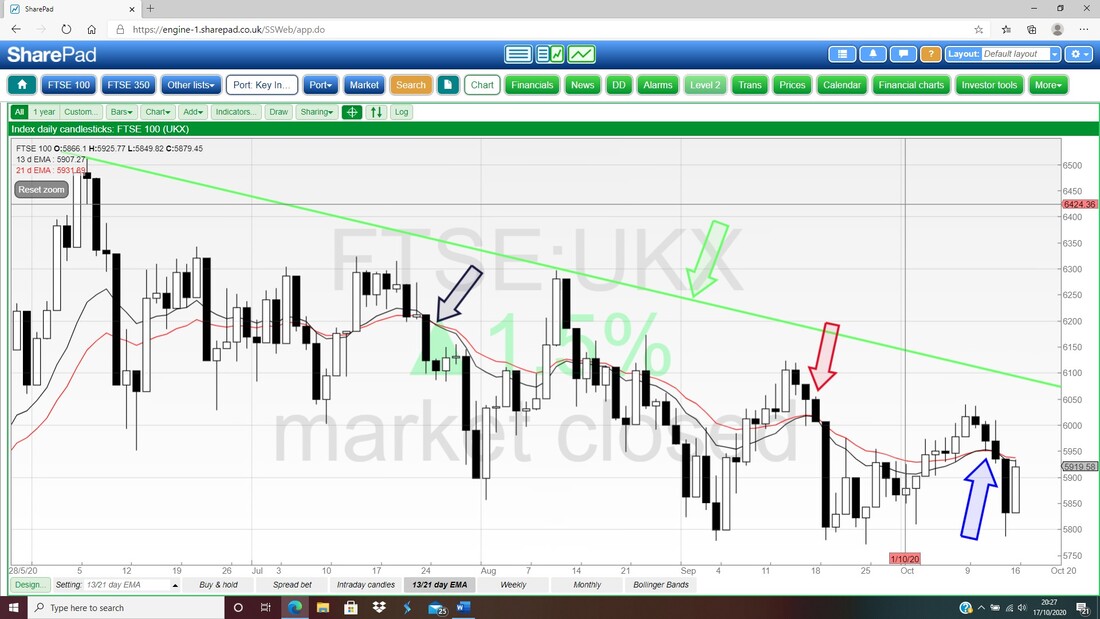
I spotted this Triangle a while back and I think I have mentioned it on the Tweets a bit but not really explained it. Anyway, this has potential to force a drop on the FTSE100 and what seems to be happening is a ‘Triangle Squeeze’ where the Hypotenuse which is my Green Line (marked by my Green Arrow) is pushing down towards the Horizontal Line at the bottom where my Red Line and Red Arrow are at 5771.
5771 really is the key here and if that fails then we could see a drop equivalent to the ‘Height’ of the Triangle – to be honest that Height is unclear to me but could be as much as 500 Points which would take us down to 5300 ish. If you are struggling to visualise this, then look at my Smaller Blue Arrows which are pointing out how the Peaks are successively falling. To avoid a Bearish scenario, then the Bulls need to force a clean Breakout over 6040 in the first instance, and then 6124. This Triangle Squeeze is one of my main rationales for my Shorts. 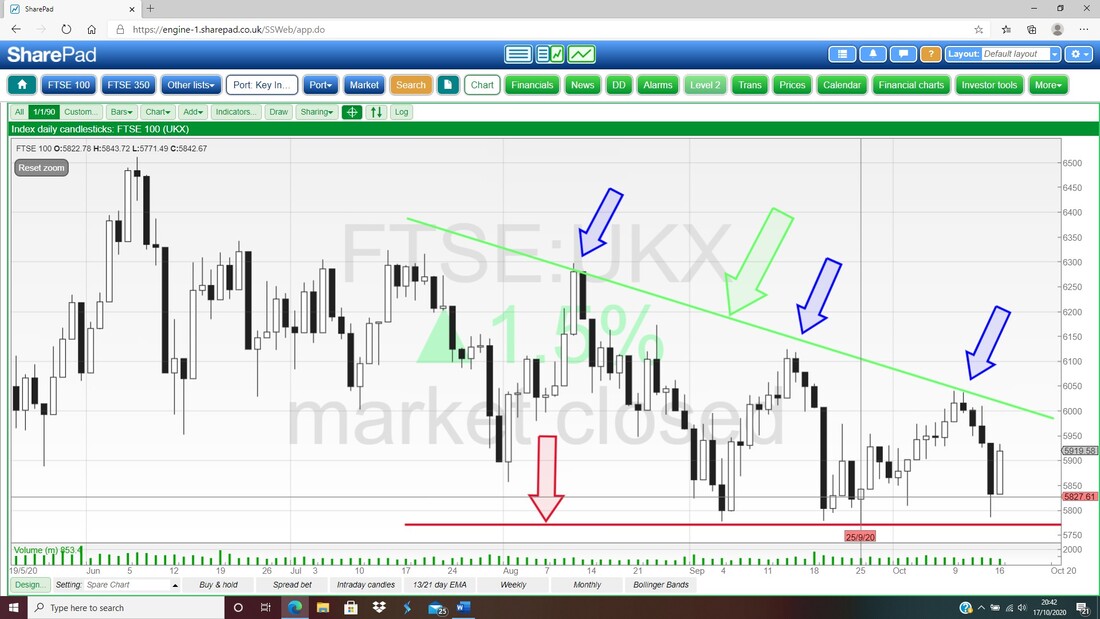
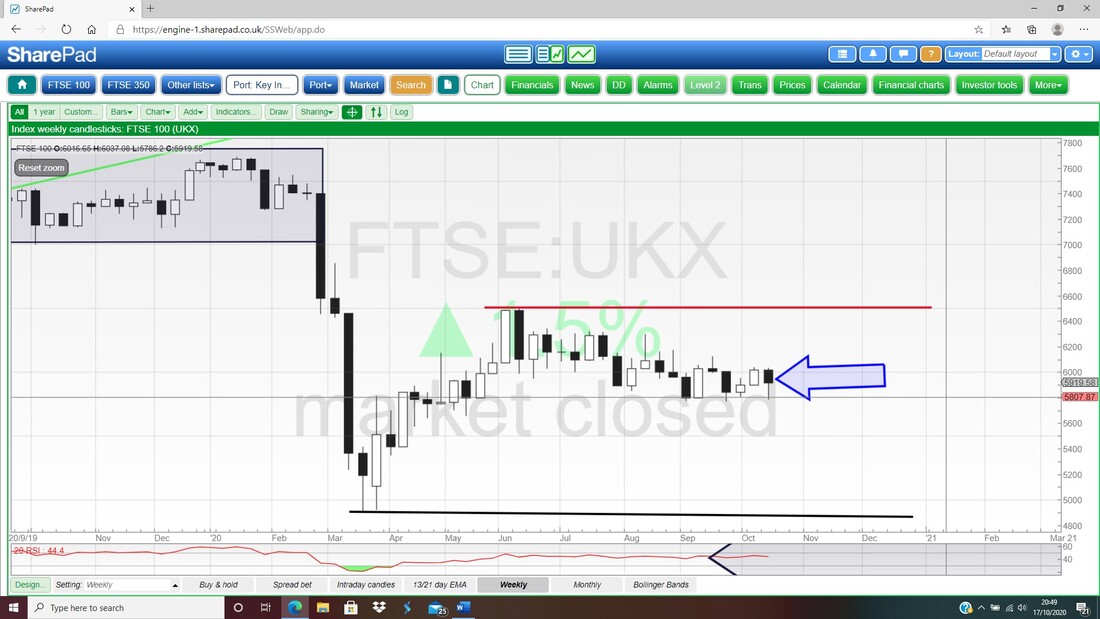
Next we have the Weekly Candles for the FTSE100. My Blue Arrow is pointing to a Down Candle for last week but it doesn’t really tell me much. To simplify things, it is all about that Triangle Squeeze and the Support and Resistance now.
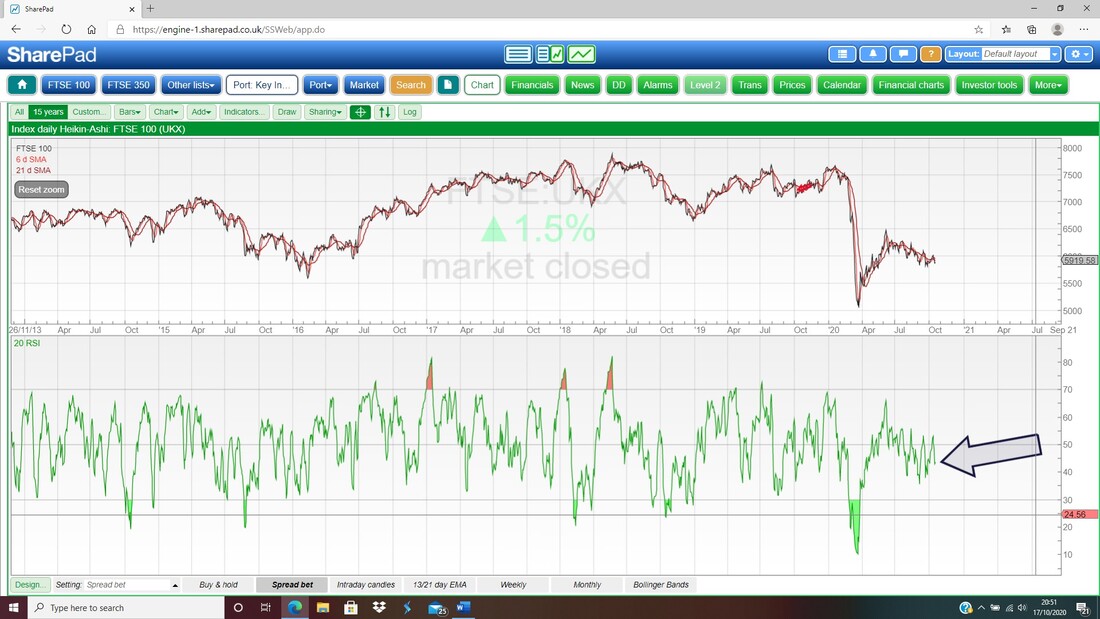
In the bottom window below we have the RSI for the FTSE100 Daily. On a Reading of RSI 43 where my Black Arrow is, this is not far off Neutral and doesn’t tell me a lot. If it wants to, it can drop a lot more.
Finally tonight we have the Daily Candles for the FTSE100 with the Pink Zone showing the Bollinger Bands. My Blue Arrow is pointing to a decent Up Candle from Friday which bounced off the bottom Bollinger Band and the Midpoint Line (the Red Line) could be Resistance at 5950. Above that the Top Band is at 6046 and in between those two there is Resistance at the psychological 6000 level.
In combination with the run of Down Candles before Friday, we might see more of a move up here but watch out for that Triangle Squeeze. OK, that’s it for this week. Good Luck in coming days and stay away from the dreaded lurgy !! Cheers, WD. 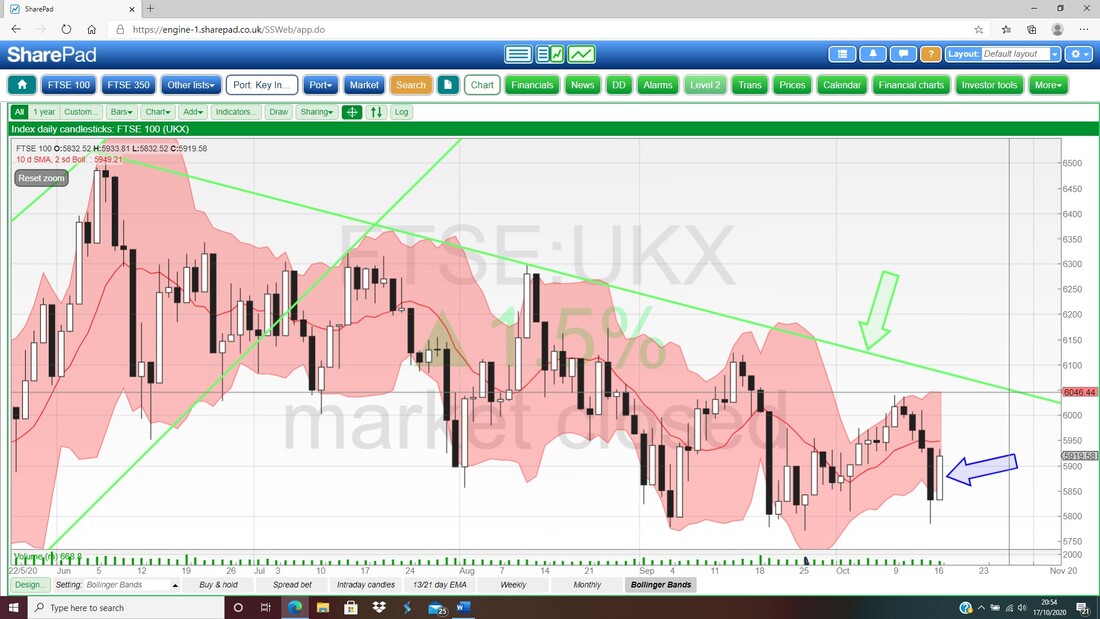
2 Comments
Paul Hunt
10/18/2020 02:49:12 am
Hi Pete, fascinating as usual. it was Warren Buffett who said be brave when others are fearful. I am fearful as well but remain fully invested long in a selected number of shares of which i have doubts about 2 but cannot sell them in any size so will hang on and see what happens.
KevinS
10/18/2020 10:58:39 pm
Hi Pete, an interesting few weeks ahead before the election on 3rd Nov. I think history shows the US markets normally rise in an election year, however, who knows with the Covid mix, along with the messy election etc. Leave a Reply. |

Stocks & Markets WheelieBlogsThese tend to be more Markets and Stocks related and timely - the Blog Page on the Main WheelieDealer Website has the 'Educational' stuff (well that's the theory anyway !!). Archives
October 2021
Categories
All
|
