

|
stocks & Markets blog |
|
Unusually I am starting this on Friday night because I have some other plans for Sunday; but unfortunately my ongoing health lament is really playing up today and I am right grumpy. On that particular issuette, I spoke to a Consultant at Stoke Mandeville Hospital earlier in the week, and it looks like I will at some point get an MRI Scan and most likely other stuff like X-Ray and Ultrasound, but the catch is that it could be as much as 3 months away.
I have mixed feelings about this. Clearly the NHS is absolutely jammed solid with a huge backlog of work and it is also still fighting the C19 disaster, so I can see why there is a long queue. This suits me in that I am not overly keen to go near a Hospital (which seems to be a major hot spot of C19 infection), even though I have had my first vaccination stab and my Consultant would prefer me to have the second prick before I go in. The vaccines do not prevent you getting C19, although it probably means you won’t expire – but with my useless lungs I don’t fancy getting it at all.
Most days the aggravation I get from the problem is pretty low level and I am very used to it (so much so, that when a mate asked me why I wasn’t all that perky, I didn’t even mention the health problem and I think it is just the usual Lockdown lurgy, grotty weather, and a miserable market never helps my mood !!). Today it has really been playing up though and if it was to be like this for another 3 months I doubt I would last without freaking out at my GP !!
The Nasdaq took quite a kicking on Thursday, falling about 3%, and this confirmed my suspicion that the extreme valuations are finally catching up with reality and the moves out of Tech and back towards ‘old fashioned’ stuff seem to be still happening. It is a tough call but there are clues in the Charts which I will look at later in this blog, and I placed a tiny Short on the Nasdaq 100 on Thursday Night and if you look at my ‘Trades’ page on WD1 you can see more about it. At the moment I only have a 3% Short Position (equivalent to 3% of my Long Portfolio) and I have gone small because the Nasdaq can whipsaw like a crazy mad whippet on speed and I am trying to be super cautious. Having said that, I might add to the Short a bit (probably double it or maybe triple at the most) if I see more Bearish Signals. Last Week The week started well and my Portfolio was going really well up to Wednesday Night, but then on Thursday it got a smack and was a bit weak today, with the result that it only gained 0.5% on the Week. I am not complaining though because with the mood most definitely going more grumpy towards the end of the week, I think that is not too shabby a result. On top of that, I had a lot of Results on the Companies I hold Shares in, and there weren’t really any bad ones although Fevertree FEVR did drop a lot. That is not too wearisome for me because I want to buy more FEVR and it has always seemed so highly valued. If it drops quite a bit more, then I might be tempted in to top up because I think the long-term outlook here is superb. In a similar vein, I wouldn’t mind Hotel Chocolat HOTC dropping back because I want more of that but the valuation is pretty daft really. I think I actually bought some more Aviva AV. earlier in the week and if you look at the ‘Trades’ page it is all on there. As per my Blog from last week, AV. looks crazy cheap and I am expecting plenty of upside in the next couple of years. So, in general I am not doing very much. With the Markets going a bit grumpy and with the end of the month coming (both January and February wobbled quite a bit in their last weeks), I am only going to tinker at the edges if I do anything, and I might be looking carefully to see if I need to Hedge my Portfolio in a meaningful way – but I am trying to only do that if there is a clear need to. Overall I think these Markets can still rise but they are overdue a bit of calming down – especially in that US Tech which is pretty daft. Blog Slate Well there is not much to report here. I so want to crack on with the LOK blog but it just isn’t happening. If I get inspired, I will try to get Part 1 finished but I am struggling to get motivated and I am not finding it easy to sit at my desk and type. So not much got done last week and I didn’t even get sent the HTML Code I need to shove the Whizzy Widget in for the most recent Podcast, TPI 44, which goes on the ‘Twin Petes Investing Podcast’ page. Hopefully that will arrive next week, and in the meantime if you want to listen to it you can find it on Soundcloud via this link: https://soundcloud.com/user-479955511/conkers3-wheeliedealer-44-recycling-profits-tsla-bngo-smt-pct-rst-rwi-tbld-ctec-itv As ever, if you go to the ‘Conkers Corner’ Channel then you should be able to find TPI 44 on Platforms like Apple, Spotify, Audioboom, Google+, Overcast, YouTube and others. Found under the Earth’s Crust Every blog I have bashed out since starting the whole WD nonsense can be found listed on the ‘Blog Index List’ page on WD2. The Educational blogs all have links and they should be simple enough to track down, and from that list I bring you this one which you might find worth reading: https://wheeliedealer.weebly.com/educational-blogs/style-anomalies-momentum-and-defensives-outperform That’s from February 2019 which seems like a very long time ago !! Right, let’s look at that goddamn Tech Index……. Nasdaq 100 As is always the way, all the Charts I show are taken as Screen-grabs from the excellent SharePad software that I use, and if you click on the images then they should get bigger on your screen so you can see a bit more. I recommend you view on something bigger than your Fone !! If you fancy using SharePad or ShareScope yourself, then there are ‘Adverts’ all over my websites which you can click through on and get a Free Month of Data when you sign up, and I get a small payment for ‘introducing’ you; Thanks for that. You can also use the link below to get to their website, and if you go to the ‘subscribe’ bit for the product you want, then there should be a ‘promo code’ box and if you type ‘twinpetes’ in that box then you get the Discount of 1 month Free Data (this takes the form of a 13th Month if you sign up to pay for 12 months in advance, and if you do the Monthly Payments then you get the 2nd Month Free). https://www.sharescope.co.uk/ Normally I look at the Nasdaq Composite Index but because igIndex only do a Spreadbet on the Nasdaq 100, it makes sense for me to focus on that one. In truth, they move in a very similar way with the Nasdaq 100 having just 100 of the biggest Tech Stocks and the Composite having loads more. This is the Chart that made me do my tiny Short on Thursday Night. I had been commenting how the 13 and 21 Day EMA Lines (the Black Line is the 13 and the Red the 21) were in Bear Mode since the Bear Cross where my Blue Arrow is, and a few days ago we were heading towards a Bull Cross (like where my Green Arrow is), but the big drop on Thursday suggests this Bull Cross will be missed and that in itself is very Bearish. These are Daily Candlesticks and you should be able to see that today (Friday) we got a small Up Candle. This is pretty usual after a big Down day and my suspicion is that it might rally a bit more early in the coming week, but then drop again. Until we get a proper Bull Cross on these EMA Lines, I think going Long on the Nasdaq 100 (or Composite for that matter) is very risky. 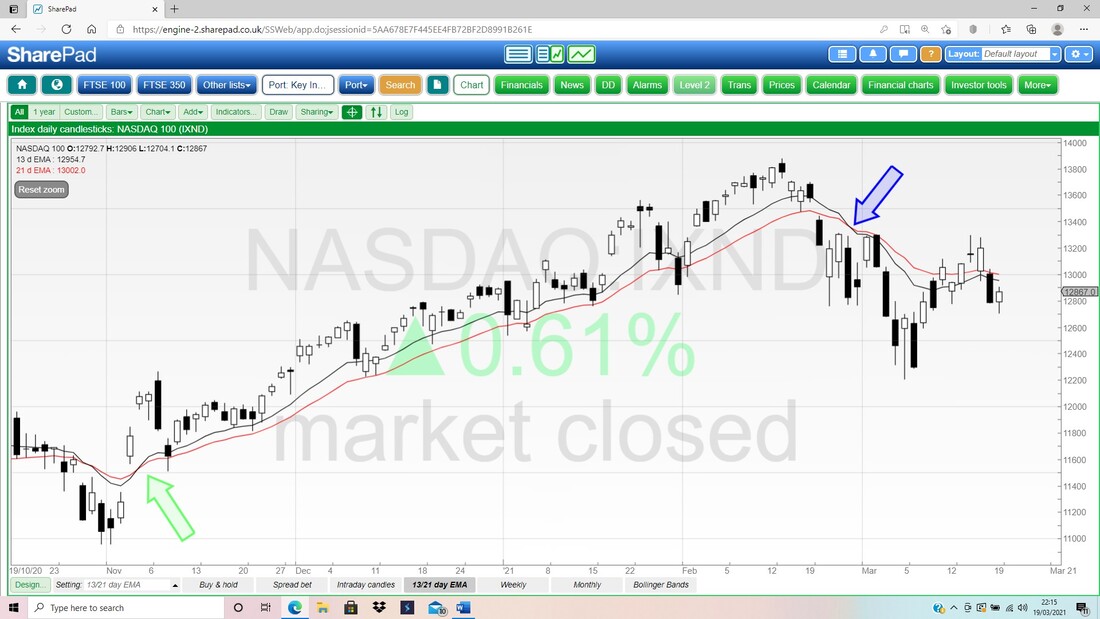
Next up we have the Monthly Candles. I showed this a few weeks ago for the Nasdaq Comp but we are now getting very near the end of March, so the Candle that is forming up for March might give us some early clues.
My Blue Arrow is pointing to a nasty looking ‘Bearish Shooting Star’ for February and the Candle which is forming up for March, is not valid yet, but at the moment it is not looking too great. If the Nasdaq 100 falls more in the coming week and we get a big Down Candle for March, then that would be pretty bad. 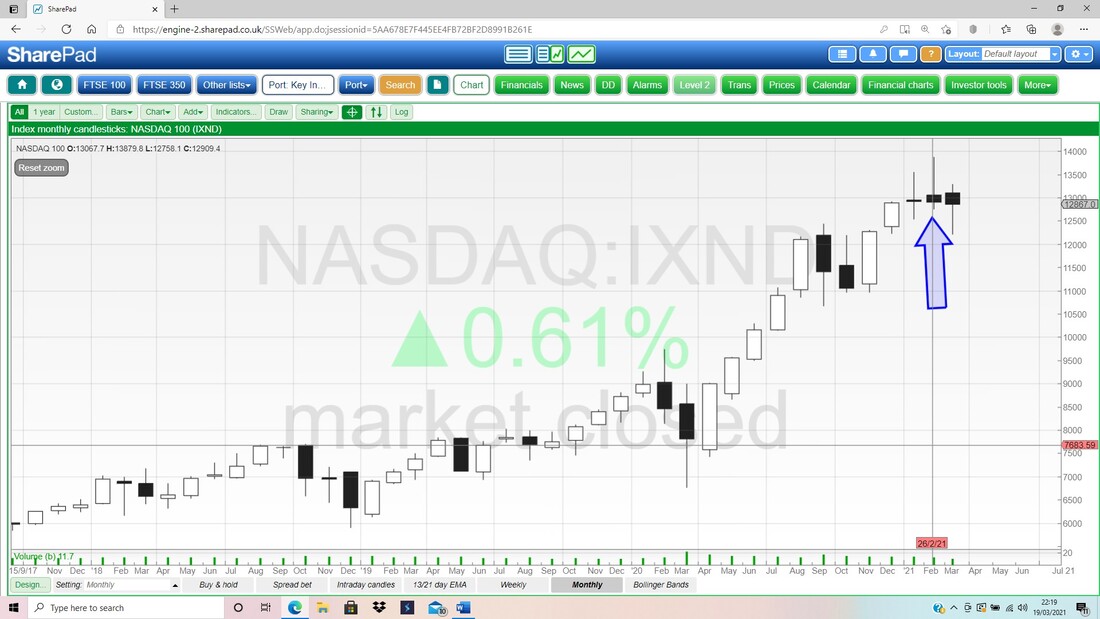
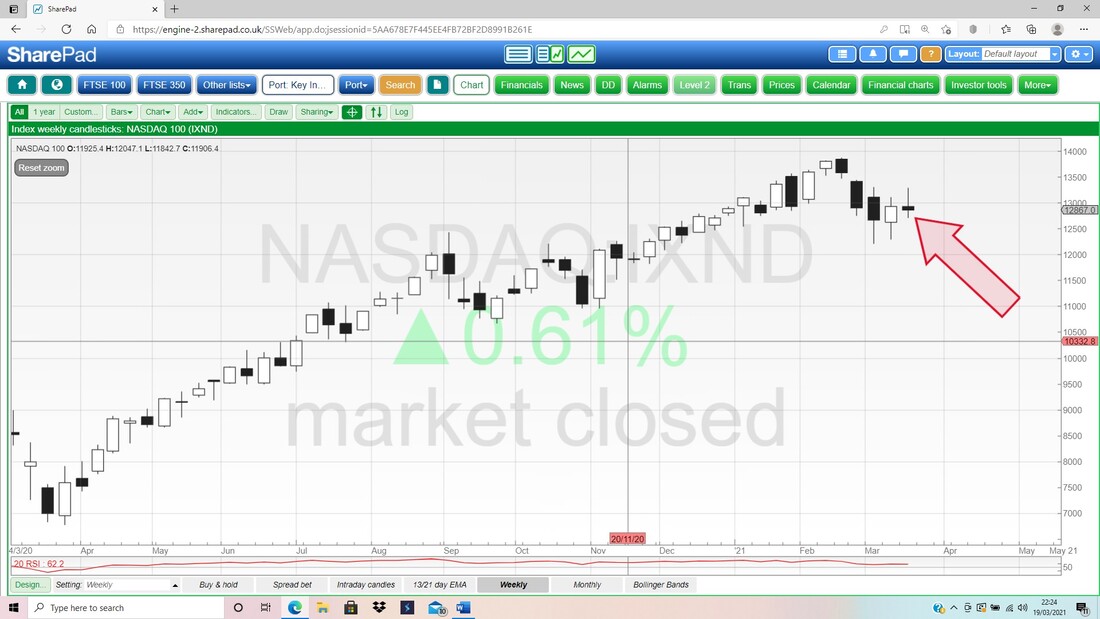
Next we have the Weekly Candles for the Nasdaq 100 and my Red Arrow is pointing to the Candle from last week which was a bit of an ‘Inverted Hammer’ kind of shape and the key thing here is that it was unable to hold the High at 13297 and this is the second failure in 3 weeks at around 13300. Down below, there is Support from 3 weeks ago at 12208 and if that fails, then expect a lot more downside.
In the bottom window on my next screen, we have the RSI for the Daily on the Nasdaq 100 and on a Reading of RSI 46 where my Black Arrow is, this is just below Neutral. However, there are a few things to consider here. Firstly, being at this kind of level, means that if the Nasdaq 100 wants to rise, then it can go a long way. Equally, if it wants to fall, then there is a long way down.
Secondly, the Nasdaq 100 was on quite a low RSI Reading and it then bounced up. However, it failed to push on and is dropping back already – that suggests weakness. 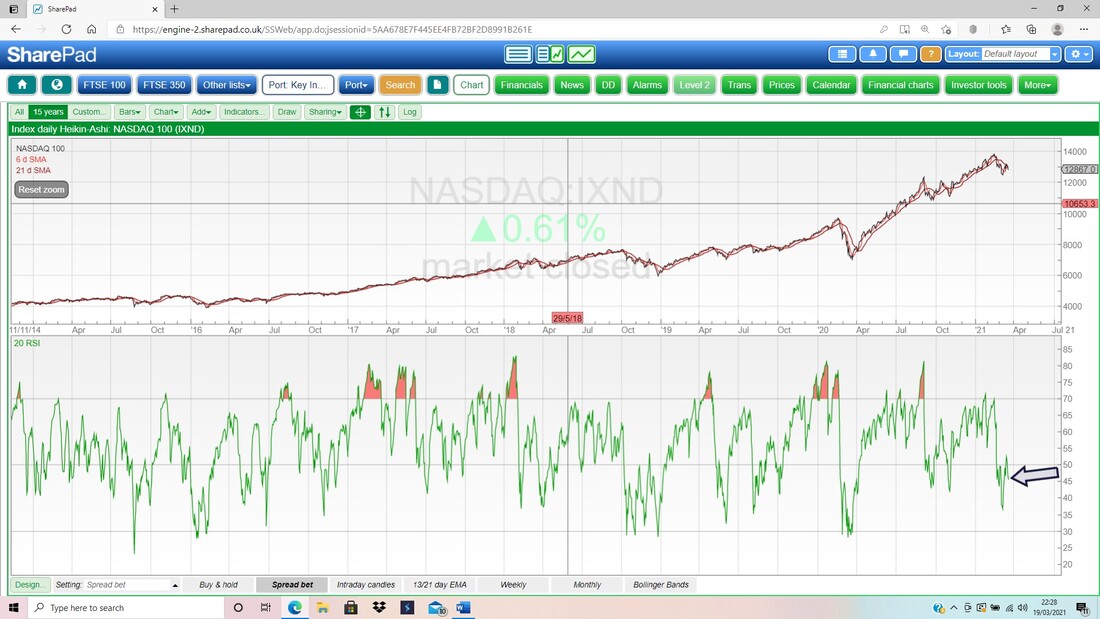
Last up for the Nasdaq 100 we have the Daily Candles with the Pink Zone marking the Upper and Lower Bollinger Bands. My Green Arrow is pointing to the Small ‘Hammer Candle’ sort of shape from today (Friday) and in combination with the Down Candle for Thursday, this could be a ‘Bullish Harami’ pattern but the context for that is weak (you should have more of a run down before the Bullish Harami really marks a Bottom).
Note how the Candle today moved up to the Red Bollinger Midpoint Line (Red Arrow) at about 12900 and then dropped back a bit. Down below, the Bottom Band is at about 12400 and that could be Support. If things get more serious, then there is Support below in a Zone between about 12000 to 10950. 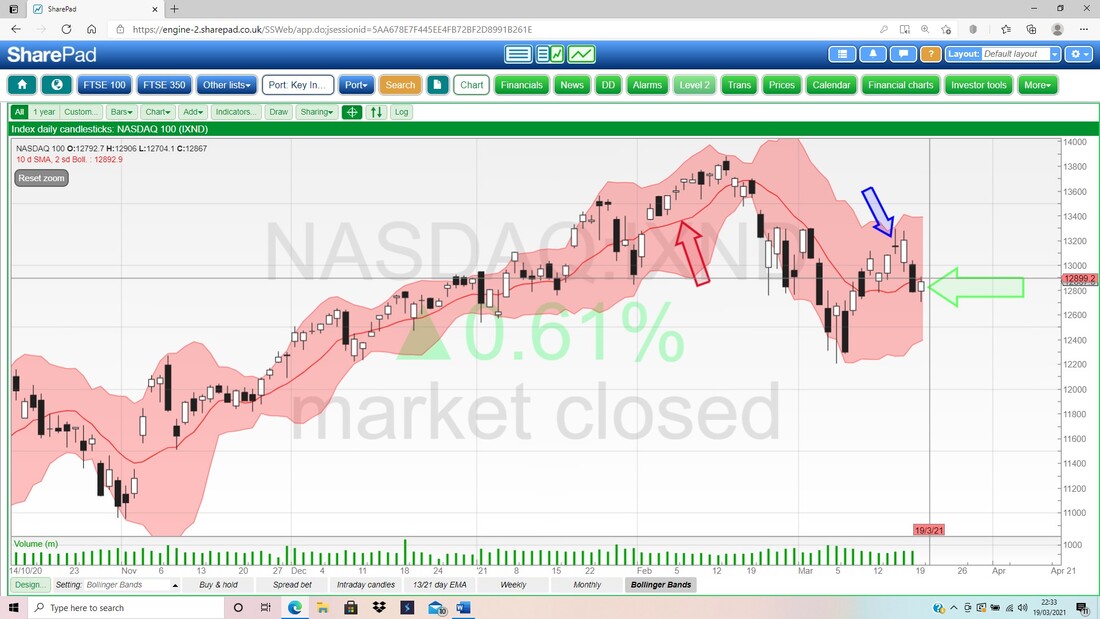
Gold Composite
Along with a fascination for US Tech, I find Gold an intriguing one because I see/hear so many Bulls (I think they might be called ‘Bugs’ cos they even have a special name), yet this is in a very clear Downtrend Channel and has been since the peak up near $2075. My Chart below shows the Downtrend Channel marked by my Blue Line and Black Line (Black Arrow) and it looks to me like the Gold Composite needs to get over about $1820 to even suggest the Downtrend might be ending. At the moment the Bear Mode is active on the Black 13 Day EMA Line and the Red 21 Day EMA Line since the Bear Cross back where my Red Arrow is. It is often claimed that Gold does well in times of Inflation – as far as I can tell it only seems to do well when the Stockmarket goes wobbly but even that is unreliable. It makes sense that Gold does well when Interest Rates are low, because the ‘Opportunity Cost’ of holding Gold is much lower (Gold pays no Interest remember and you have to pay for Storage of physical Gold); which would mean that if Interest Rates do rise, then Gold might not like it. It seems to me that the run up to over $2000 was probably an example of yet another Bubble that is a side-effect of all the loose monetary policy and QE and suchlike. If anything, Gold is prone to extended runs when Momentum probably takes it further than it should go (this happens on the downside as well !!). It is quite possible that US Tech is doing a similar thing – it has had an amazing run up to extremely high and Overvalued levels, and perhaps now it is correcting just like Gold has…. 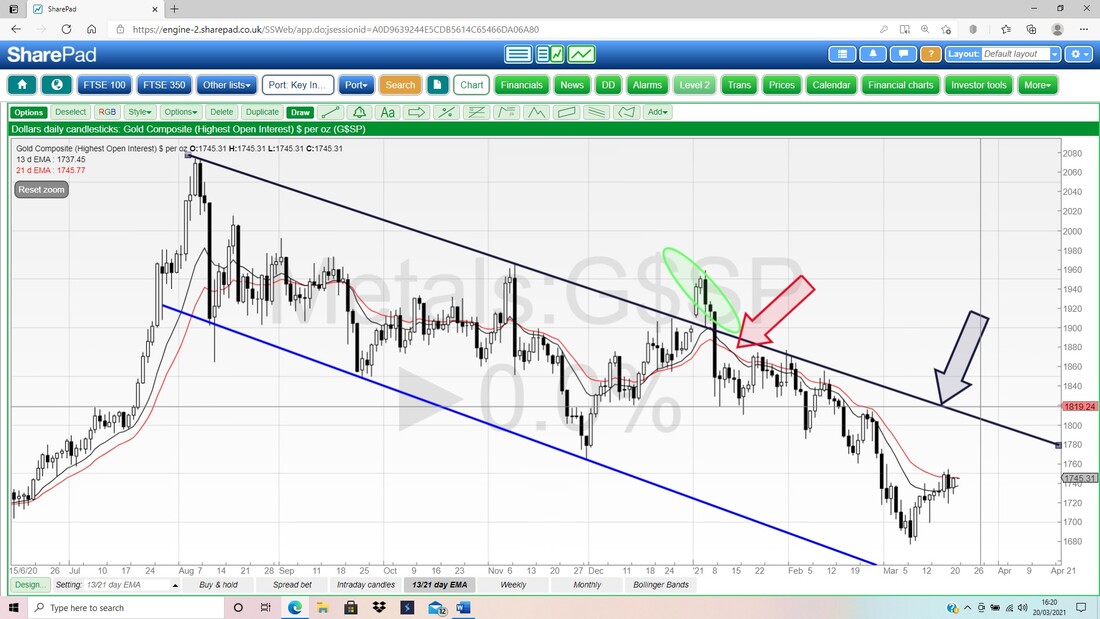
Brent Oil Composite
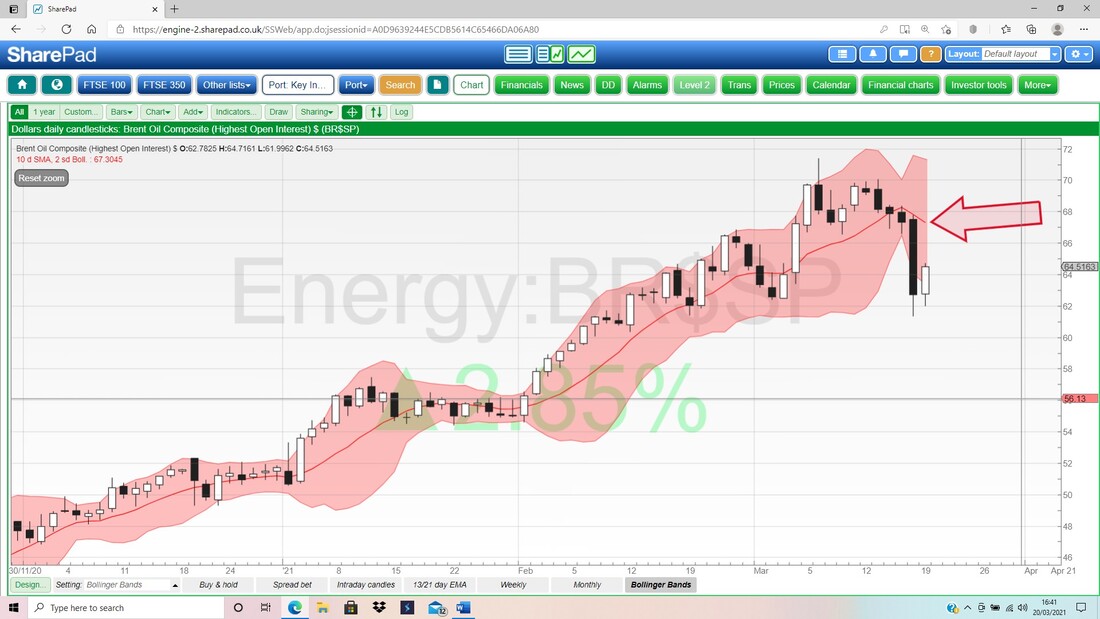
Oil is one I always want to check on because it can impact the FTSE100 quite a bit and also the DOW and the French CAC40 and German DAX seem to be quite related to how it moves (or the same forces that move Oil also move the Major Indexes – which is a possible interpretation; Causation vs Correlation and all that). My Chart below has the Daily Candles for Brent Oil Comp and the first thing to note is that there was a Bull Cross on the Black 13 Day EMA and Red 21 Day EMA Lines back where my Black Arrow is, and that has held sway for a very long time. We are still in ‘Bull Mode’ on this Signal but of course at some point that will change. My Blue Arrow is pointing to a small Up Candle from Friday and in combination with the Candle from Thursday, this could be a Bullish Harami. We will know more if that Support from Thursday at $61.35 holds – if not, then we could head down to Support around $57.5 down to $54.5, which I have pointed at with my Green Arrow. Below that I have scrawled a Blue Ellipse which shows Support in a Zone around $50. To the upside, firstly $70 needs to be regained and the High from this recent run is at $71.4 and clearly a Breakout above that would be a very good sign for Bulls. 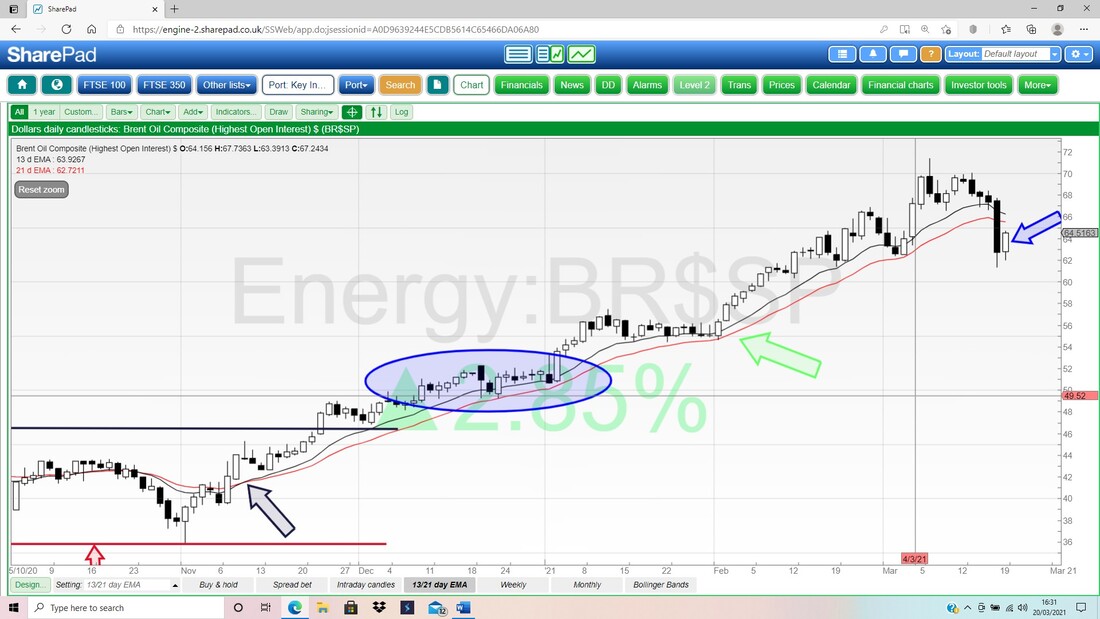
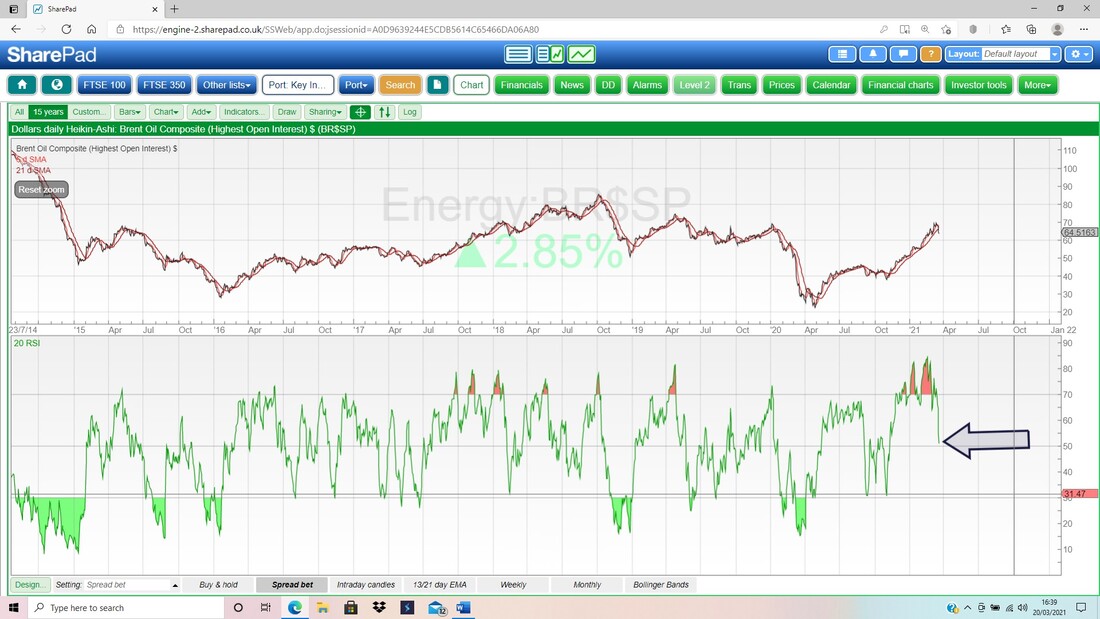
In the bottom window below we have the RSI for the Daily on Brent Oil Comp and from a situation of being extremely Overbought, it has dropped a lot and is now down at RSI 51 where my Black Arrow is and therefore is Neutral. Note how the Overbought levels were predicting this Correction.
Finally for Brent Oil Comp, here are the Daily Candles with the Bollinger Bands. Note how the Price action has been down at the Bottom Band but what I want to highlight here is the Red Midpoint Line which my Red Arrow is pointing at, at about $67.3. Quite often any bounce will end at this Midpoint.
FTSE100
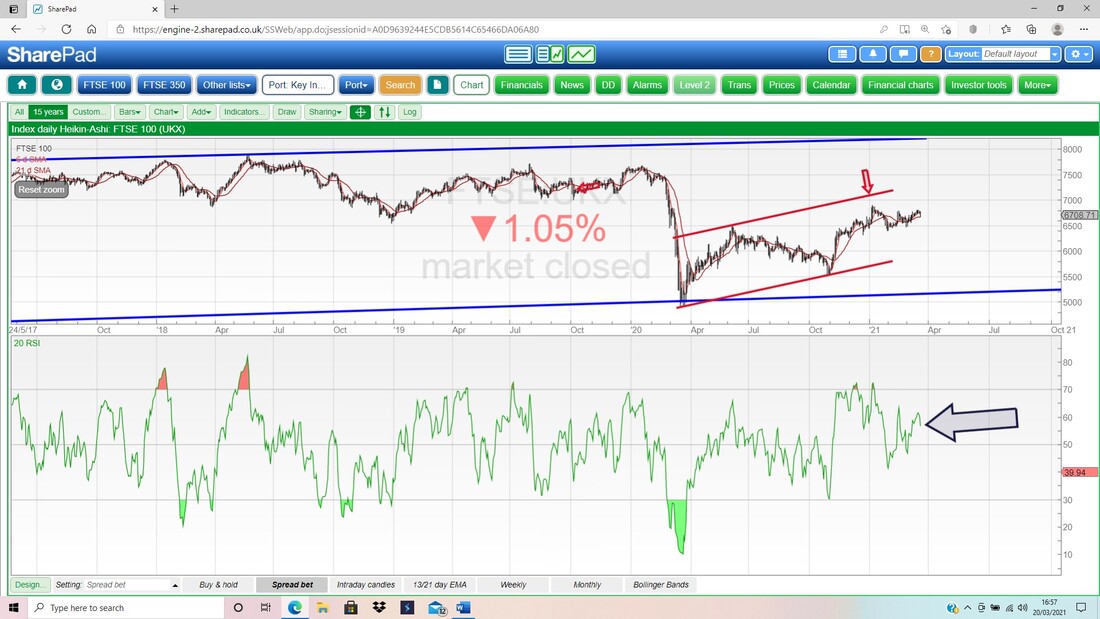
This isn’t valid yet because March is not yet complete, but I just wanted to look at the Monthly Candles again and to see how they were shaping up. The key here is where my Red Arrow is pointing to the High on the January Candle which is at 6903 – the FTSE100 needs to crack this level. My Blue Arrow is marking how the March Candle is looking so far, but it is not yet valid. As it stands, there are some positive aspects, but we need to see how it Closes the month. If it goes nasty, then that would confirm the Bearish looking January and February Candles. 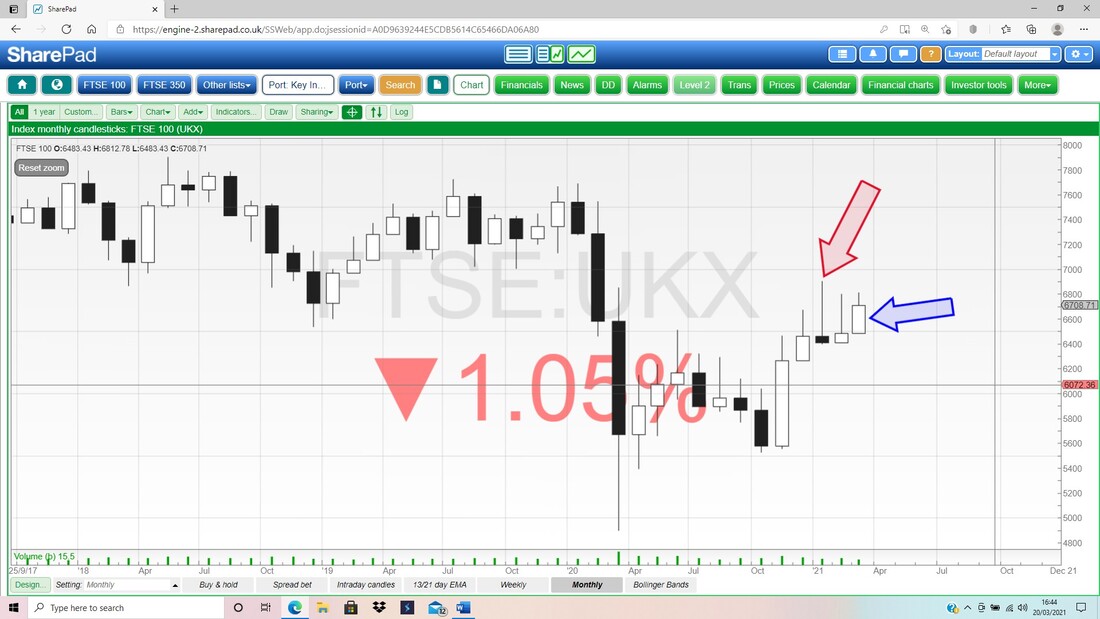
Next the Weekly for the FTSE100. My Blue Arrow is pointing to a small Doji Candle from last week and really this is just showing indecision and chopping about. You could argue that for about 2 months, the FTSE100 has not really gone anywhere and has been quite sideways.
To the upside, the High last week was at 6812 and obviously this is nearby Resistance, but the Resistance that we must crack is where my Green Arrow is at 6903. To the downside, there is Support at about 6400 and then 6315. Below that my Black Ellipse is marking a wide Zone of Support. 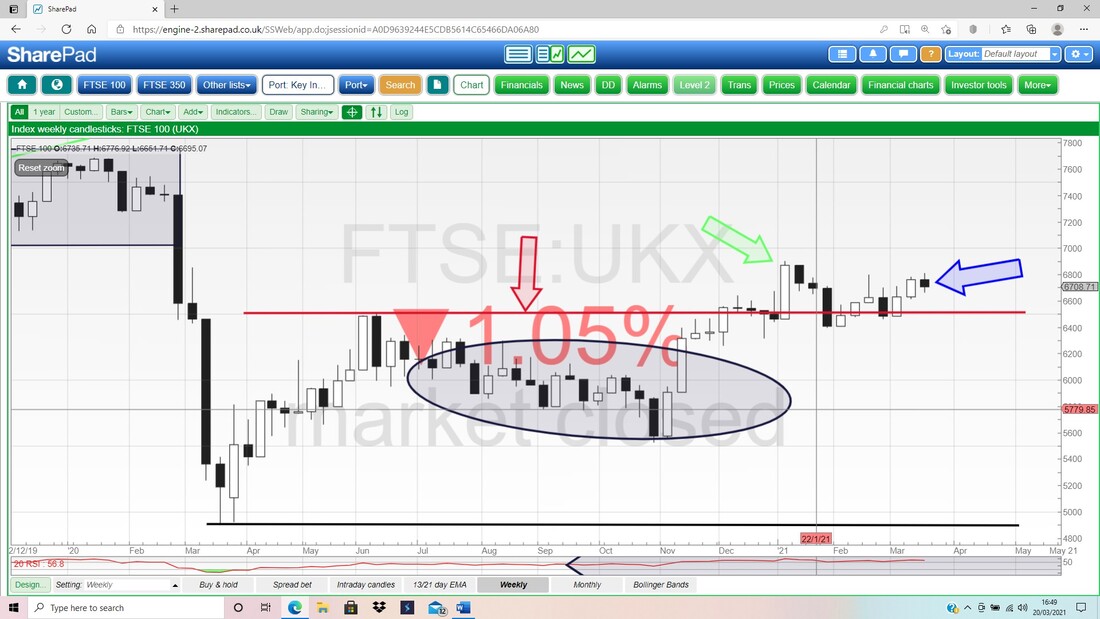
I had some Shorts running but was not very happy with them almost immediately after I put them on !! (see my ‘Trades’ page for the gory details). My main reason was because I hate trading in the opposite direction to what the 13 and 21 Day EMA Lines are telling me. In this case, we had a Bear Cross where my Red Arrow is and then a Bull Cross where my Blue Arrow is and this is actually still ‘in force’ ever since because where my Green Arrow is, we got near to a Bear Cross but it didn’t actually trigger.
The 13/21 Day EMAs give excellent Signals but it falls down when a Market is choppy and sideways, and that is pretty much what the FTSE100 has been doing for quite some time. Later when we get to the Bollinger Bands we will see more evidence of this. 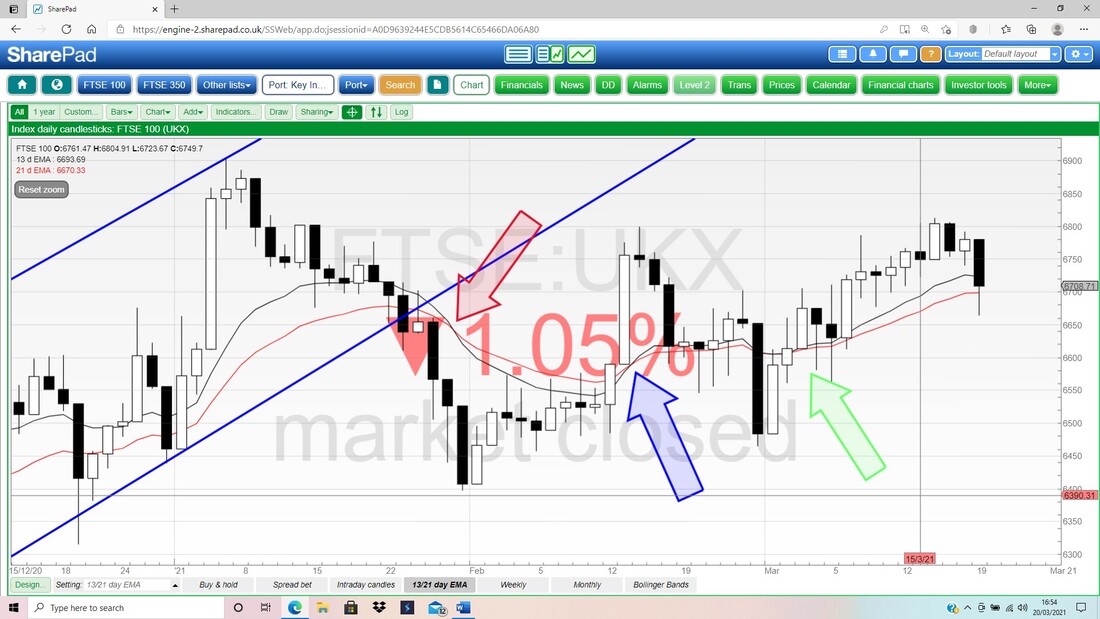
In the bottom window below we have the RSI for the FTSE100 Daily. My Black Arrow is pointing to a Reading of RSI 57 which is not far off the Neutral RSI 50 level, although it does look like it is turning down.
And last up tonight we have the FTSE100 Daily Candles with the Bollinger Bands. What stands out to me here is that the Bands are quite tight and have been narrowing – this usually resolves in an EXPLOSIVE move and this could be Up or Down. Maybe things are going to get a lot more interesting soon, but goodness knows whether that will be Good or Bad !!
It’s really all about the Support and Resistance that I talked about earlier. OK, that’s it for this one. Good luck in the coming week and I hope things play out to the hand you have, and as ever, it is probably wise to be cautious and careful in any Trading Decisions you make. Cheers, WD. 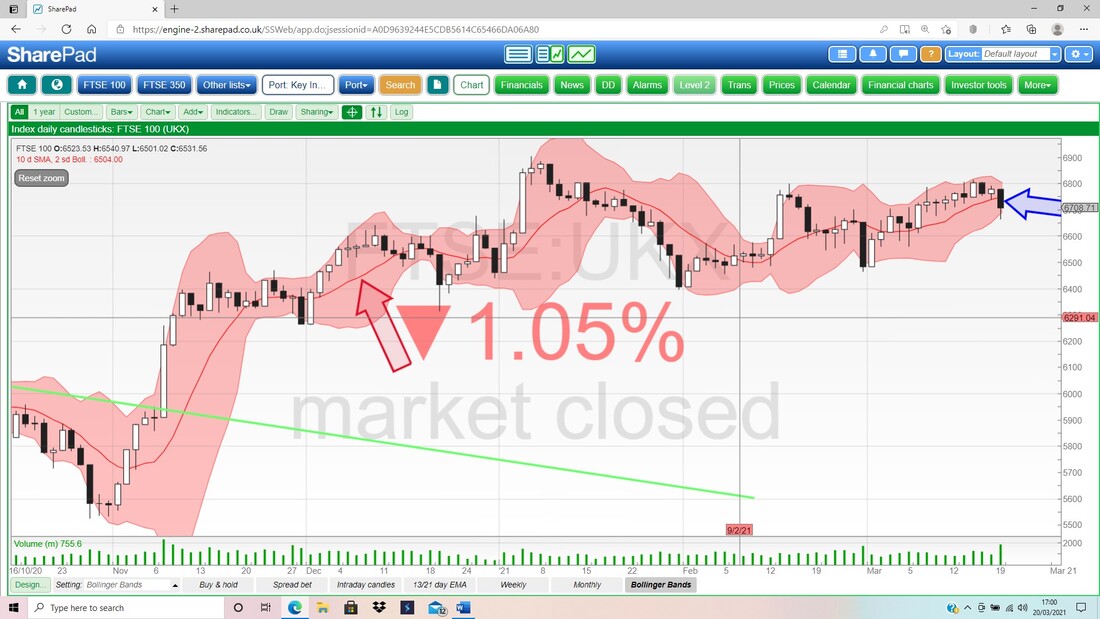
7 Comments
Geoffers45
3/22/2021 03:06:52 am
Thanks Wheelie for all your efforts under difficult circumstances.
WheelieDealer
3/23/2021 01:30:49 pm
Hi Geoff (I am making a big assumption here !!), thank you so much for taking the time to comment and help my motivational challenges !! I am particularly pleased about what you said on how the stuff I write isn't all that 'dry' like so much Financial writing - I try to just "write like I speak" and that's seems to help. 7/27/2022 02:47:15 am
https://www.kriptoseyir.com/category/bitcoin-nasil-alinir/ 12/19/2022 09:03:30 am
İnstagram takipçi satın almak istiyorsan tıkla. 1/4/2023 11:38:14 am
100 tl deneme bonusu veren siteleri öğrenmek istiyorsan tıkla. Leave a Reply. |

Stocks & Markets WheelieBlogsThese tend to be more Markets and Stocks related and timely - the Blog Page on the Main WheelieDealer Website has the 'Educational' stuff (well that's the theory anyway !!). Archives
October 2021
Categories
All
|
