

|
stocks & Markets blog |
|
In case you don’t read my Tweets (you don’t need a Twitter Account – there are Twitter Feeds embedded in several places on my Websites – have a poke around), I didn’t put out a Charts Blog last weekend because I had some health niggles. Hopefully those are better now and the flow of Blogs shouldn’t get interrupted again.
I am typing this bit on Saturday Evening, the 28th Nov, and we are really just 1 month to go in what has been a year that has thrown our emotions all over the place and our Portfolios as well !! I am sure everyone will be very pleased to see the Calendar turn over to 2021 and whatever happens, it will be a big ask for it to be worse than 2020.
So we will soon have completed Monthly Candlesticks for November and barring an historic collapse on Monday (I wouldn’t rule it out, knowing what 2020 has been like so far !!), we should get some extremely Bullish Candles on pretty much all Indexes. I will look at these in the Charts bit later.
I guess on this coming Friday we will have the US Non-Farm Payrolls Numbers which usually come out around 1.30pm. With everything else that has been happening, these Numbers seem a bit less able to move the Markets really with everything Economically being so extreme. That might be different now we are further through the Crisis, but it can seriously move the Markets one way or another on Friday afternoon. It’s a bit of fun for Day Traders really though. My mate Nasir emailed me this piece which is from the Fund Manager Nick Train – I am sure you have picked up by now that I think letting Winners run and not chopping their legs off is probably one of the most significant behaviours you can adopt to improve Portfolio Returns, as a Long-Term Investor. Thanks mate !! ‘Nick Train: “Run Your Winners Because They Can Go Up More Than Your Wildest Dreams” In this recent interview with Edison TV, Nick Train, co-founder of Lindsell Train discussed his successful buy and hold strategy that was influenced by Buffett, Munger, and Lynch, and focuses on ‘running your winners’. Here’s an excerpt from the interview: “I tried to do that 30 years ago, and demonstrated to my own satisfaction that it [timing] wasn’t my skill. I know how trite, and this is our fault, not your fault, how trite what you’ve just described as our investment approach sounds, identify great businesses and then hold them for very long periods of time. It’s so simplistic. I’m going to add to it with another really simplistic, but I think a powerful piece of investment advice, which we do our best to adhere to, and that is the piece of investment advice that says run your winners. It’s obvious. History confirms it, that this shared crisis of outstanding businesses, great businesses do show a tendency to go up a lot over multiple decades. Of course, there are counter exceptions, and of course there is a subjectivity in identifying what constitutes a great business, but when you see the potential rewards for, I don’t know, owning Unilever for 50 years. They’re extraordinary. Unilever’s share price, over 50 years, has gone up more than 100 fold. The company’s grown its dividend every year for over half a century. The returns that you can earn from identifying a business with those sorts of sustainable longevity are very high indeed. You know what? Running your winners sounds so simple, but all of us, maybe even you yourselves, will recognize that it’s more of a challenge, both intellectually and maybe even more importantly, emotionally, it’s more of a challenge than you might think. There’s always the temptation to take some profit. Unilever, believe me, look at the charts, unbelievable returns over multiple decades, but I can point multiple five year periods when Unilever’s share price did nothing, and what are you supposed to do when the shares of a great business do nothing for five years? The temptation is to sell. This is boring. I’m going to move onto the next idea. Maybe you get lucky, maybe your new idea is better than Unilever, but can you be sure? All I know, and even this isn’t an internal observation, all I know is that over the 21st Century to date, running winners in strategically advantaged companies has been a hell of a lot more rewarding than averaging down into losers. Now that can change, of course it can change, but in the end, all anyone at Lindsell Train can do is say, “Here’s our investment approach. We’ve stuck to it. We propose to continue to stick to it. It’s up to you to decide whether it’s relevant for you, or you think it might be effective over the next period.” That’s what I’d say.” On the topic of Peter Lynch, Train adds: “I’m not saying that’s not valid, but the big lesson for me from Peter Lynch was run your winners because they can go up more than your wildest dreams.” I find it particularly interesting that Nick Train mentions “Luck” in there somewhere. You will be hearing more about this from me soon. I also draw your attention to the paragraph about the emotional challenge of running Winners for years and years and the constant temptation to take profits – it really isn’t easy. Having now read this piece several times, more and more I think it is something I could have written almost exactly the same. I particularly like the bit about when a Share does nothing for years – people think the clever thing to do is to switch to something else, but it is very possible that you then buy something which goes down, whilst the Great Stock you sold, that has done nothing for years, suddenly jumps on a Takeover Bid. I often have Stocks which don’t do very much for a long time, but it doesn’t bother me much because other Stocks in my Portfolio will be picking up the slack, and my tedious one will at some stage have its time in the Sunshine. SharePad Pro ‘Black Friday’ Offer During the latest Podcast, TPI 36, I mentioned an Offer that SharePad are doing just for a couple of weeks as a ‘Black Friday’ thing. If you haven’t heard the Podcast yet, then nip over to the ‘Twin Petes Investing Podcast’ page on WD2 and you can find it there. The Offer is for SharePad Pro which includes Level 2 and Live Prices as well as all the usual stuff the other versions of SharePad contain. Normally it is £69 a month but the Offer is ‘3 months for the price of 1’ and you can save £138. It runs until the 14th December so you have plenty of time and if you sign up then SharePad pays me a little bit as well – and you know the Wheelie Beer Fund always needs regular topping up !! To take up the Offer, go to the Link below and type in the ‘Promo Code’ ‘twinpetesbf’ and that should sort it out. Feel free to contact me if you have any queries. https://www.sharescope.co.uk/add_to_basket.do?pid=143 By the way, if you fancy ‘normal’ SharePad then there are loads of Images around my websites that you can click on to get 1 month of Free Data. Last Week Well, I am just so pleased. My rather sweet run of weekly gains has managed to continue and last week my Portfolio gained 2.6% and now the Year To Date (YTD) Return since January 1st 2020 is a gain of 8.7%. This is really heart warming but of course we have December still to go and anything can happen. My ‘Central Scenario’ is that we will get more gains in December and I am playing to that likely outcome. However, of course I will be on my guard and ready to slam on Index Shorts to Hedge if I see the need to. I suspect it is more likely I will add a Spreadbet Long on the FTSE100 soon as December is usually a very good month (the best in fact) and the ‘Santa Rally’, which normally starts around the 14th December ish, can be very lucrative and I want to take advantage if the Charts support this stance. You may have noticed that I got a bit excited last week and actually bought something. If you look at the ‘Trades’ page on WD1 you can see all my Trades and lately I have bought more Gateley GTLY and Bango BGO, which both strike me as sweet Long-term Holds. GTLY even put out a decent Trading Update on Friday which allayed any slight concerns I had. The Rules are that I must stick to the 40 Stocks of the ‘WD40’ but I think I can bend them a bit to buy something new that I have been stalking for years and I might do that in the coming week in a small way. I think this is justifiable because I have AA. and MCS going through the motions of Takeovers (AA looks settled so I might just dump it next week and take the big hit like a man……) and also GOCO and TCM are looking like they are fairly certain to go through. I will give them a bit of time as another Bid might emerge, but it means that really I am most definitely down to 38 Stocks and it could be as low as 36 if all these Deals go through. I might even have a Takeover Bid I have forgotten, there is so much going on. So I can justify buying a Starter Position in a new Stock then. I don’t want to go mad with buying because my Exposure to the Long side is pretty high, but an advantage of my Hedging Strategy is that as long as I keep tight control of the Net Exposure Long or Short, then I can quickly adapt to whatever the prevailing Market situation is – and I don’t need to smash up my Portfolio to adjust. On the Returns side of things, if I can get to a 10% Gain for 2020 I will be really pleased. Back in March/April it looked like a pretty forlorn hope to come out with a Profit on 2020 but amazingly we have got to a situation where it looks very possible. If I can get up to 12% I will be drinking a lot of Beer and any more means a Curry on top !!! I am not sure where my Income Portfolio will end up. From when I last looked it was down about 6% on the year and I think if it gets back to breakeven that will be amazing. It has certainly been an interesting year !! Blog Slate I’ve been working on an Educational Blog which is likely to come out in 2 bits – and if you are ‘lucky’ then Part 1 will probably appear this coming week. It is mostly written and I just need to tweak it and refine, but we should also be recording TPI 37 sometime this week and I will need to update the ‘Monthly Performance’ page to reflect the final outcome for November – that might slip to the following week. I haven’t even started Part 2 of those Educational Blogs but I have at least done a pretty detailed plan so it shouldn’t be too onerous to write because the ‘hard’ work has been done. Oh, if I do buy a new Stock, it would be a good excuse to work on a ‘Stock Buy Rationale’ which always helps me decide if I want to buy more after I have bought a Starter Position. In an ideal world I would do the Buy Rationale first but that is far too obvious and the particular Stock we are alluding to is something I know very well anyway. Anyway, the last time I did that I ended up buying CAKE and losing a fortune on it !!! I am nothing if not deeply superstitious…….I must have really upset the Market Gods back then. I have also started thinking about ‘Scores on the Doors 2020’ and yesterday (I am now adding this paragraph on Sunday Night, just before I publish !!) I went through my Bank Statements to work out exactly what I spent for each Month on my ‘Living Expenses’. It was obvious that with the Lockdowns and stuff I would not have spent much, but at a rough guess it looks like I will spend about £16,000 which is down £2000 on 2019. I will give the precise numbers in the Scores on the Doors blog in early January. Oh, while I remember, if you always get in the habit of looking at the ‘Changes List’ on the WD1 Homepage, then that tells you exactly what has changed on the websites on particular dates. Digging Deep If you go to the ‘Blog Index List’ page which sits on WD2, then you should see the full list of every Blog I have ever written, and the relevant ones all include Links so you can track them down easy peasy. From that selection I bring you the following Blog which you might find a useful read (you might not, but hey, that’s life). I was talking on Twitter the other day about updating my Spreadsheets after doing a couple of Buy Trades – this blog should include the frameworks of the Spreadsheets I use: https://wheeliedealer.weebly.com/educational-blogs/spreadsheets-for-recording-your-trades I was also thinking about how important the concept of Valuation is and how it is clear to me that few Private Investors really understand it. Have a look at these blogs – there are Links at the bottom to the earlier parts: https://wheeliedealer.weebly.com/educational-blogs/valuation-valuation-valuation-bursting-for-a-pe-part-4-of-4 Enough already, let’s see them Monthly Candlesticks !! Monthly Candles As is always the case, the Charts I show are taken from the superb SharePad software I use and if you click on the images then they should get a bit bigger on your screen. I will focus in this fist little section on the Monthlies – the Chart below shows the Candles for Brent Oil Composite and my Blue Arrow is pointing to a big White Up Candle for November (barring a disaster on Monday) which looks extremely Bullish. 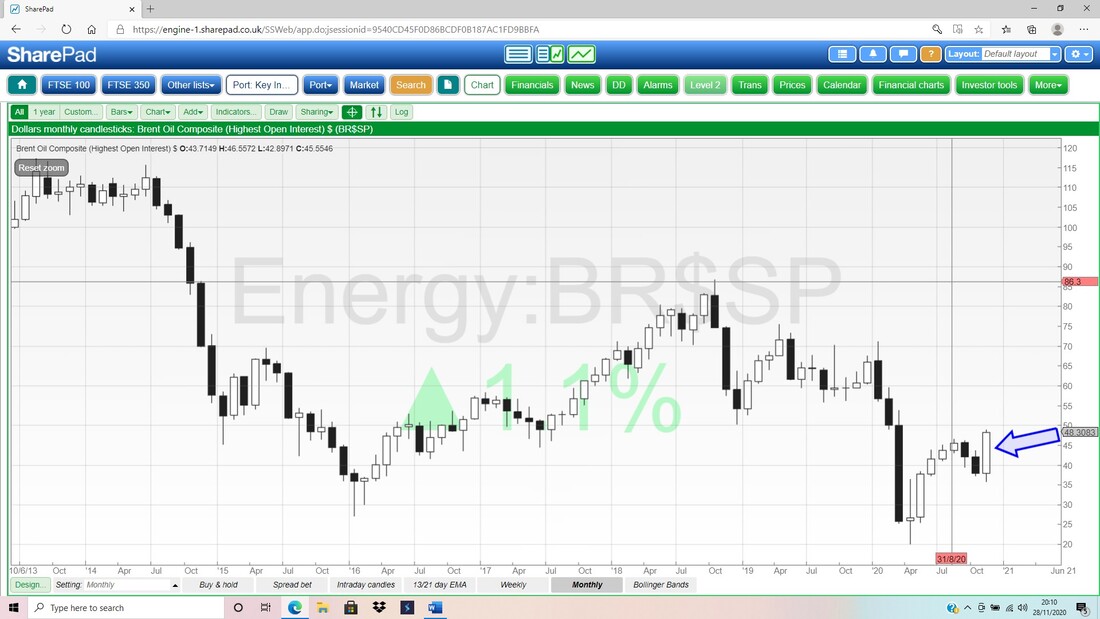
Next up the Monthlies for Gold Composite – my Blue Arrow is pointing to a big Black Down Candle for November (barring a bounce on Monday !!) and clearly this is not good.
Note also how the Monthly Candles have developed – go back to August and there is a very clear ‘Long Tails Doji’ after the strong move up, and that was warning that a Turn Down was possible. The Black Down Candle for September confirmed the warning from the Long Tails Doji, and it’s been downhill ever since (and likely more to come). 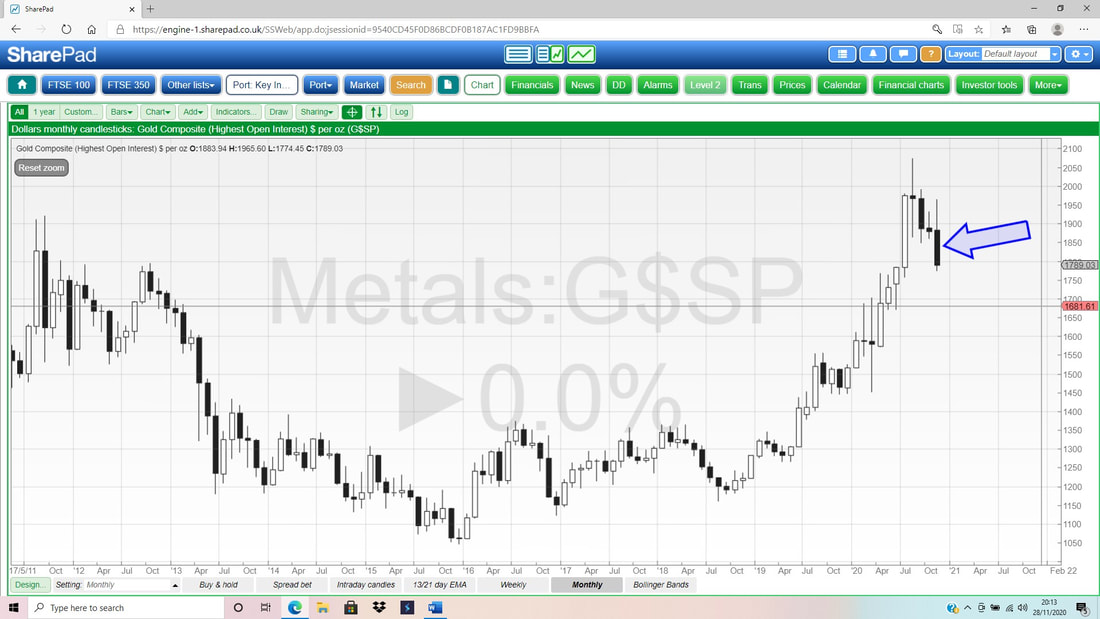
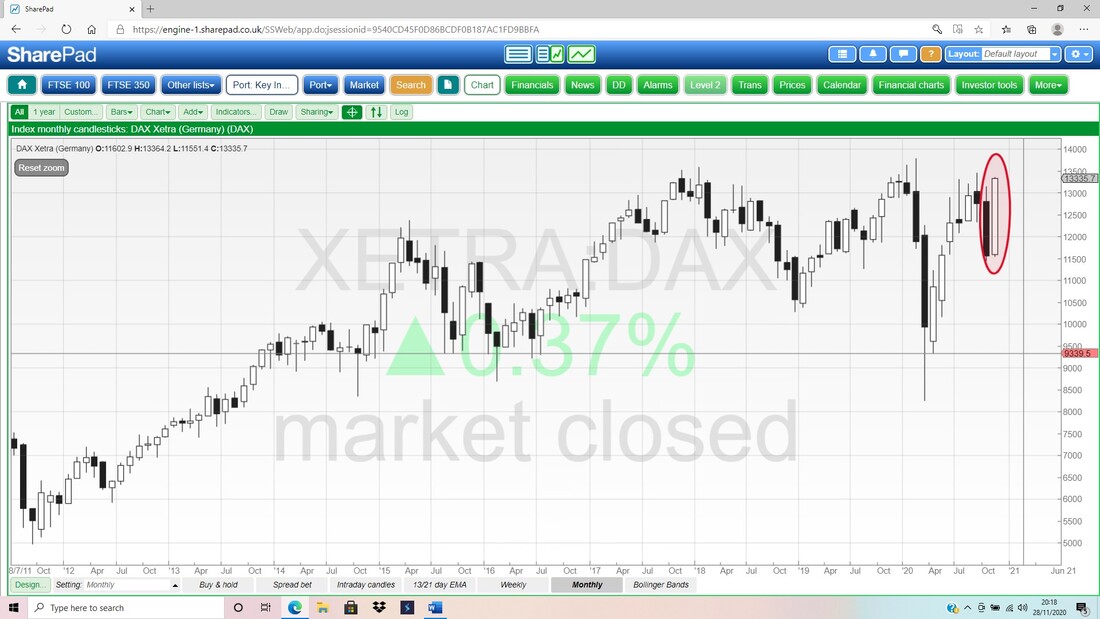
Next we have the German DAX – my Red Ellipse is trying to capture a Big White Up Candle for November. Note how it negates a very Bearish looking Candle from October – that is a very Bullish development. Failure by Bears to push home a clear advantage when the Chart set-up is in their favour, is a very Bullish sign.
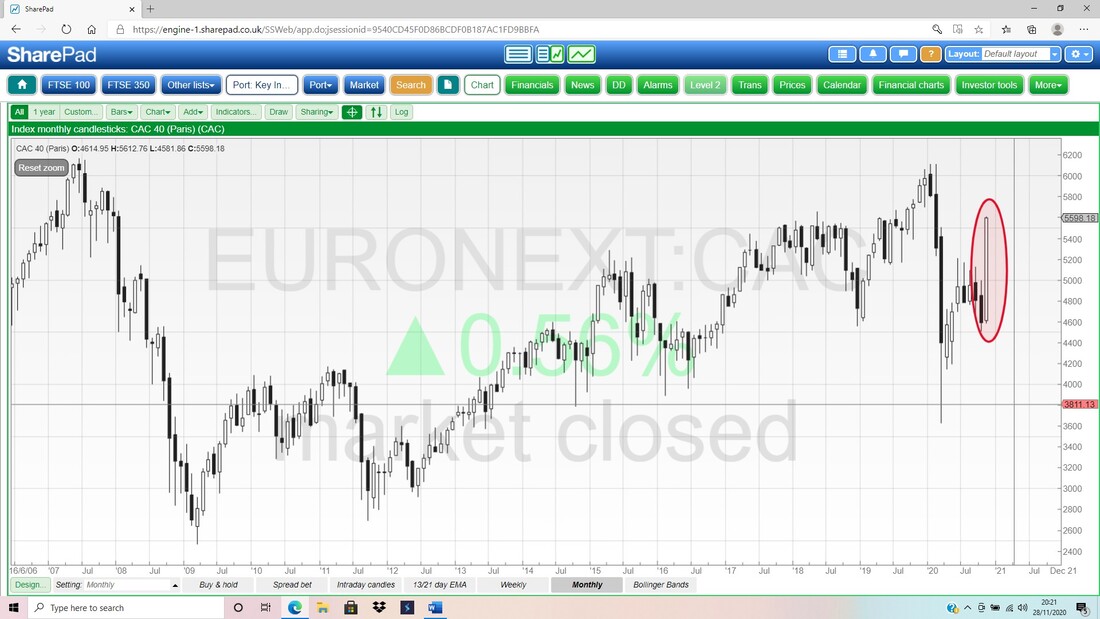
Below is the French CAC40 – same Bullish story.
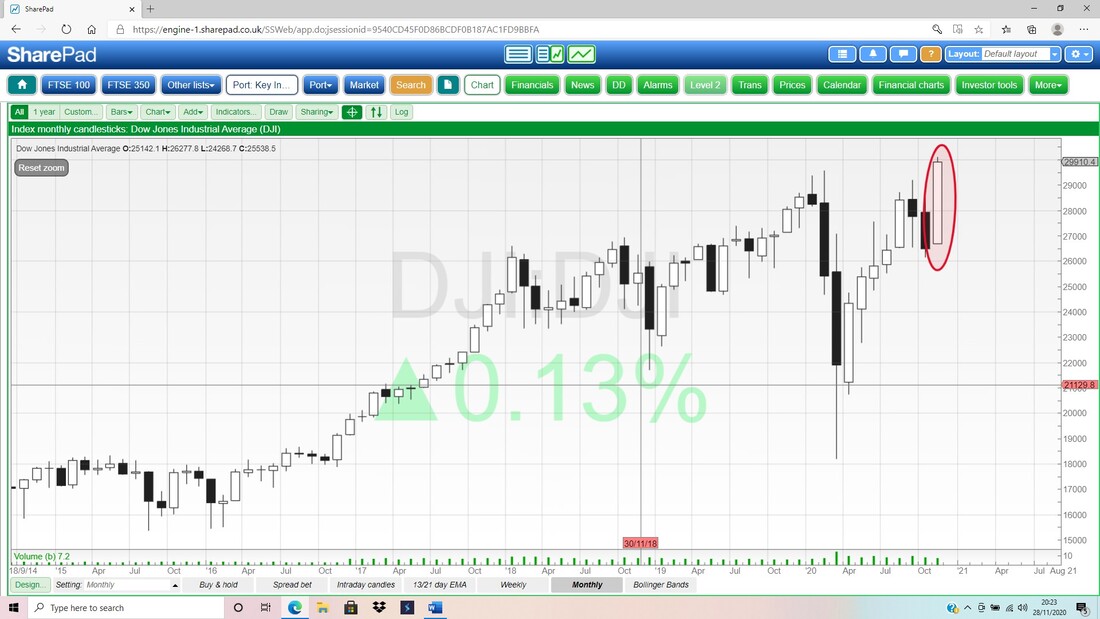
The Dow Jones Industrials Index (the DOW) has a Bullish Candle for November as well.
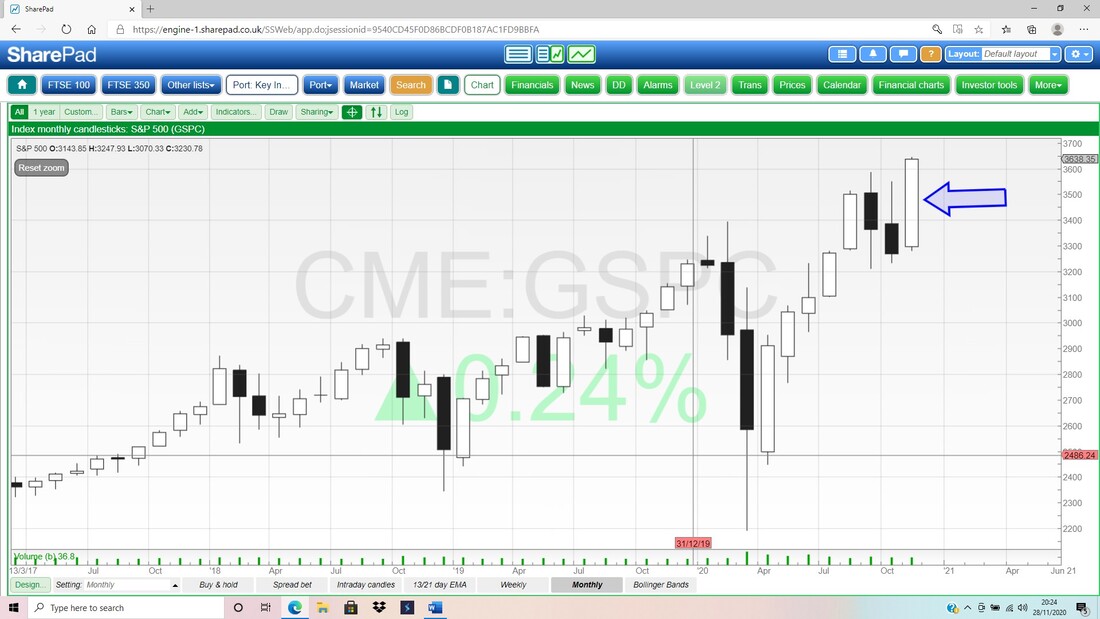
And the S&P500:
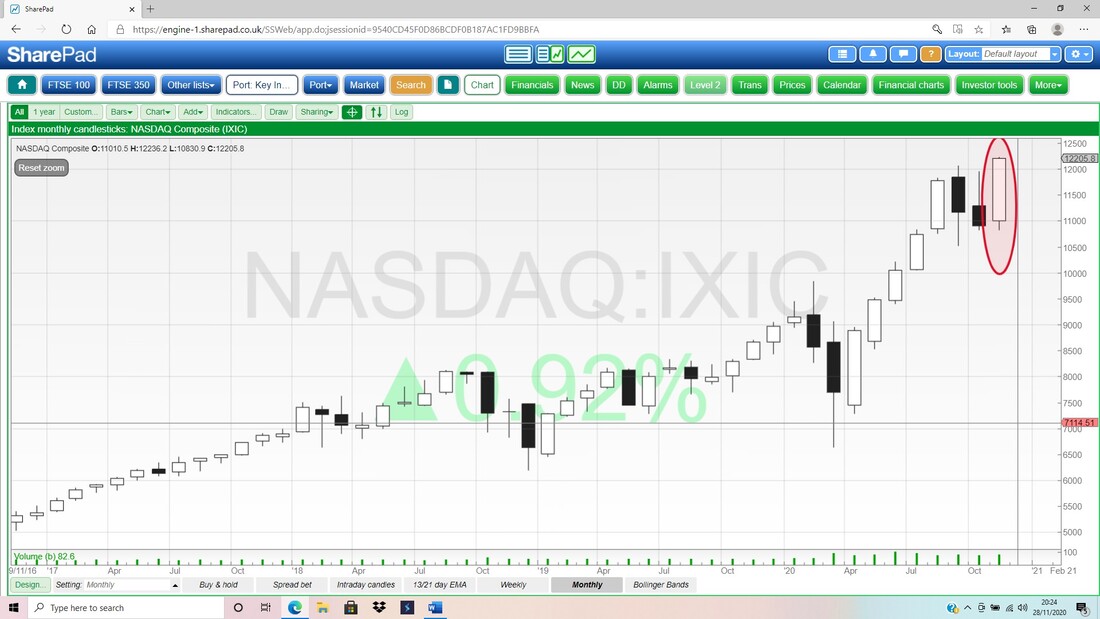
And the Nasdaq Composite US Tech Index:
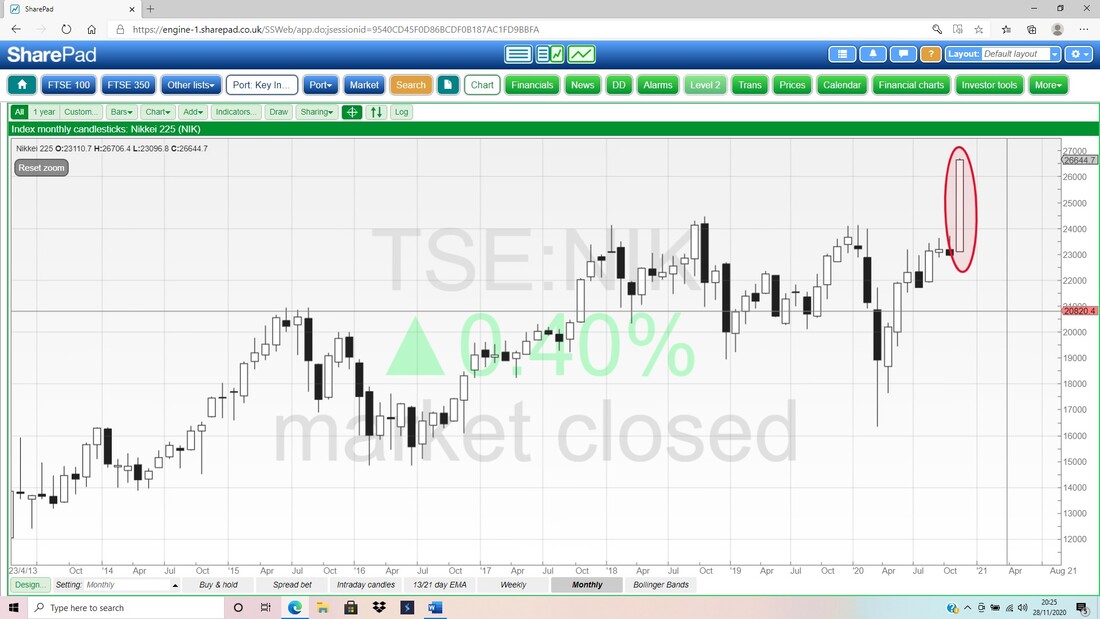
And the Japanese NIKKEI 225:
On the FTSE100 below, we have a Big White Up Candle for November where my Red Arrow is; and note my Blue Arrow pointing to the Peak from back in June which is at about 6512 – a Breakout through this would set up probably 6800 quite pronto.

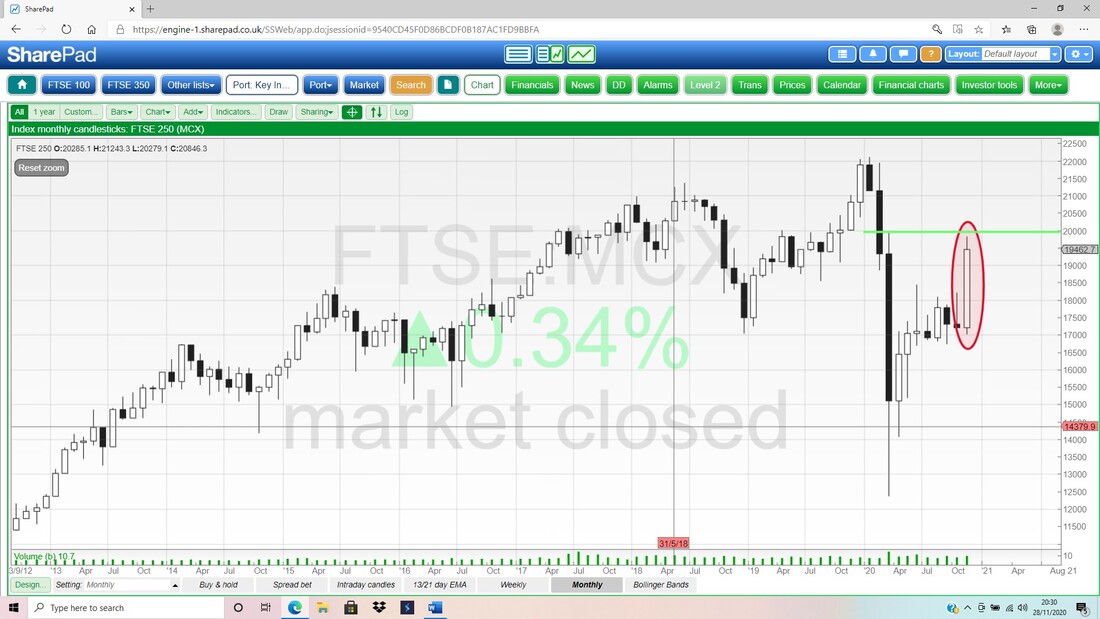
The FTSE250 is also Bullish with a big White Up Candle for November marked by my Red Arrow. Also note my Green Horizontal Line at 20000 – this is significant Resistance and a Breakout over this would be a very Bullish development.
Anyway, I think you get the picture !!!
S&P500 It’s Technical Analysis ‘Best Practice’ to start with larger timeframes and then drill inwards. So, in line with that (although I do resent the idea that I am ‘practicing’ – this is the Real Thing you know !!), here are the Weekly Candles for the S&P500 and bear in mind that it was Closed on Thursday for GivingThanks and it was a short day on Friday. My Black Arrow is pointing to a decent Up Candle from last week and note it got within a smidge of the All Time High (ATH) at 3646 from 3 weeks ago. A Breakout over 3646 would be very Bullish and I suspect we will see that occur in December. 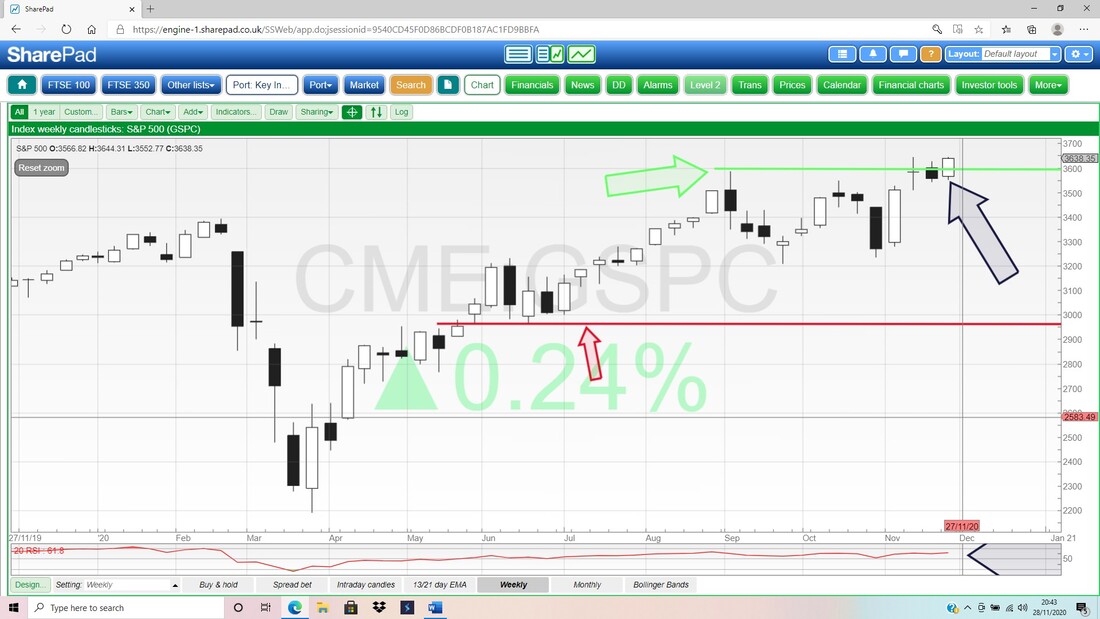
On the next Chart we have the Daily Candles for the S&P500 but my interest here is mainly the Black Wiggly 13 Day EMA Line (Exponential Moving Average – more recent days are weighted heavier in the calculation of the average) and the Red Less Wiggly 21 Day EMA Line. My Green Arrow is pointing to where we had a ‘Bull Cross’ (the 13 Day Crossed over the 21 Day from underneath) and this Bull Cross predicted the move up since.
This is still Bullish until we get a ‘Bear Cross’ which is the opposite type of move. My Blue Ellipse is capturing a Bearish Shooting Star Candle from back on the 9th November which put in the All Time High at 3646. 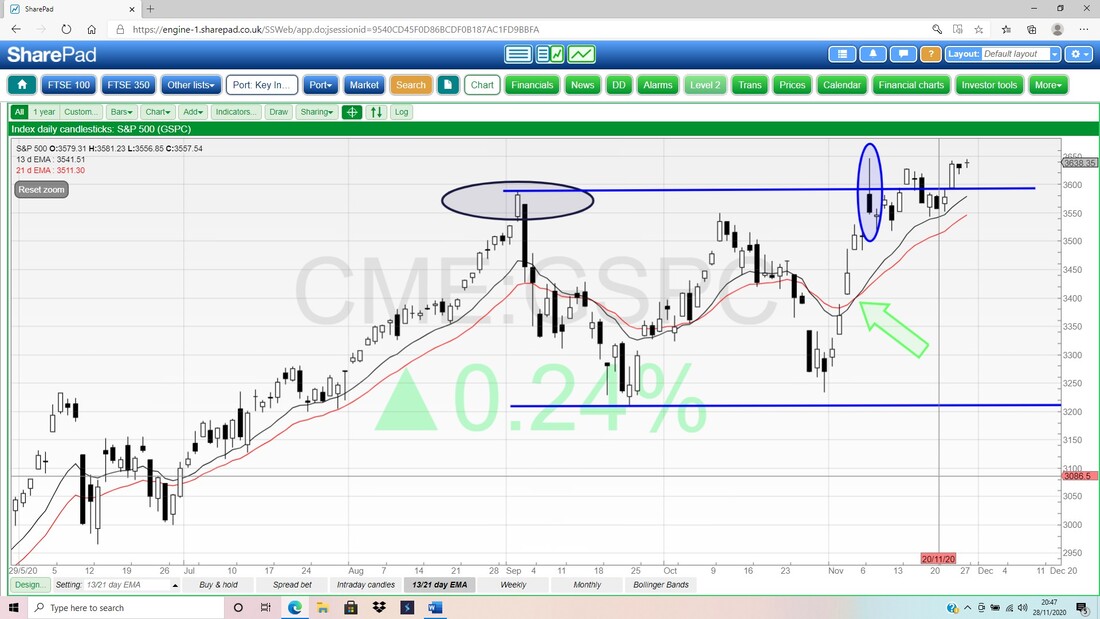
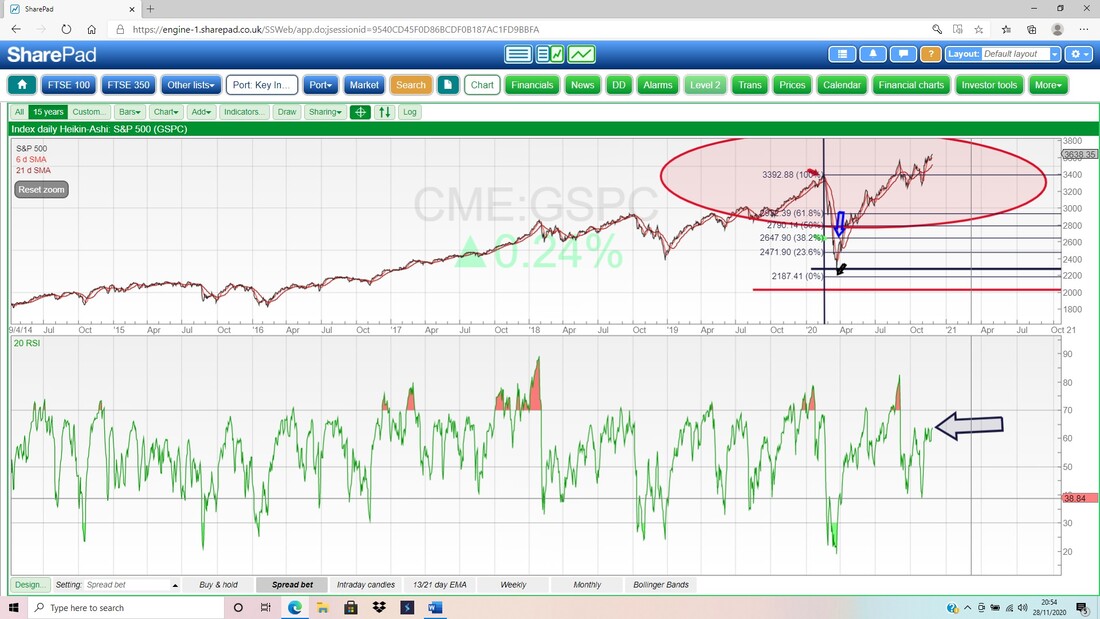
In the bottom window on the Screen below, we have the RSI for the Daily for the S&P500 (Relative Strength Index) and on a reading of RSI 64 where my Black Arrow is, this is moving up but still has room to rise. If you look to the left, it has been up as high as RSI 82 not that long ago, and even RSI 89, but that looks a very rare outlier really.
Finally for the S&P500 we have the Daily Candles with the Pink Zone showing the Upper and Lower Bollinger Bands (these are based on Standard Deviations but it is all a bit complex and you don’t need to know what they are – just use the Signals). My Blue Arrow is pointing to a ‘Doji Star’ sort of Candle from the short day on Friday, and it looks like a Sideways Consolidation move really.
The thing to watch is for a Breakout through the ATH at 3646 or a move back down to Support which is from the Bollinger Midpoint Line where my Red Arrow is at 3600 and down to 3511. 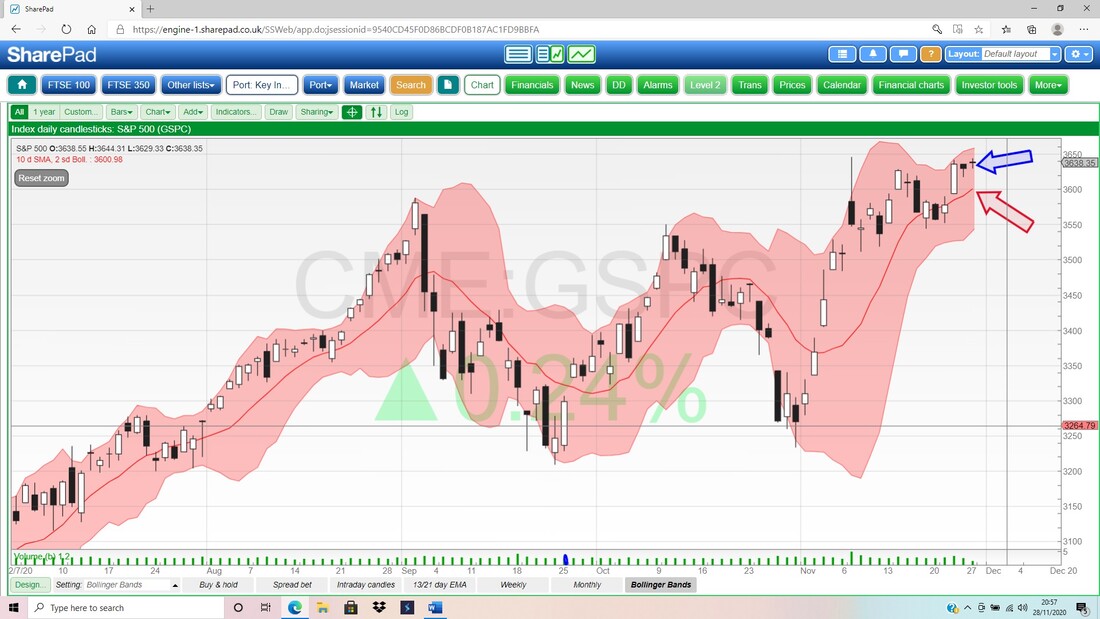
FTSE100
First off the Weekly Candles for the FTSE100. My Blue Arrow is pointing to a possibly Bearish looking Candle from Last Week and note how it is not all that different to the ‘Bearish Shooting Star’ sort of Candle from the Week before. The key again is Support and Resistance – a Breakout through my Red Line (Red Arrow) at 6512 would be extremely Bullish and a great opportunity to go Long on a Spreadbet; and a drop back to Support would be down to perhaps 6000 at worst. I think a drop of any real significant size is unlikely – Bears had their chance recently to take things down, and the Bulls have gored them big time. 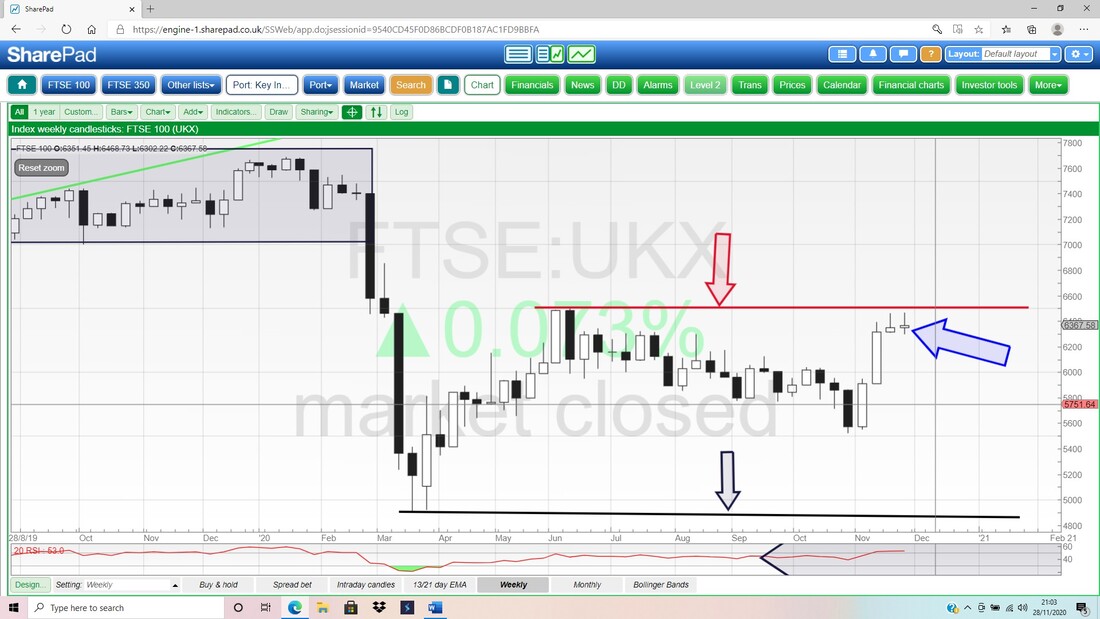
How could I forget the Bull Flag ? !! But I had until I looked at this. The Chart below has the Daily Candles and my Red Ellipse is trying to show the ‘Flag Pole’ bit and my Black Ellipse is trying to capture the Flag Clothy bit. At the moment the Flag is playing out between about 6468 and 6300 and a Breakout Up or Down will tell us a lot. A Breakout above 6468 and then 6512 would be immensely Bullish.
My Black Arrow is pointing to a ‘Bull Cross’ between the Black 13 day EMA Line and the Red 21 Day EMA Line. This is still in force and Bullish. 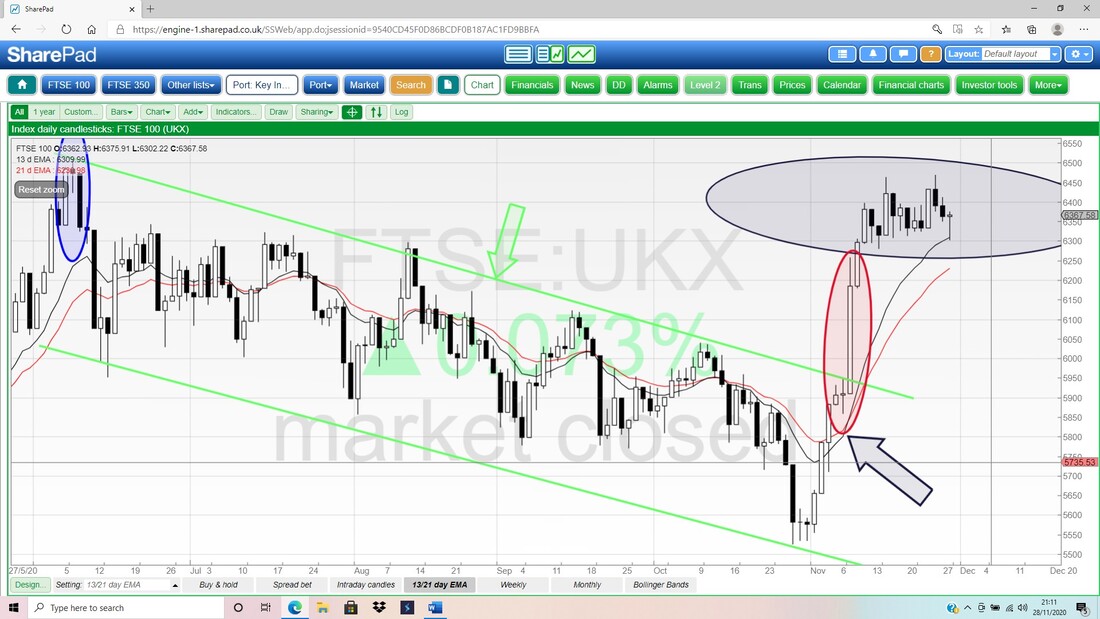
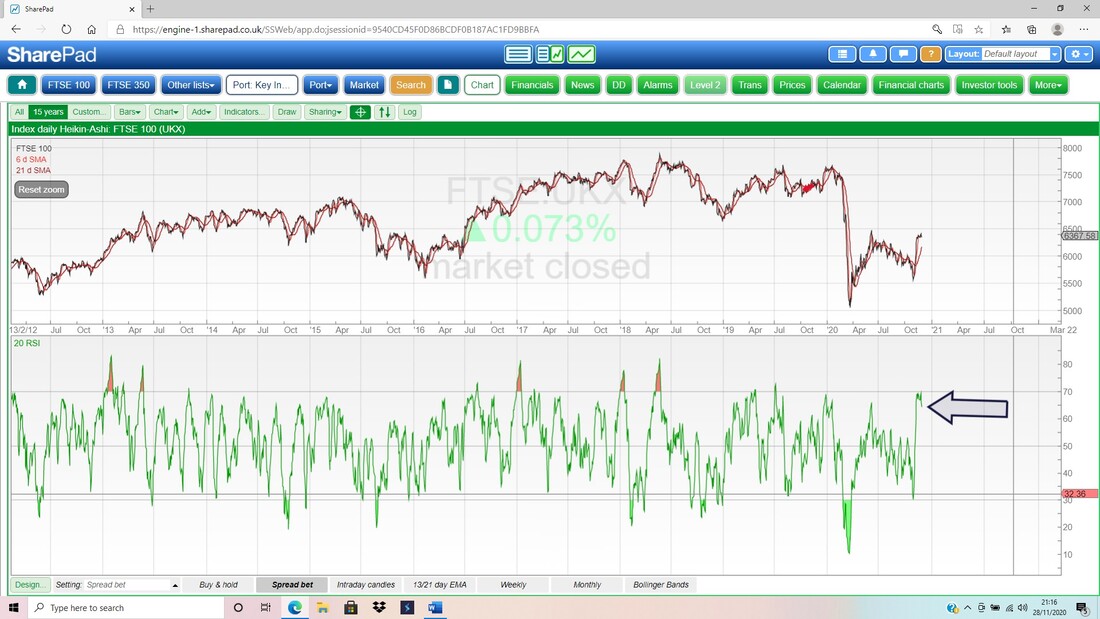
In the bottom window on the Screen below, we have the RSI for the Daily FTSE100 and on a Reading of RSI 64 where my Black Arrow is, it has come down a bit but is still pretty high. The way to lower the RSI is for the Price to drop down or to go sideways for a while. Hopefully it will be the latter and unwind the RSI enough to enable Bulls to grab hold and charge hard.
Finally tonight, here is the Chart of the FTSE100 Daily Candles with the Bollingers. My Green Arrow is pointing to a nice Hammer Candle from Friday although note the context is not great because ideally you would want a sustained fall before for many days for a Hammer to be really reliable. Anyway, it found Support on the Bottom Bollinger Band and Closed up near the Bollinger Midpoint Line (Red Arrow). It is likely the FTSE100 can rise off this in coming days.
Note how the Bands have started to narrow and now are between about 6310 and 6440. If we get a sustained period of tight Bands, this usually resolves with an EXPLOSIVE move but it can be up or down !! OK, that’s it this week. Good luck for the coming travails, and I hope the Market Gods are loving you big time !! Regards, WD. 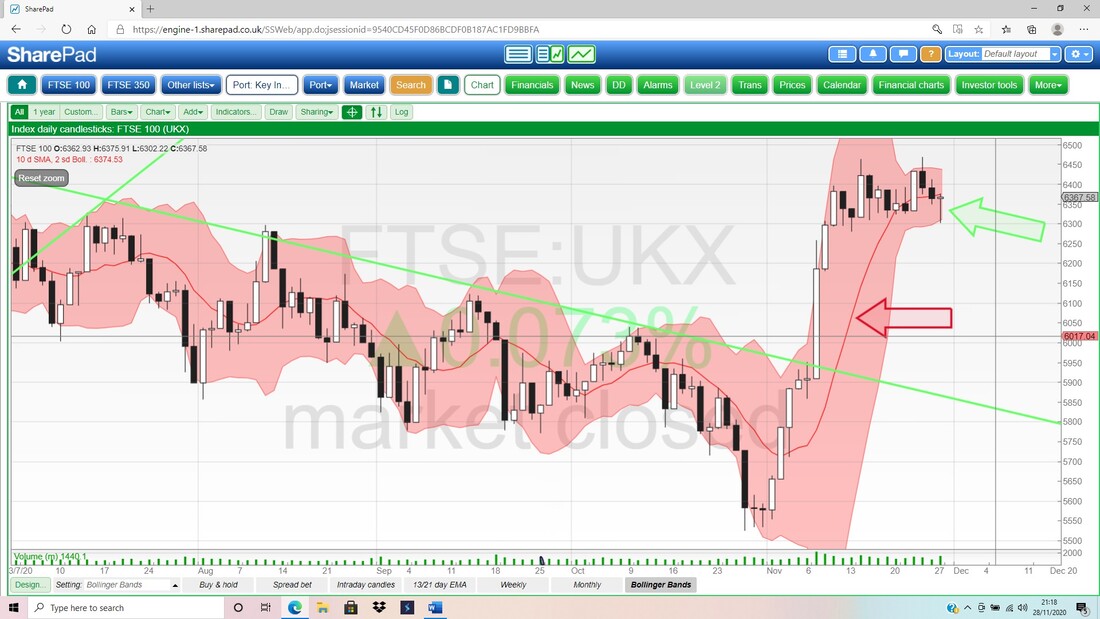
2 Comments
Kevin S
11/29/2020 01:36:15 pm
Hi Pete,
WheelieDealer
12/5/2020 01:39:07 pm
Hi Kevin, Leave a Reply. |

Stocks & Markets WheelieBlogsThese tend to be more Markets and Stocks related and timely - the Blog Page on the Main WheelieDealer Website has the 'Educational' stuff (well that's the theory anyway !!). Archives
October 2021
Categories
All
|
