

|
stocks & Markets blog |
|
I don’t intend this to be a lengthy Blog as I am starting it quite late on Saturday night and I am personally getting quite bored (although grotesquely fascinated) by the unfolding Virus Crisis and I can see a situation where the Markets are best avoided for coming months because they are likely to be pretty unpleasant. Of course if you are a Short Term Trader there will probably be lots of choppiness to take advantage of but that is certainly not my game and the unfolding misery should give me lots of excuses to spend an extended amount of time in my garden and I have plenty of books to read etc.
I suspect there is still a huge proportion of the UK (and almost certainly the US) Population who have not grasped the enormity of what is happening and even from a few discussions with pretty clued-up mates they are not really totally on the ball with the steadily worsening situation. I spent a while digging the garden today (hey, let’s face it, I might be relying on the harvest to stay alive this year !!), and at around 7pm I turned on the TV News just to see what the current ‘score’ was and the doubling of UK Deaths (IN ONE DAY !!!) followed by Spain, France, Greece not far behind Italy in total shutdowns, it didn’t take me long to realise that it’s been another appalling few hours.
These shutdowns are killing European Economies and I heard the EU President, Ursula German Lady, say that she thought Eurozone GDP ‘Growth’ for 2020 would be minus 1% and I just thought she is clueless. I will be amazed if the outcome is more like minus 5% or more and of course the longer it drags on for, the bigger the destruction of Economies. There can be little doubt that without considerable government action, there will be numerous bankruptcies and huge numbers of redundancies and short-time working – it simply means more grief for Stockmarkets. I dread to think what state the Government Finances of European Economies are going to be like after this and there must be huge risk of Eurozone Banks getting in serious trouble. The UK will have similar problems although maybe the Banks are a bit stronger but like any of these ‘Stress Tests’ they are one thing done in Theory and entirely another when they face the reality of actual Practice.
And UK can’t be far behind. My guesstimate is one or two weeks and we will be in total shutdown as well. It is truly historic and after 55 years on the Planet I have never known anything like this and if someone had told me the details of how this is playing out a year ago, I really would not have believed them. I have lived through stuff like the Credit Crunch and the 1974 Oil Crisis and plenty of other fiascos like the rampant socialism and trade union power of the 1960s, yet none of it comes even remotely close to this dire predicament. US will be in the same rickety boat soon and the Virus is getting stuck into Africa which will be an ideal breeding ground for the Virus to mutate and evolve and get potentially harder to deal with. The last I heard was that Africa now has 10 Countries with the infection and with Healthcare Systems pretty much non-existent, it will go through like wildfire. You only need to look at Iran to get a small taste of the impact that it will have. God I’m depressed now. Sorry about that Readers !!! Last Week I guess that was one of the most mental weeks I have ever known on the Markets. So much has happened that I might be getting my days/times mixed up but I think it all kicked off Monday morning right from the Open and I got into a right panic and placed another Short on the FTSE100 and soon thought I had been very rash and stupid. As it turns out that was a good trade and the Hedge did me well although things then caught me out at the end of the Week when I went Short on the S&P500 just before Trump spoke and the swine of a Market shot up 10% by the end of the day. My assumption is that this is a classic ‘Short Squeeze’ and with all the terrible news since then (and likely more tomorrow), I expect the Markets to come under plenty more pressure to the downside. This last knockin’s jump in the Markets hurt my Short Hedges which are on the S&P500 and the FTSE100 (see my ‘Trades’ page for all the gory details) and this didn’t help my weekly result but I am quite ok with it as I think things will go my way in coming sessions. My Portfolio lost 10.3% on the week and I am now down 16.4% for the year so far. Truly painful but I am now about 50% Hedged and I feel set to take on whatever happens. I cannot see there being much if any upside for a long time and these Markets could be difficult for all the Summer and perhaps they could perk up as we get into Autumn/Winter. Crazy times. Oh, I had a bit of ‘luck’ with Moss Brothers MOSB getting a Takeover Bid but unfortunately it will take me out with a chunky loss. It is something like 60% down or maybe a bit worse but there is nothing I can do about it and it solves a problem for me really. Frustrating as clearly there is potential in the business but it is what it is and I might sell in the Market quite soon because there is a risk the Takeover collapses with all the stuff going on. Retail is clearly not a place where exposure is going to be easy unless it is food or other essential items. Investor Events With major Events of all sorts (sports, conferences, exhibitions etc.) getting cancelled it was no shock to see that the Master Investor Show has been postponed to December I think and I suspect both Mello and UK Investor Show are at risk. The WheelieBash is still lined up for 5th September and hopefully we might be through the worst by then – maybe it will turn out to be the Premier Event of the Private Investor’s Calendar !! (by default of nothing else being on). Blog Slate I mentioned in a few places that I intend to do a Blog this coming week which looks at various Charting Events that took place in 2009 to mark the Bottom of the Bear Market that time. There are some very good Signals that should give us a good steer for when we are after the Bottom this time around and I will show them clearly and point out what we need to watch for on some very simple Signals. Of course it is never easy but if we combine several simple Indicators we can get a very good pointer on when to start moving into ‘Buy Mode’. Last Week I wrote something about the need for a Flexible Strategic Plan and I suggest you read this and make sure you have a Plan to help get you through the next few months – they are unlikely to be easy but if you are controlled and careful there will be superb opportunities to make money once things settle down. And they will. On recent TPI Podcasts we have talked about the unfolding Market situation and as usual we have included plenty of other Educational type material. If you go to the ‘Podcasts’ page which sits on this website, WD2 then you can find links to them all and it would be well worth subscribing to the Channels so that you get flagged when a new Podcast is released. There should be another new one soon. You might have noticed on the Main Homepage on WD1 that there is a technical problem with the Dropdown Menu on that first page when using certain versions of Android. I have been in touch with Weebly Support and they suggest using a new ‘Theme’ for the Website as it should solve the issue. I had a play around with a few Themes last week and to be honest none of them grabbed me. It is quite nifty cos you can instantly preview what the WD Websites would look like with the various Themes and although maybe a couple I liked, I want something with similarities to the ‘look & feel’ the Websites already have (the problem is that nothing is amateurish enough for my tastes !!). I will play about with it more in coming days/weeks and don’t be too shocked when you turn up and see something totally different (I will keep all the Pages and stuff the same). Let’s do some Charts…….. S&P500 As always the pics are taken from the outstanding SharePad Software that I use and if you click on the images they should grow bigger so you can see more details. I am not totally sure how I managed it but with some mucking about I changed the ‘Settings’ somewhere in my Word Document and the images look in focus now and much better. The wonders of modern technology !! As is best practice, I will start with a Long-term Chart and this is the S&P500 going back 30 years so it is a lot of history. There are many interesting things happening here and the first one to note is how the S&P500 Price fell down to the Blue Support Line (Blue Arrow) which has marked the Support for the Bull Market since 2009. Look at how it then touched this Support and ricocheted off and we had the bonkers jump of 10% on Friday (I am always saying that Fridays can do ‘weird’ things !!) and we Closed at 2711 which you should be able to see in the Small Grey Box on the Right Hand Axis. As I mentioned above, I suspect this was a Bear Squeeze or Short Squeeze and it is highly likely the Markets come under more pressure in coming days/weeks. If that Blue Support Line fails (I will be amazed if it doesn’t !!) then the Horizontal Support at about 2350 comes in to play where my Black Arrow is. If that fails, then we go down to the Black Ellipse which marks a wide Support Zone between about 2200 down to about 1850. Below that we have the Red Line (Red Arrow) at about 1600 which is quite sweet because it was former Resistance that would now become Support and that should be quite strong. We might well be finding out soon enough !! I showed these Last Week but I will just run through them again. I did some Fibonacci Retracements based on the Whole Chart (you could do them for just the Bull Market since 2009 and this would give nicer results) and my Red Arrow at about 2100 marks a 38% Retracement from the Peak and my Green Arrow is a 50% Retracement at about 1700 and the Pink/Mauve Arrow is 66% and 1150. That last one is really scary !! We cannot know if these Fib levels will come into play but they give us a steer as to where the Bottom could be and as we approach these Numbers (if we do) then we need to be on our guard and looking for Bottoming Patterns and Signals. I am pretty sure Markets fell about 50% in 2009 but I will look into this in the Blog I will do during the Week. 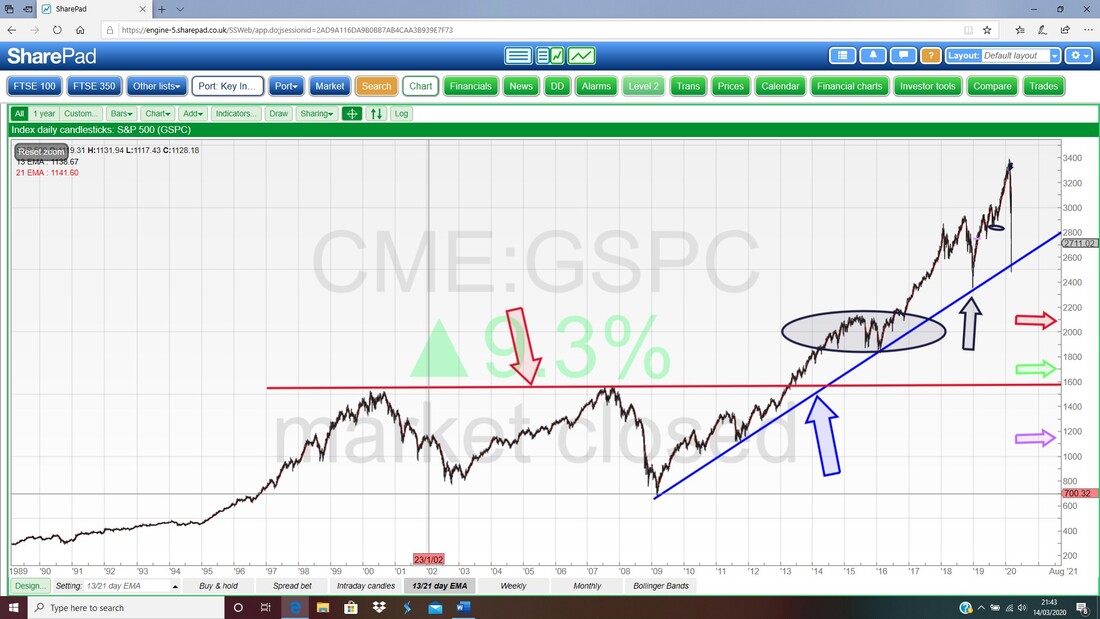
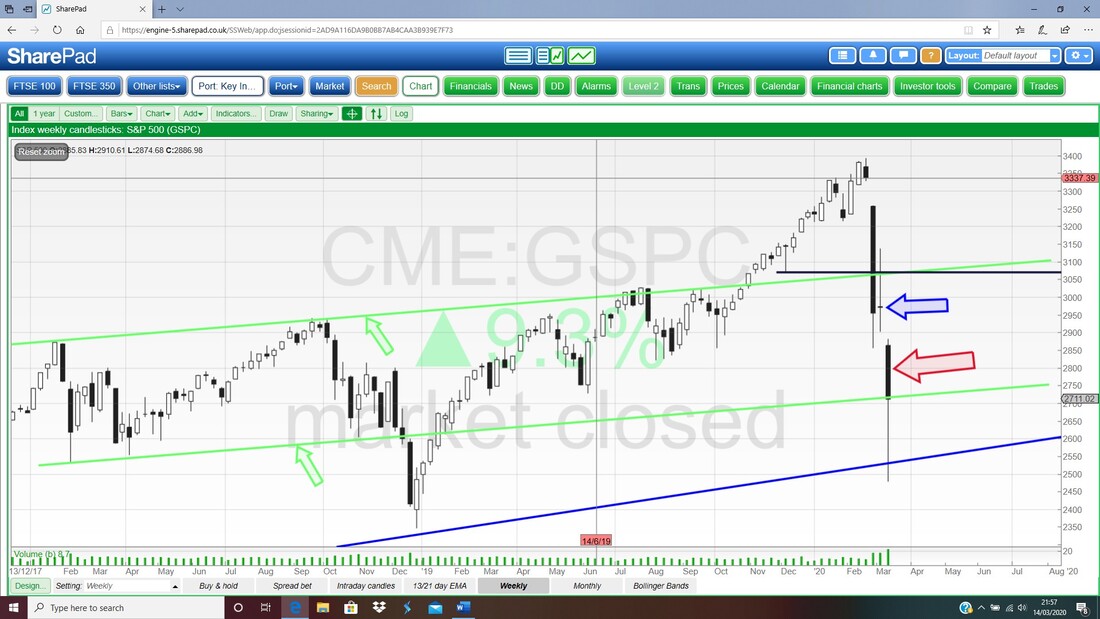
Next we have the Weekly Candles for the S&P500. My Red Arrow points to a Hammer sort of Candle for last week which in normal times would be quite promising but it still ended the week down a lot. The bottom of the Hammer is 2478 and that is now important Support and the High is up near 2900 and note how that is also the Low of the week before which I have pointed at with my Blue Arrow. It is likely to be tough Resistance now. The Candles for each of the last 3 weeks show how nuts this Major Index has been with dramatic swings and choppiness.
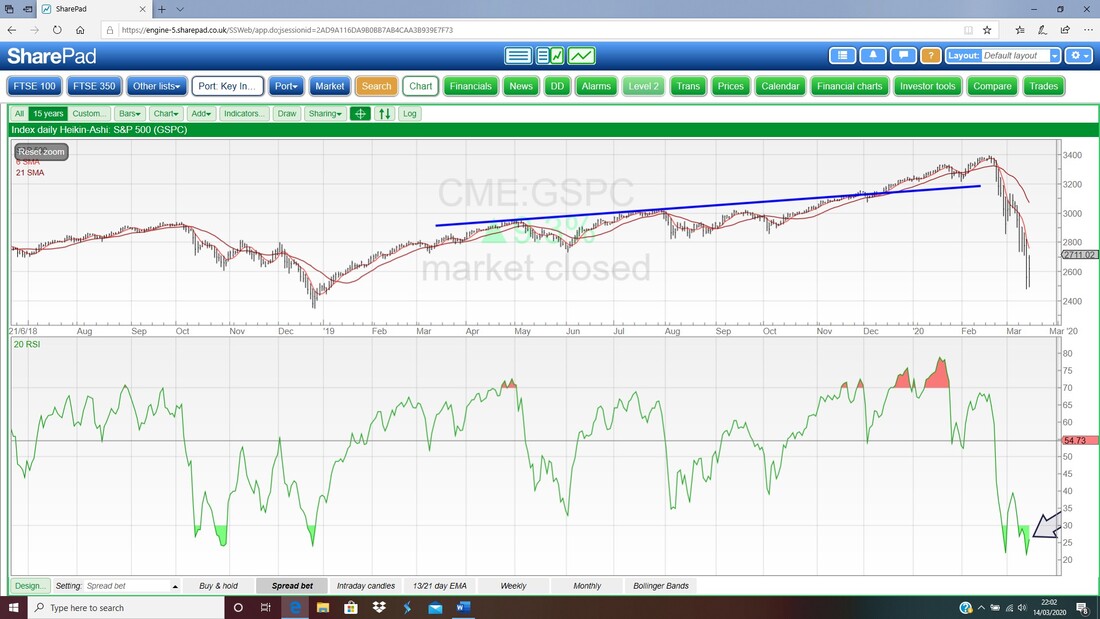
In the bottom window on the Screen below we have the RSI (Relative Strength Index) for the S&P500 Daily. Where the tip of my Black Arrow is we are on a reading of RSI 26 and this perked up a bit from where it was on Thursday – before the jump on Friday. RSI 26 is an extremely low Reading and normally you would expect more upside but this might be difficult with the dire News we have had so far this weekend and no doubt more to come tomorrow. It is likely that any attempts to Rally get sold into as Investors/Traders use them to exit Long Positions.
Last up for the S&P500 we have the Daily Candlesticks with the Pink Zone marking the Upper and Lower Bollinger Bands. My Black Arrow is pointing at the Up Candle from Friday and this Closed at 2711 and this could be Resistance but up above that we have Resistance where the Green Line is (Green Arrow) at 2855 and not far from that the Mid-Line in Red of the Bollinger Bands is pointed at by my Red Arrow. This Mid-Line can often be Resistance. To the downside, the Bottom of the Candle from Thursday is 2478 and if that fails expect more trouble to follow soon after.
In combination the Candles from Thursday and Friday look quite Bullish but it could be that the move on Friday was just ‘Filling the Gap’ which was from where the Candle for Thursday Gapped-Down at the Open from the Wednesday Close. I won’t show the 13/21 Day EMAs tonight as they are still very bearish and not much has changed. It would need several good Up Days to get these to a Bull Cross. No Chance I suspect. 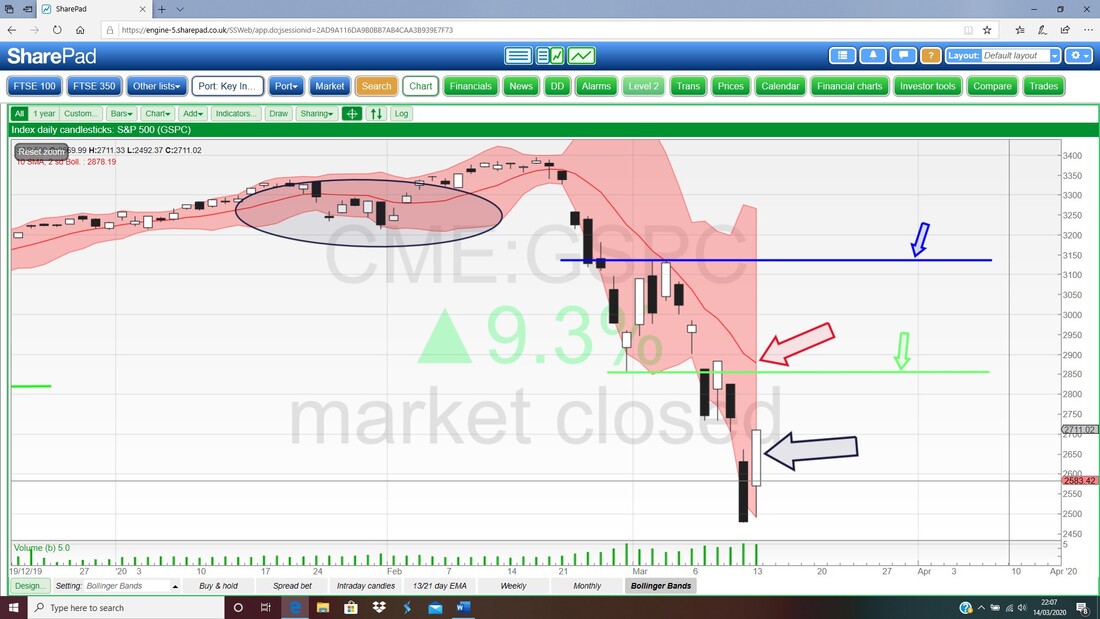
FTSE100
Here’s a Long-Term Chart for the FTSE100 going back to 1985 ish. Look how the Price dropped down through my Red Support Line (Red Arrow) which marked the Support for the Bull Market since 2009 so the Bull Market is dead on the FTSE100. On Friday the FTSE100 Closed at 5366 which is in the small Grey Box on the Right-Hand Axis and it hit a Low of 5237 which is Support in the near term. Down below that the Black Support Line (Black Arrow) is really important because this goes back forever and if this is breached things are really really truly truly dire dire. The Black Line should come in at 4700 and this happens to be near 4900/5000 which would be a 38% Retracement on the Fibonacci’s. Below that my Blue Arrow and Green Arrow are both pointing to Support around 3500 to 3300 and that should be very strong Support. Note also that a 50% Fib Retracement would be about 4000. 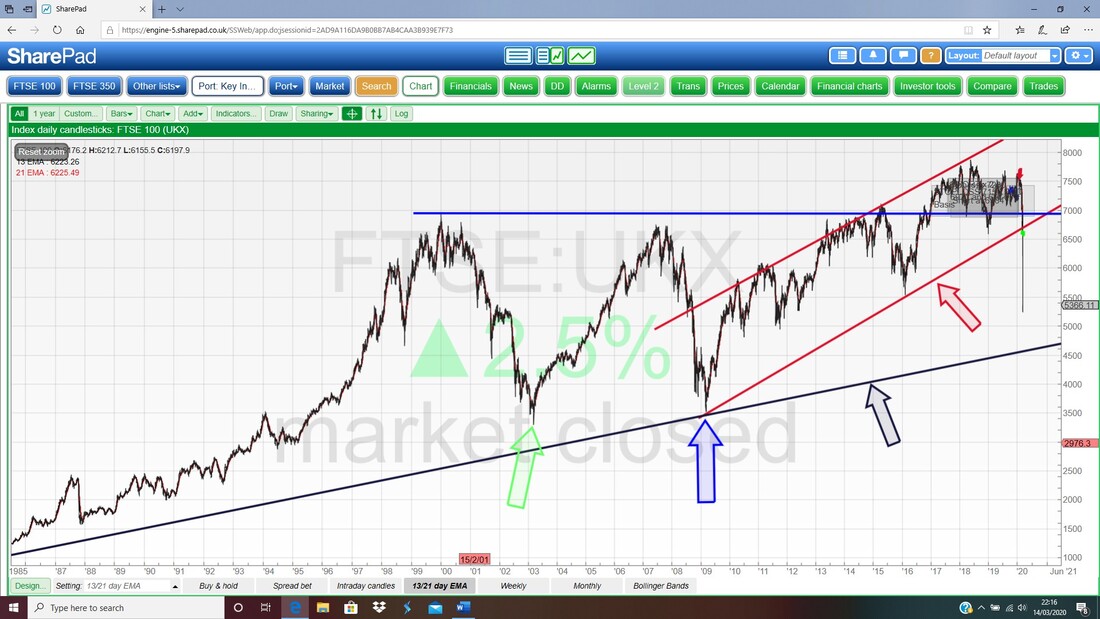
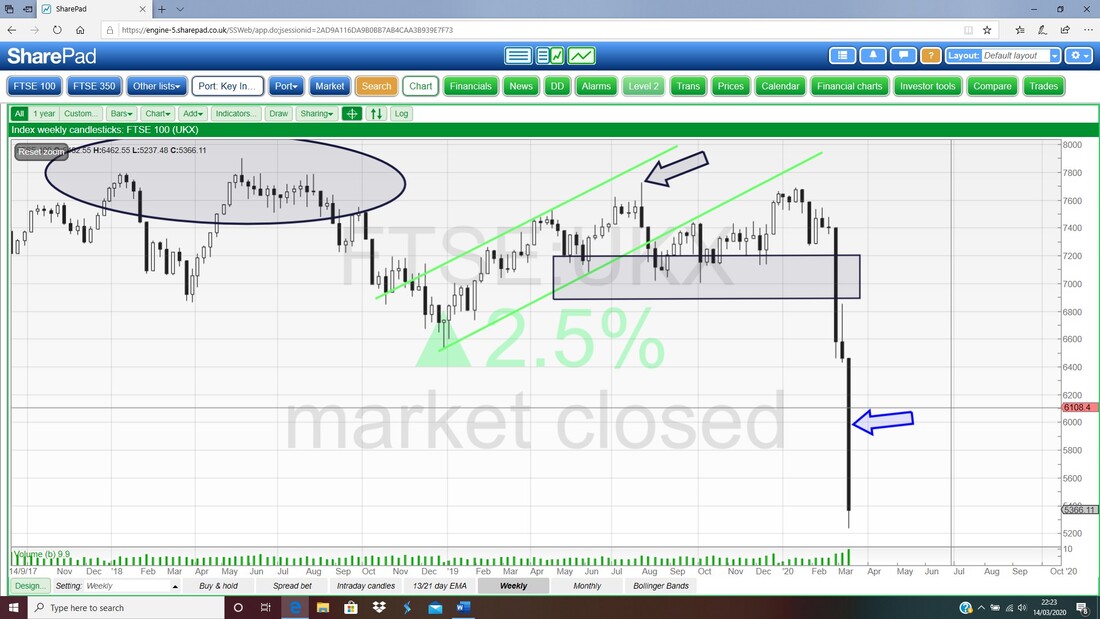
Next up the Weekly. My Blue Arrow is pointing to a really nasty huge Down Candle. No way to spin this, that is ugly.
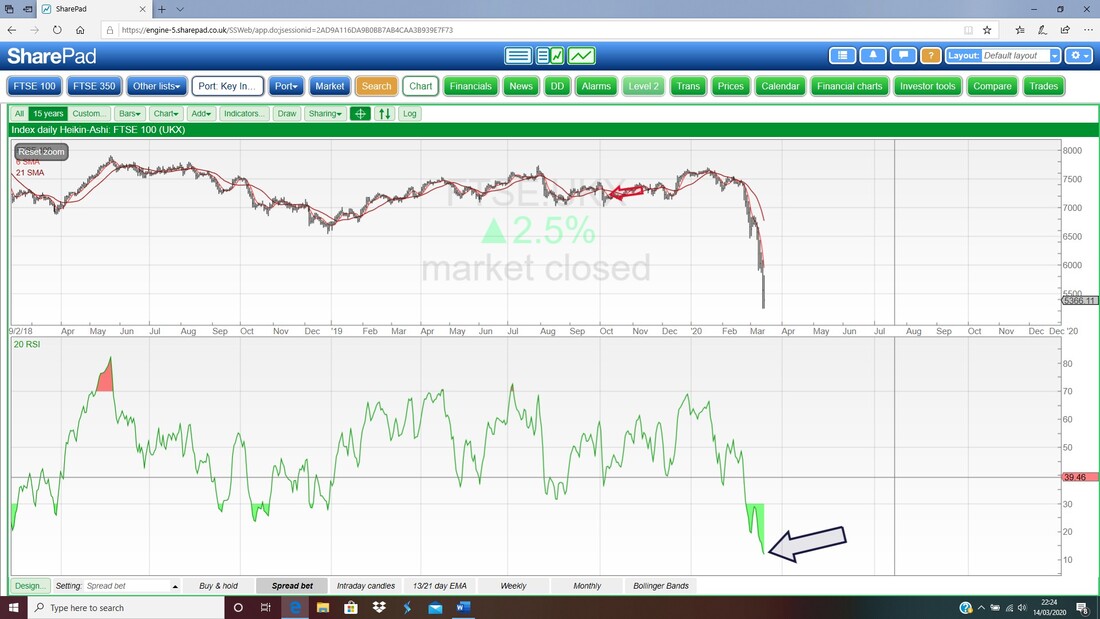
In the bottom window below we have the RSI for the FTSE100 Daily. This is nuts because on a Reading of RSI 12 it is just about the lowest I have ever seen. This suggests a bounce is due but I won’t be holding my breath for it. It is possible that a bit of Sideways wobbling would unwind this extremely Oversold situation and that is quite likely. Such Sideways movement would form a ‘Ledge’ and be a Consolidation before another lurch downwards.
Last Chart tonight has the Daily Candles and the Bollingers. The Candle from Friday combined with that from Thursday suggests a ‘Bullish Harami’ but I suspect it will be difficult for it to play out that way. If it does rise off this, then there is Resistance at the High for Friday up at 5700 and we have Support at 5237 which must hold. My Red Line (Red Arrow) looks like tough Resistance up at 6231. Perhaps as I mentioned on the previous Chart we will get some Sideways wobbling and a Ledge.
OK, that’s it. Good Luck for the coming week and please take this Virus thing seriously because it is going to kill a lot of people and is much more serious than many people have realised. Regards, WD. 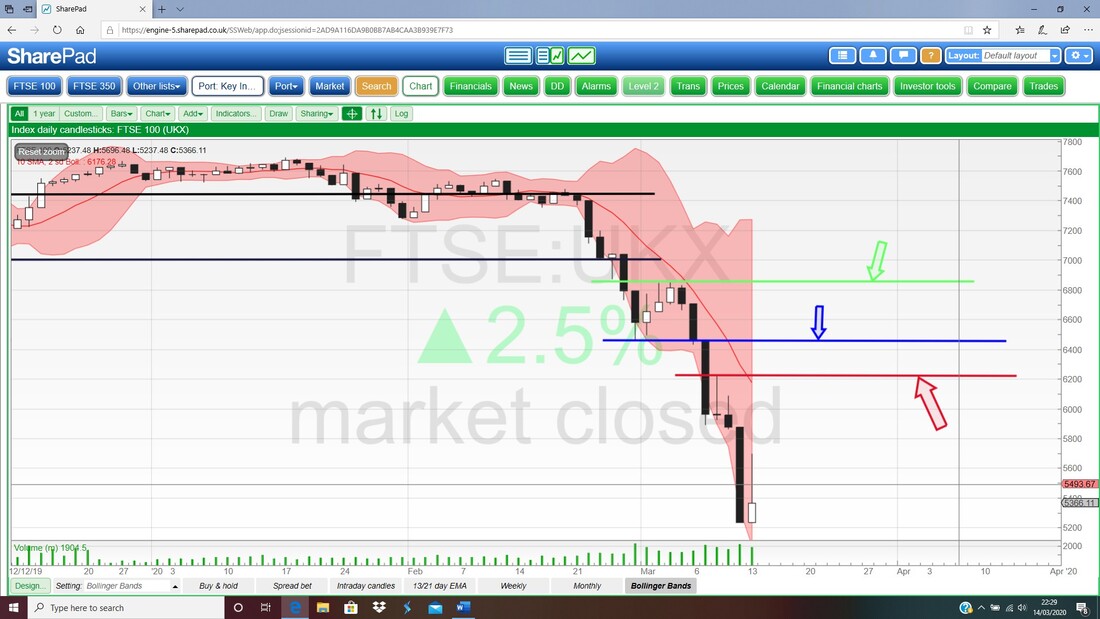
2 Comments
Tony Moxon
3/14/2020 05:33:42 pm
first class stuff as always.
WheelieDealer
3/24/2020 04:26:17 pm
Hi Tony, Leave a Reply. |

Stocks & Markets WheelieBlogsThese tend to be more Markets and Stocks related and timely - the Blog Page on the Main WheelieDealer Website has the 'Educational' stuff (well that's the theory anyway !!). Archives
October 2021
Categories
All
|
