

|
stocks & Markets blog |
|
It’s rather nice to have ended Quarter 1 with pretty good numbers on the board and I know a lot of Readers are in a similar nicely buoyant boat, and we should all be pretty pleased.
I guess if you are not fortunate to be in this position, then unless you have been extremely unlucky and worse than this, done something totally daft, your damage can’t be too bad and we still have 9 months to turn things around. Obviously sticking to the basics like buying Quality Stocks; focus on valuation; diversified Portfolio; Running Winners and not chopping their legs off; keeping calm and not panicking etc., will probably see things work out fine.
A slight nagging doubt I have is that I remember many years where my Portfolio has closed out Q1 looking very good, but then I have gone on to see a lot of my gains wiped away in a pre-summer sell-off. As things stand, I am not seeing any signs of this, with Indexes up near their ATHs (All Time Highs) and the positive news from Vaccination rollout programmes and pretty crazy levels of government borrowing and spending, are outweighing any gloomier considerations such as the appalling mess Europe is making of the C19 Crisis or fears over Rate Rises.
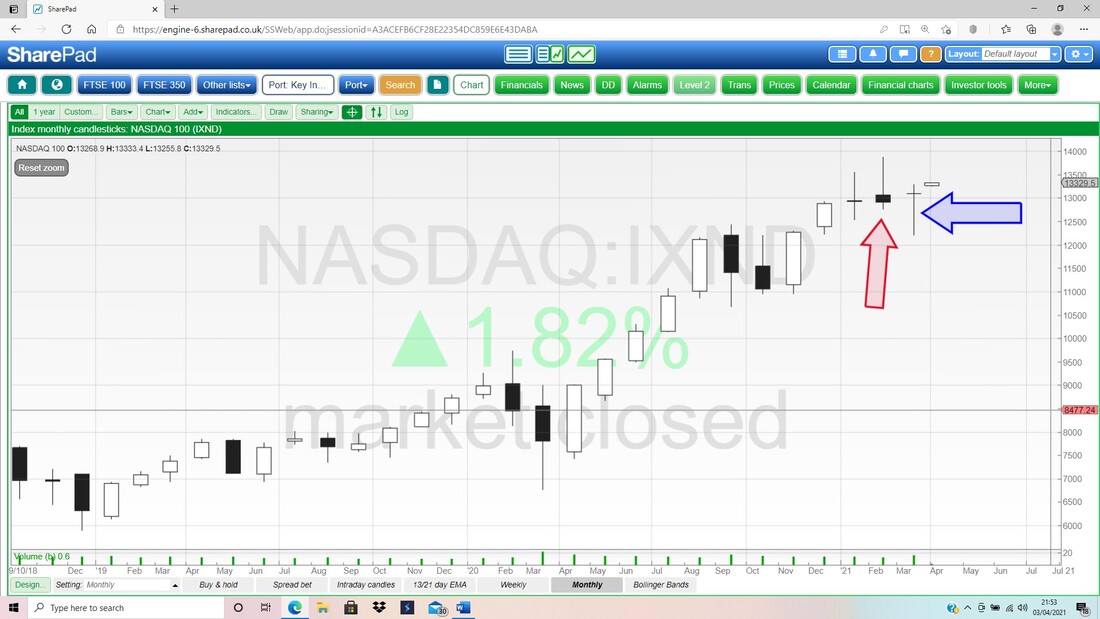
Things that do worry me though are the evidence of many Bubbles (Bitcon, Non Fungible Tokens, Reddit crazies, SPACs etc.) and just last week we had yet another example of a Hedge Fund with huge leverage causing knock-on problems for major Banks, who seem to see no issues with lending money to a Hedge Fund manager with an Insider Dealing conviction. Despite all the new regulations and suchlike, the old habits on Wall Street and the other major Financial Capitals, don’t seem to have changed much. The way things are playing out at the moment is that the more old-fashioned Indexes like the DOW, S&P500, DAX, CAC40, FTSE100 etc. are doing ok or very well, but the heat has largely come out of US Tech in the Nasdaq Indexes and despite some bounce last week, I suspect the down move is still in train. I have a small Short on the Nasdaq 100 and I will look at the Charts later to see how things are playing out. It is hard to get away from the over-valuation problems among a huge swathe of Tech and on top of that it can only be a matter of time before Politicians clamp down on unsociable activity from the ‘Social Media’ companies; and the ‘Gig Economy’ companies are already getting scrutiny and I expect a lot more. On top of this, the advantage Online Retailers have in terms of Taxation, is simply not a sustainable situation. So my hope is that this year we avoid a pre-summer Sell-off but instead we get more of the rotation from Tech to boring Indexes. It would be extremely unusual because normally all the Major Indexes and Tech move in the same direction, but it really does look “different this time”. I hope things play out this way. More by coincidence than by design, I probably have a lot of exposure to ‘old Economy’ stuff and my relentless obsession on not over-paying for Stocks means I have most of my Portfolio at pretty attractive valuations. This should mean I am well placed if the rotation out of Tech does continue. Last Week Quite a strange week and partly following a regular pattern of 2021 so far, where we see weakness right at the end of the Month. Fortunately, after quite a dodgy start, my Portfolio had a nice bounce on Thursday and I ended up seeing it end up just 0.15% down – which I see as just a ‘Noise’ movement and nothing to be concerned about (particularly for a short week leading up to the Easter Break). My Portfolio is looking very nice and I have banged in a solid gain for March – I will update the ‘Monthly Performance’ page on WD1 in due course. My Strategy stays as ever. I am pretty much 100% Invested and have a tiny Short on the Nasdaq 100 worth about 3% of my Portfolio Value. I want to buy something in my Income Portfolio but I am being a bit cautious and want to build my Cash a bit more before doing any moves. I have a couple of Takeover Situations in CAMB and TCM and if they play out, then it will free up Cash and Slots so I can get buying. If you look at my ‘Little Black Book’ page on WD2, then you will see loads of Ideas for the sort of Stock I will be looking to buy (I updated the LBB a few days ago). Blog Slate Sadly nothing much to report here. I have made no progress on getting Blogs written and I still have no news from Stock Mandeville Hospital. I will nag them next week and try to find out what the hell is going on. Fortunately, the situation is not getting worse and I mostly feel fine as long as I make sure I sit back and don’t put pressure onto my stomach area. We should be recording a new ‘Twin Petes Investing Podcast’ this coming week and that will be out for next weekend. In the meantime, you can catch the last one, TPI 41, here: https://soundcloud.com/user-479955511/conkers3-wheeliedealer-45-winning-stocks-tsla-vs-vow-bmy-abdp-hfd-pets-gaw-ixi-sdg-ai As always you can find the ‘Twin Petes Investing’ Podcasts on pretty much all the big platforms, and you will find them at the ‘Conkers Corner’ channel on the likes of Apple, Audioboom, Spotify, YouTube, Overcast, Google+ and probably a few others. You can also go to the ‘Twin Petes Investing Podcast’ page on WD2 and you can play them directly from my website. From the Master of the Rolls I was watching the rather excellent ‘QI’ the other day and they were talking about how Acts of Parliament are scrawled on vellum (dried calf skin or something) and are then ‘rolled up’ and shoved in the storage bit. Turns out this is why there is a role called ‘The Master of the Rolls’ – the job is to look after all the velum bundles. All the Blogs I have written are listed on the ‘Blog Index List’ page on WD2 and they mostly have Links. From that I bring you this old nugget: https://wheeliedealer.weebly.com/educational-blogs/are-you-up-in-your-helicopter-or-down-in-the-weeds I was reminded of this one after some conversations I had been having about a particular stock. Sometimes people just obsess about low-level detail and completely miss the Big Picture which is actually what will drive a Stock up or down. Nasdaq 100 All the Charts I show are taken from the excellent SharePad software I use and if you click on the images then they should get a bit bigger on your screen (I recommend you read these Blogs on a big screen rather than just a Fone – there is a lot of detail to be seen). If you fancy using SharePad or ShareScope yourself, then you can get 1 month’s Free Data if you go to the ‘Subscribe’ page on their website and then select the Product you want, and then you should see a ‘Promo Code’ box and if you type ‘twinpetes’ into that box, then the discount will apply. You can also get this by clicking on the Adverts that are all over my websites. I get a small payment for introducing you, so thank you very much !! https://www.sharescope.co.uk/ Of course, one thing I really want to look at is how the Monthly Candles ended up now that March is officially over and the Candles are now valid. So first up we have the Monthly Candlesticks for the Nasdaq 100 and my Blue Arrow is pointing to a Doji Candle for March where the Nasdaq 100 Opened and Closed at the same level (hench the narrow Body to the Candle) and it went down a lot during the month but managed to recover it all. However, my Red Arrow is pointing to a ‘Bearish Shooting Star’ Candle from February and this dominates the Chart. For such a Candle to be a ‘Turning Point’ downwards, we need to see falls in coming months now. For Bulls to avoid this scenario, we need to see the High of February (which is the ATH by the way), taken out. The little Candle after the one where my Blue Arrow is, shows just a tiny bit of April and of course has no validity whatsoever.
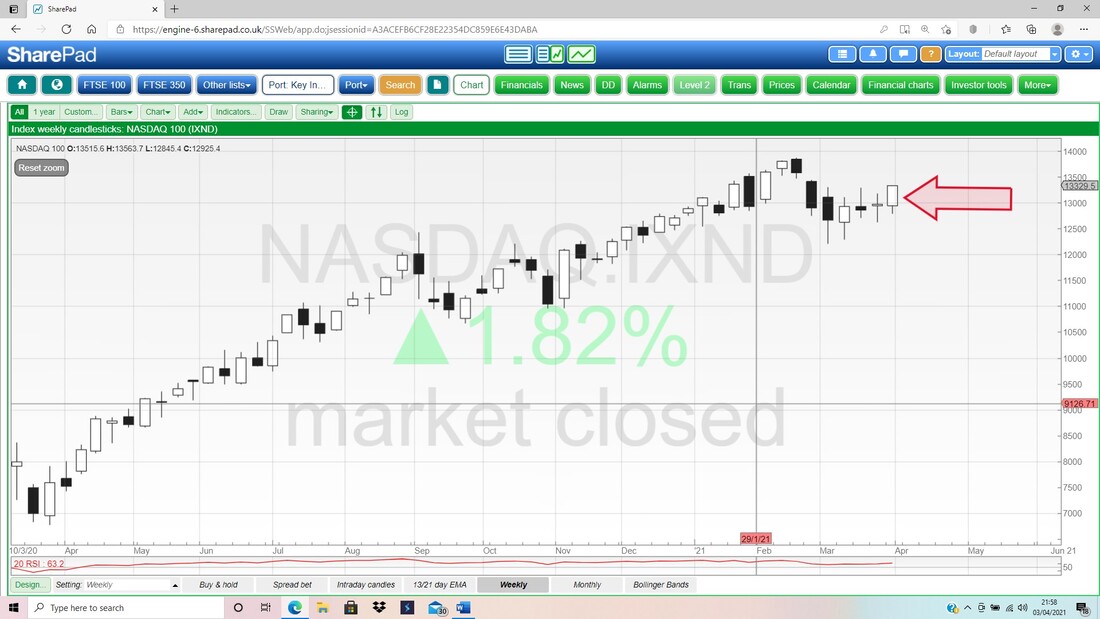
Next up the Weekly Candles for the Nasdaq 100. My Red Arrow is pointing to a nice White Up Candle from last week and this looks bullish.
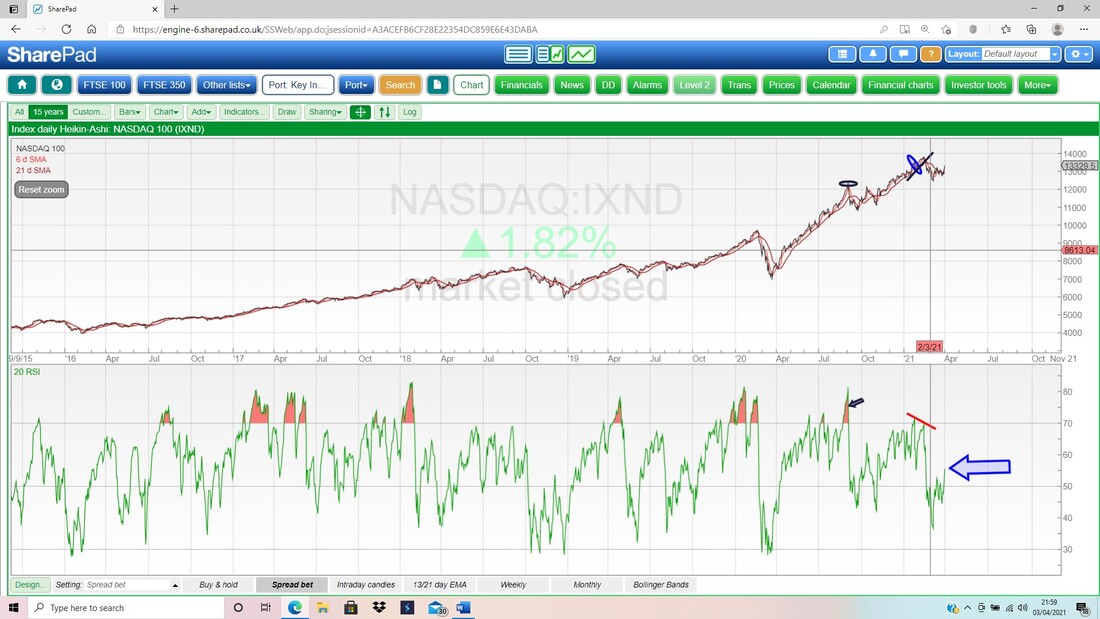
In the bottom window on the next Chart we have the RSI (Relative Strength Index) for the Nasdaq 100 Daily. And on a Reading of RSI 56 this is just off Neutral and can move a long way up if it gets the urge, and of course it has a long way to fall as well.
On my next Chart, we have one of my most fave Indicators in the form of the Black 13 Day EMA Line and the Red 21 Day EMA Line (Exponential Moving Average). My Green Arrow is pointing to where we are bang on a ‘Bull Cross’ and if this gets cemented, then it predicts more gains in the Nasdaq 100.
However, this Indicator is superb but it falls down when a market is choppy and moves sideways; we might be in such a situation now with the Nasdaq 100 and we need to give it a few days to play out. ‘False Signals’ can happen and this might well be one, especially because last week was a bit of a funny one with the Easter Weekend ensuring low volumes and unrepresentative pricing moves. There is a bit of a Gap on the Daily Candles between that of Wednesday and Thursday – it could well drop back to ‘fill the Gap’. 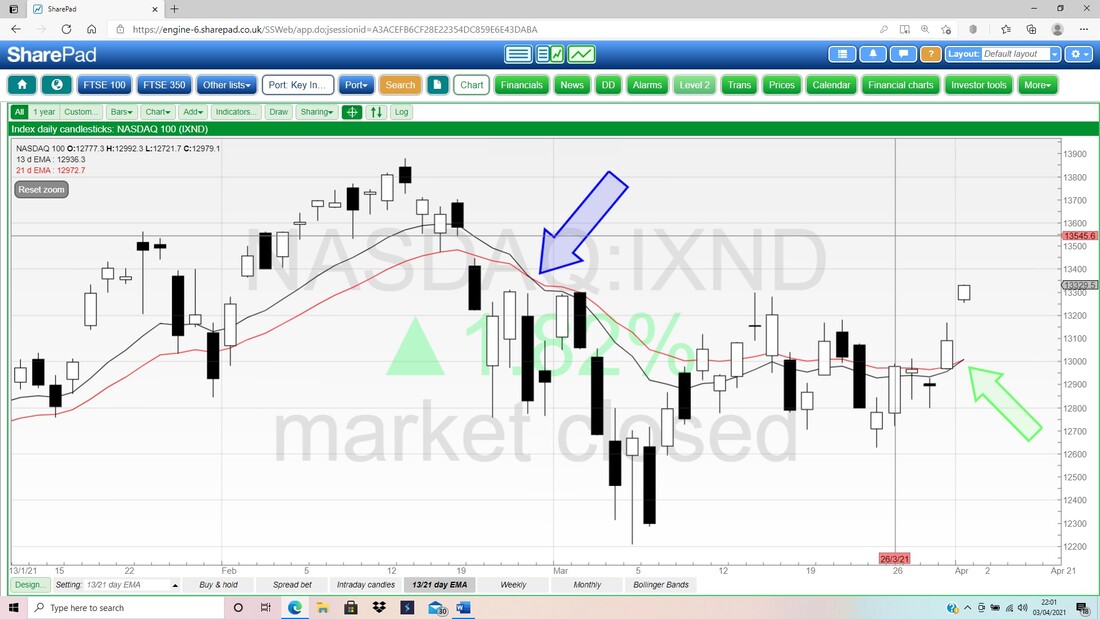
My last Chart for the Nasdaq 100 has the Daily Candlesticks with the Pink Zone marking the Upper and Lower Bollinger Bands. I just realised that my Stoploss on the small Short I have is pretty much triggered, but I will let Monday play out before taking any action (I think the US Markets are open on Monday but of course in the UK we are closed for the Bank Holiday). My Stop is at 13330 and the Nasdaq 100 Closed at 13329 on Thursday.
My Green Arrow is pointing to a Doji Candle that was formed on Thursday and note how it is right up at or even above, the top Bollinger Band. It Gapped at the Open which is very bullish but of course in such a strange week, just before the Easter Break, it could just be weird Price Action. My Blue Arrow is pointing to the High from a Bearish Shooting Star Candle from 16th March and this was at 13297. The fact the Nasdaq 100 has broken over this Resistance is a positive development. Note also that the Nasdaq 100 has now got through my Sloping Resistance Line drawn in Black and pointed at with my Black Arrow. 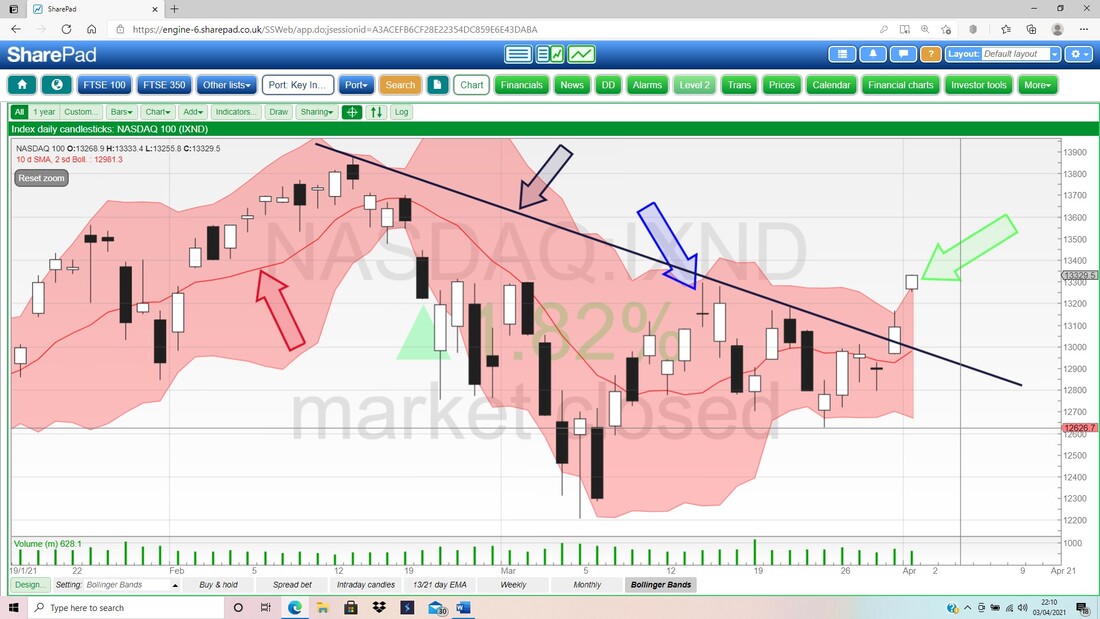
Brent Oil Composite
With the Suez Canal stopper now out of the bottle, the pressure to the upside is taken off Oil prices a bit, and I heard the queue to go through the Canal is cleared already. My first Chart for Brent Oil Comp is the Monthly Candles and my Blue Arrow is pointing to a ‘Bearish Shooting Star’ which in the context of many months of gains, means a drop is quite likely. The small White Candle after the Shooting Star is irrelevant because it is the start of the April Candle and we can ignore it. The High of the March Candle is at $71.4 and this is obviously Resistance. My Black Ellipse in the middle of the screen marks where there is a lot of ‘Congestion’ and from this we can see that $75 is Resistance and my Green Arrow is pointing to yet more Resistance up at $86.7. To the downside, there is Support at $60, then at $55 and $50. 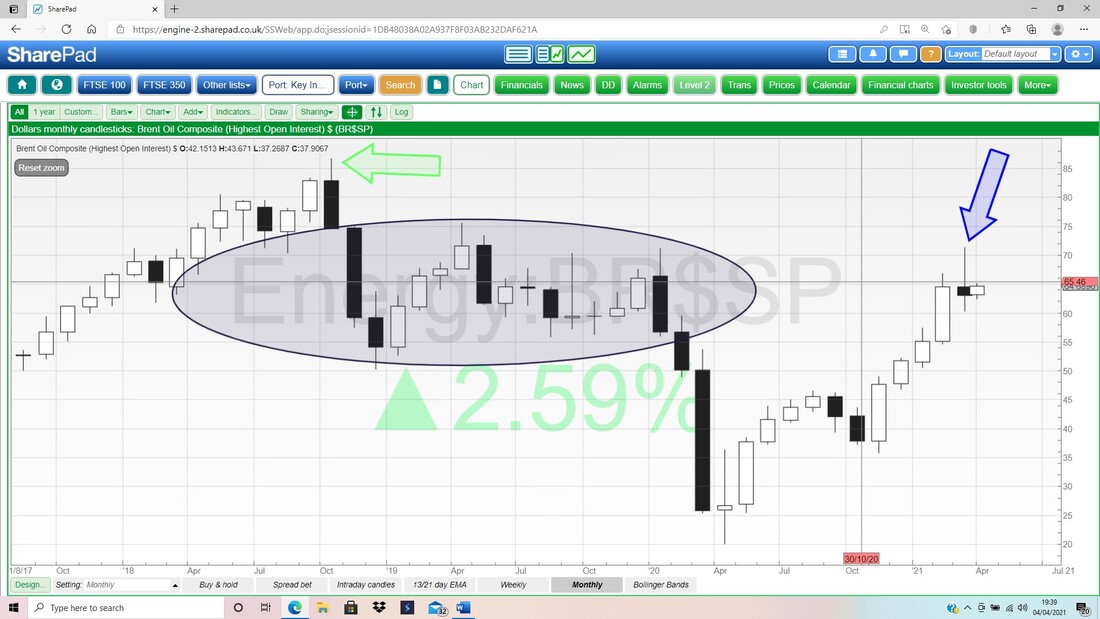
Next we have the Daily Candles for Brent Oil Comp and my Blue Arrow is pointing to a ‘Bear Cross’ between the 13 and 21 Day EMA Lines; but note they are now tight together and a little bit of strength could easily produce a Bull Cross. Equally, if we see weakness now then that would ‘cement’ the Bear Cross.
My Green Arrow is pointing to a nice Up Candle from Thursday but clearly the Price needs to get above $65.4 which is the High from 30th March 2021. It wouldn’t surprise me if we see a lot of sideways movement now. 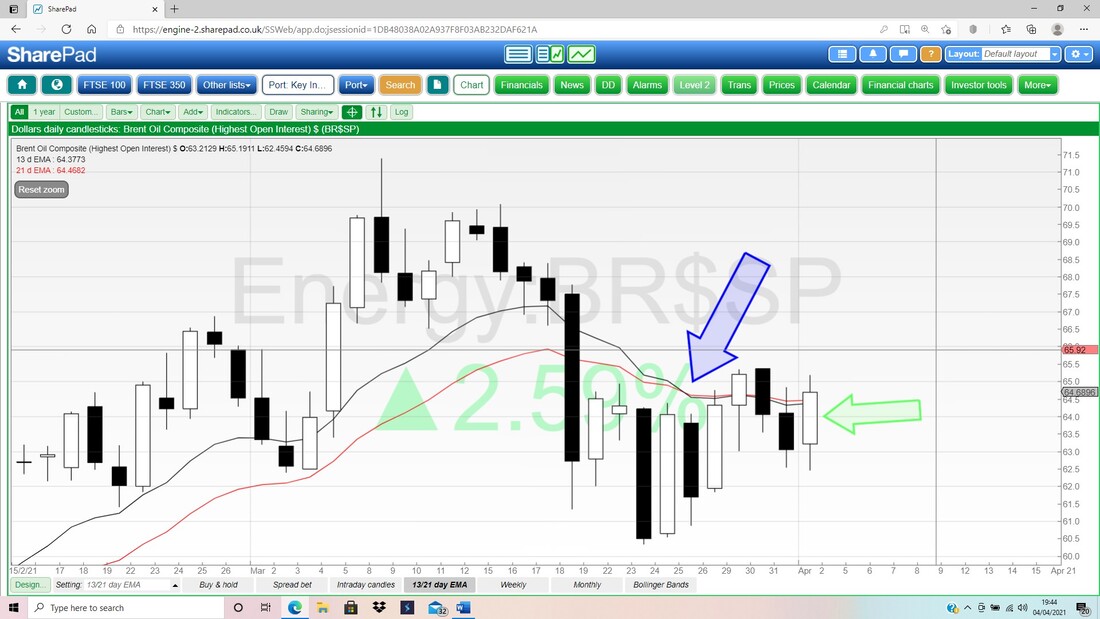
FTSE100
My Chart below has the Monthly Candles and my Blue Arrow is pointing to an Up Candle for March and after the ‘Bearish Shooting Star’ shaped Candles for both January and February, this is a positive sign. For a Bearish Shooting Star to ‘work’, then the next Candle should fall down below it; but of course in this case the Candle from March has risen above the Lowest Point of the February and January Candles. To the upside the key Resistance is the High from January where my Red Arrow is at about 6903. Above that there is a lot of Congestion between 7000 and 7800. To the downside, there is Support at 6000 and down to 5395 in particular. Nothing at the moment suggests we will be visiting the downside. As usual, you need to ignore the tiny little start to a Candle which comes after where my Blue Arrow is – this is the April one starting and has no validity. 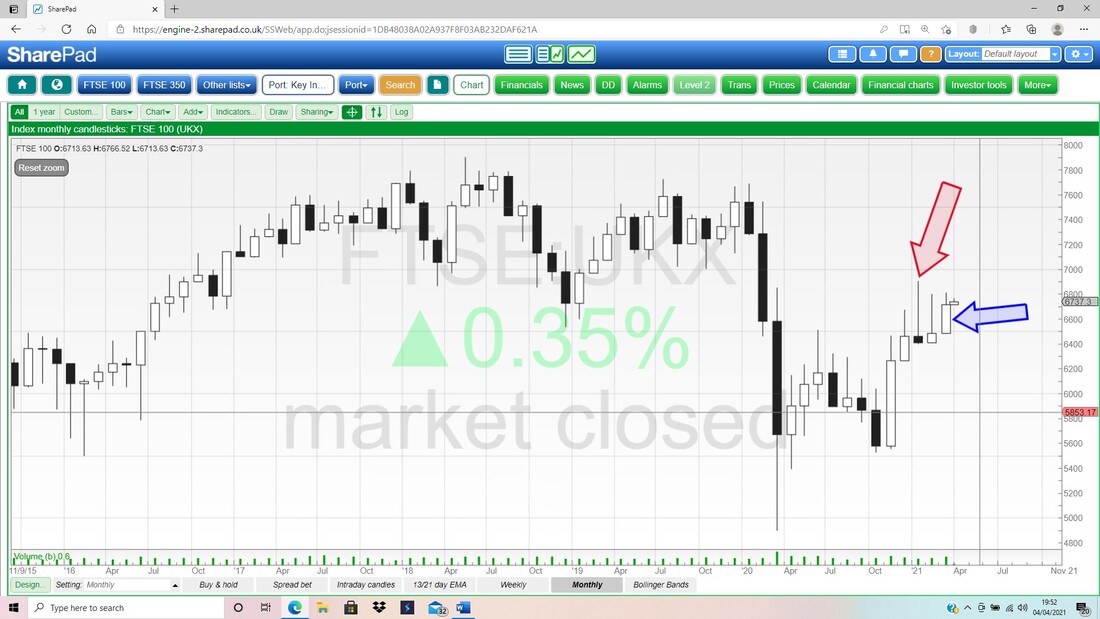
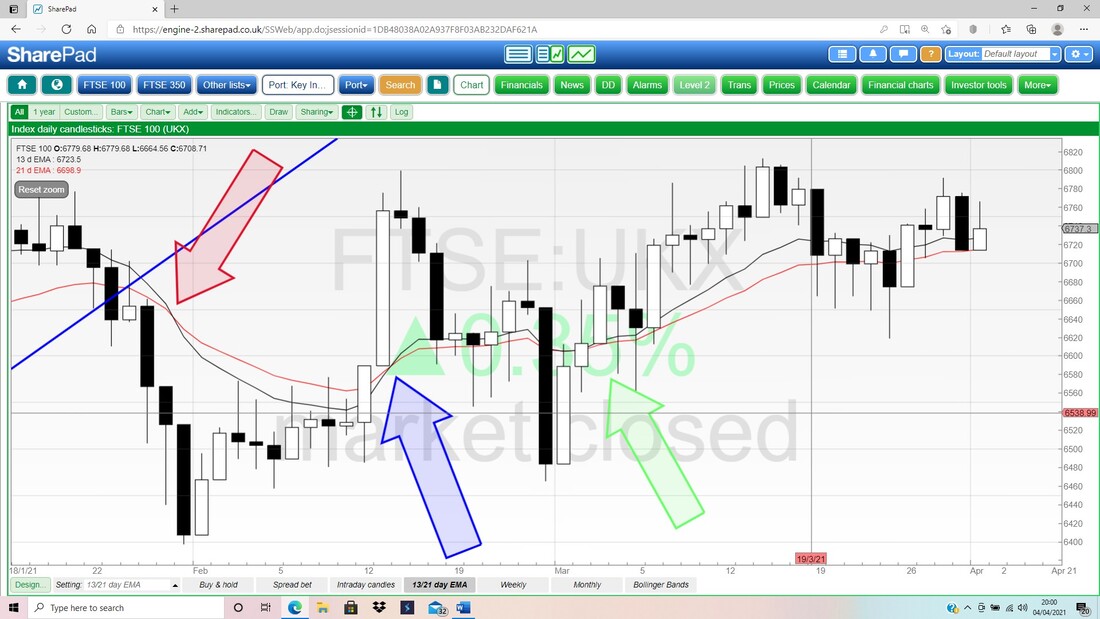
My next Chart has the Daily Candles for the FTSE100 but my focus is purely on the Green Arrow which shows a Bull Cross between the Black 13 Day EMA Line and the Red 21 Day EMA Line. That Bull Cross is still in force.
Next the Weekly Candles for the FTSE100. My Blue Arrow is pointing to a classic Doji Candle from last week (I call these a ‘Star’ Doji but that is probably not the textbook definition !!). Really the story here is that the FTSE100 has been going sideways in a pretty tight range for ages.
But my Mauve/Pink/Purple Line which I showed last weekend (pointed at with a similarly coloured Arrow), is showing a rising Support Line and this could be squeezing the Price upwards; if you like, there is a bit of a Triangle going on here. There is Resistance at 6800 in particular and then at 6903 where my Green Arrow is. A Breakout over 6903 would be a highly welcome development. 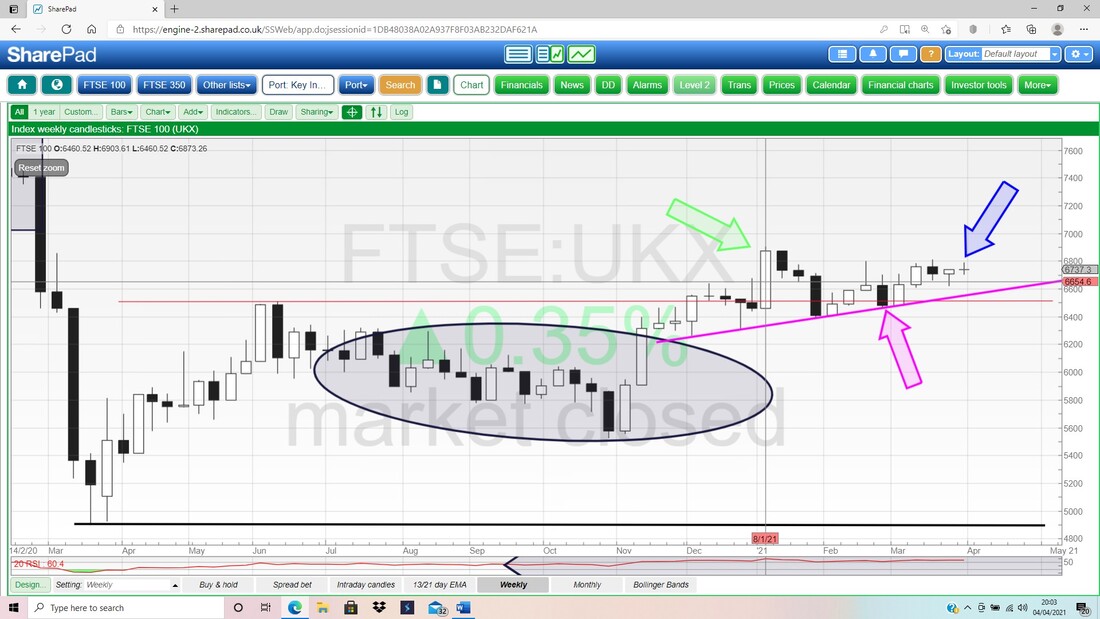
Finally for the FTSE100 this time (I won’t show the RSI because obviously with things just going sideways, the RSI is by definition around Neutral), we have the Daily Candle with the Pink Zone marking the Upper and Lower Bollinger Bands. The key thing here is that again these Bands highlight how the FTSE100 has really been going sideways, and how the Bands are pretty tight together. When that happens, at some point the situation will ‘Resolve’ and it usually means an explosive move either Up or Down.
My Blue Ellipse is an attempt to show how tight together the recent Price moves have been. 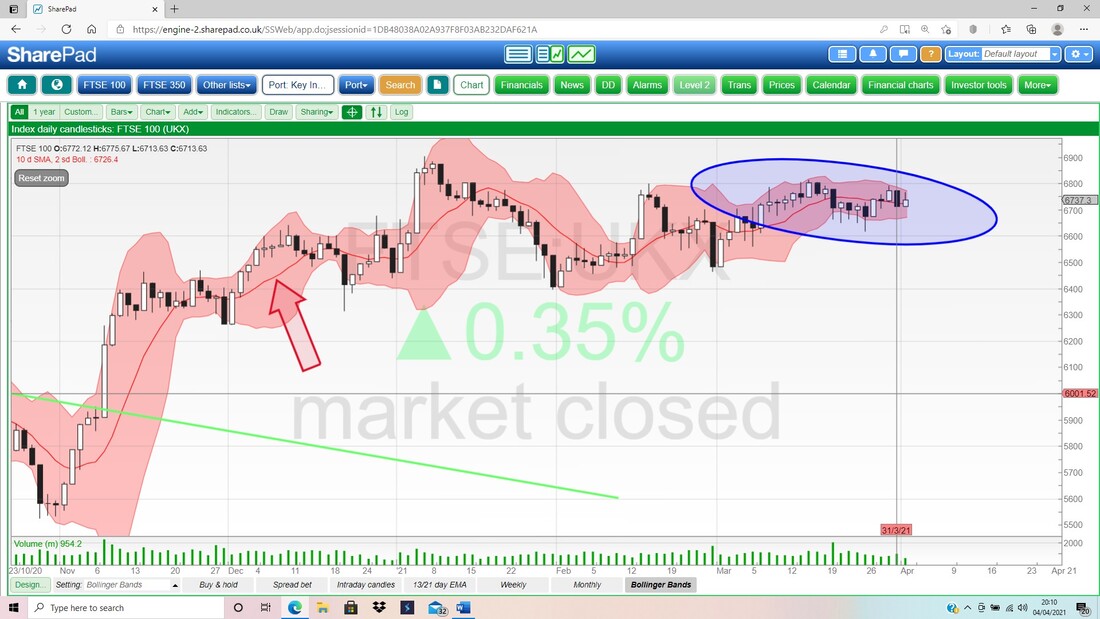
Monthly Candles
I will just show a few March Candles to see how things eventually played out. FTSE250 My Red Ellipse marks the Candle for March (obviously ignore the tiny one afterwards as that is the one for April) and this looks pretty good. The key thing here is to get above that Green Line (Green Arrow) at 22114 which is the ATH. 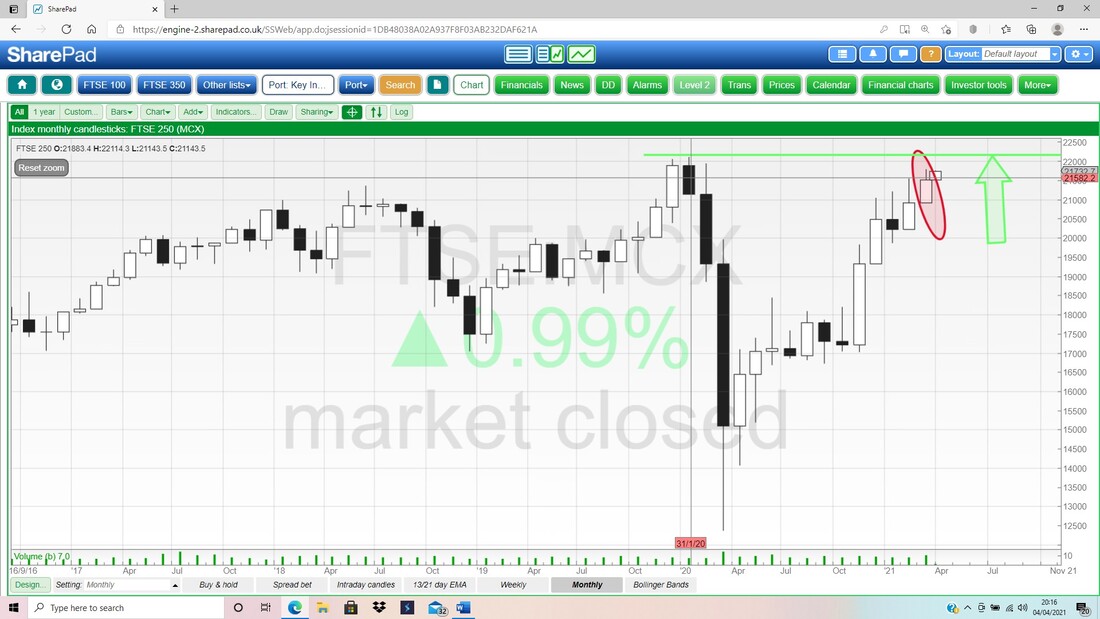
Dow Jones Industrial Average
My Red Ellipse captures the March Candle and this is Big White and Bullish. 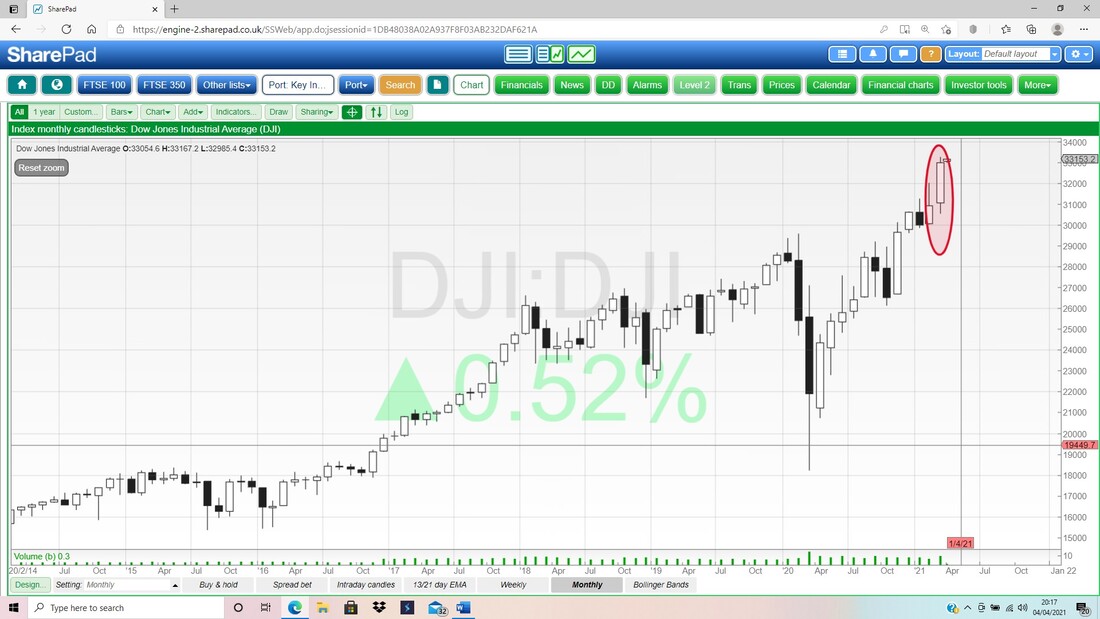
S&P500
Nice and Bullish. 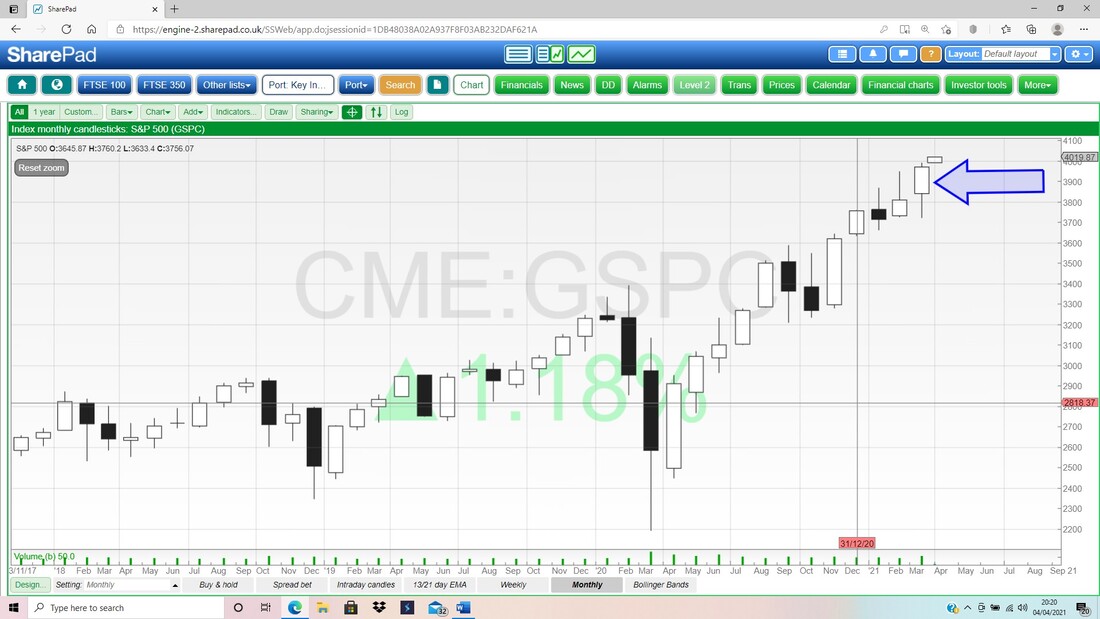
NIKKEI 225
This one is not so good. My Red Ellipse is highlighting a ‘Long Tails Doji’ from March for the Japanese NIKKEI 225 and this could be a Turning Point downwards. The key is the High from February at 30714 and if it breaks-out over that, then it should go higher. 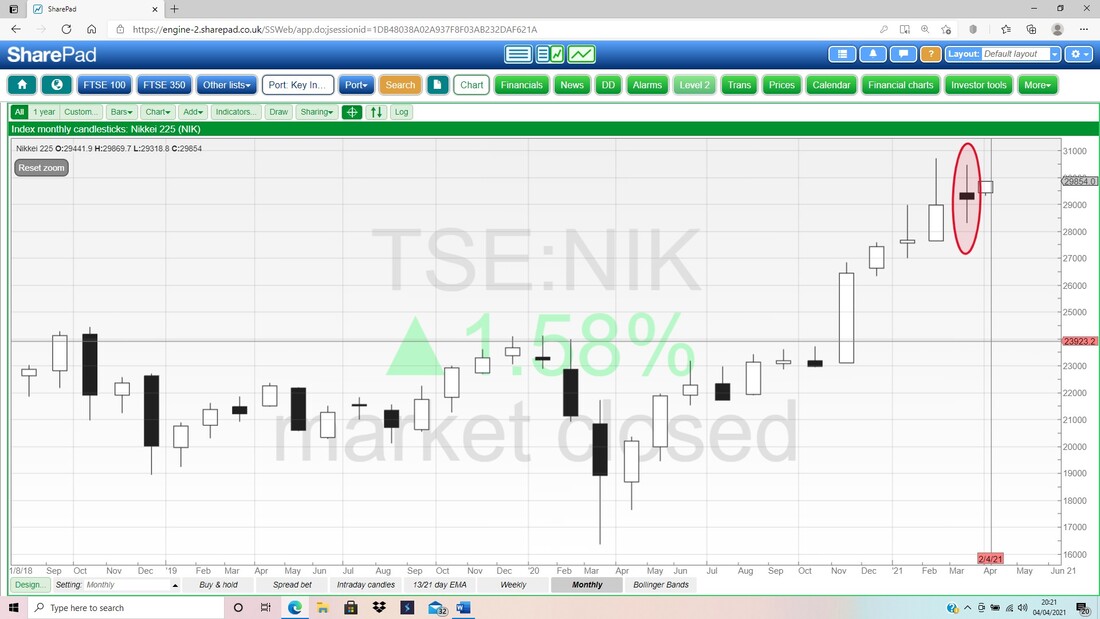
DAX
The major German Index looks Bullish. 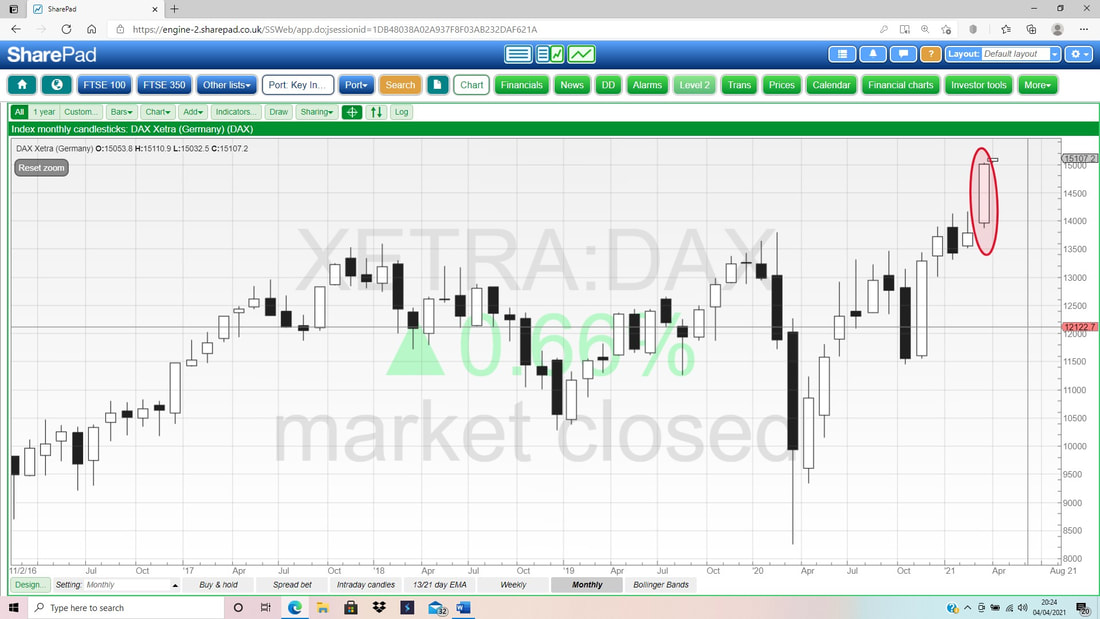
OK, that’s it for this week. Have a good week and hopefully we will all be able to get properly outdoors soon and to even occupying some Pub gardens !!
Cheers, WD.
0 Comments
Leave a Reply. |

Stocks & Markets WheelieBlogsThese tend to be more Markets and Stocks related and timely - the Blog Page on the Main WheelieDealer Website has the 'Educational' stuff (well that's the theory anyway !!). Archives
October 2021
Categories
All
|
