

|
stocks & Markets blog |
|
Well there is pretty much one game in town for this coming week and of course it is all about the General Election on Thursday with the results starting late on Thursday night; and by the Market Open on Friday we should know where we stand and no doubt the Futures Markets will have been going nuts overnight.
Before starting this Blog I had a quick look at the excellent ‘Britain Elects’ Feed on Twitter and something like 4 recent Polls had a Tory lead of around as much as 10% - that kind of level should give Boris a big Majority and although most people don’t expect that, I reckon it could happen. In fact, I am pretty sure we will get at least a 30 Seat majority with Brexit being the dominant factor by which Voters are being swayed despite the attempts by Corbyn to drag it onto ‘domestic issues’.
The cut-off point seems to be about a 5% lead for Boris and if this happens he might sneak a very small majority but it is extremely tight and it might mean a Hung Parliament. Something that could be a huge factor is the distribution of the votes – my hunch is that Labour are racking up votes in Cities but they are Seats in which Labour is going to win anyway – so they are in effect useless added votes. The big fact that will weigh heavily I think is that 60% of Wards voted ‘Leave’ in the Referendum. There are continuous claims by the Second Referendum enthusiasts that people have changed their minds but I simply don’t think this is true.
It’s also highly likely that the Turnout for the vote is really low – it is unclear how this will impact the outcome and probably the most likely pattern is that voters on both sides of the Leave/Remain divide stay at home. It is also possible that bad weather on the day could have a small impact. Another thing that the last few years has showed us is that despite its obvious drawbacks, ‘First Past the Post’ might actually be the way things should stay. We had a Hung Parliament and it was really hopeless – Proportional Representation is probably going to just produce lots of Hung Parliaments and cause confusion and chaos and not really work out as many expect. For starters it is very much against Human Nature – the way our minds work is that once we have made a decision we see all new information in the light of our earlier decision and if it supports our decision then it adds to our Confirmation Bias and if the new information goes against our earlier decision, then we ignore it and probably say something like “oh, they would say that” or “yeah, but the data is biased” etc. etc. Secondly, I suspect people who have switched from Leave to Remain are pretty much balanced by people who have switched from Remain to Leave – and the more over-riding principle is that most people are utterly fed up with it and many Remain Voters will actually vote for the clarity Boris is offering simply to get the job done and move on. And of course most sensible people are terrified of Corbyn’s insane Spending promises. A Boris win with a very useable working majority could be very liked by the Markets simply because it brings some certainty. It might not be what many Market Participants want (by definition around 48% will hate it) but at least it will bring clarity whereas a Corbyn win will most likely take the form of a Hung Parliament (if only that was literal !!) and the sheer radicalism and turmoil of the policies he espouses will cause immense upset with Investors. And that is before we even think about yet more dicking about on Brexit where his approach is just off the scale, turned up to eleven, nuts. The most likely result of this is a big rise in the Pound although I suspect a lot of it is baked in already. If we do see this, then I would expect the FTSE250 and smaller Stocks to do well but maybe the FTSE100 will find things tougher. It is difficult to predict how this will play out but it might be that the FTSE100 does manage to rise but at a much slower rate than the Smaller stuff. I have a Short on the FTSE100 but I am happy to keep it on until the Election is resolved and next week I will make a decision on it. It is relatively small compared to my Longs so I might even let it run a bit but it is highly likely that Markets stay strong for the rest of December if we do get a Boris win. I have a Long Spreadbet on the S&P500 and to a large extent this should balance out the Short on the FTSE100 – in effect I have ‘Hedged my Hedge’ !! It will certainly be a big week but I suspect the early days will be fairly muted as Investors wait to see how things play out on Friday. Another thing that I have picked up on is that there do seem to be early signs that a potential Slowdown that was evident appears to be subsiding and we might get better Economic News out of Europe this coming week and of course last Friday we had some bumper US Jobs Numbers and this suggests the US is humming along very well. But of course we also have the wacky spectacle of the President going through Impeachment Proceedings although the Senate are likely to stop this when it gets to them. Only in our crazy 21st Century World could you have a situation where the Economy is buzzing along really well and people are feeling more secure and yet they want to throw out a President whose Policies have helped this happen. Yes, Trump is utterly off his nut and probably has racist tendencies but the fantasy that other Politicians are better is probably very naïve. It could be a very interesting situation if the Democrats in Congress get completely out of line with US Public opinion and they suffer as a result. But of course the US population seems divided almost 50:50 like what we do so no doubt there will be plenty of civil/cultural battles to come as the Impeachment process grinds through. As we will see in a bit, the US Markets look ultra bullish so I am very happy with my S&P500 Long. I might even add a bit more in coming days if I get the urge. Last Week A bit disappointing to be down 0.15% last week on my Portfolio but in reality of course that is just ‘Noise’ in that a few milliseconds into trading on Monday and my Portfolio will likely have recovered or lost much more than that. I have had a pretty good run in recent weeks with my Portfolio perking up a lot and I would ideally like to get it nicely into positive territory for the year by the time we get to December 31st. I am happy with my positioning to achieve that and I think it is just a matter of being patient. As I mentioned in the Update I wrote to the ‘Weekly Performance’ page (go and check it out if you have not read it) about a week ago, my Income Portfolio has been doing really well and if you add to that Income I get from other sources, then I have easily covered what I will spend this year on living and stuff so I am pretty happy. 2019 has turned out hugely more bullish than I expected back on January 1st but I have taken very little Risk as a result of my Hedging but of course I could have done that in a much ‘smarter’ way – as I mentioned in a recent Blog and there is a link to it in my spiel on the ‘Weekly Performance’ page. 2019 has been a very useful ‘Learning’ year for me though and one thing that I am certain of is that next year I will be doing much more with the Indexes in terms of Long Trades as well as Short Trades – but in both cases I will be using Stoplosses with iron discipline. I have spent a lot of time this year ‘reading’ the Index Charts and learning various Technical Analysis tricks and suchlike and just simply getting in the habit of applying my attention to these Charts etc. I think there is a huge opportunity to make money by going Long and Short as appropriate and it should be relatively stress-free as long as I stick to the plan of Short term but not Day Trades or any of that silliness. There are clearly opportunities on a timescale from a few days to a few weeks and using tools like the 13/21 Day EMA Crosses these can be exploited; but Risk Management with careful position sizing and Stops is non-negotiable and must be resolute and disciplined. I am stalking a Stock in the Video Gaming space and I have started writing a Blog about it which might see the light of day later this week – or at least Part 1 might. I am also interested in GTLY but it has done nothing much lately after the big move up – gutted I didn’t buy before that move but hindsight is the best Investment tool there is although it is always lost at back of my Shed when I need it !! Looking more into next year, I intend to buy something for my Income Portfolio but I have not decided if it will be new or a top-up on a Stock I already have. I suspect a decent Pullback could happen early in 2020 and that might be a chance to buy a Yield generator at a good price. I am in no rush but once I have moved on the Gaming Stock and I have some more time I will start seriously thinking about the Income Portfolio. My expectation is really that I will look for a new Stock to add but I could well have changed my mind by the time we get into early 2020. Master Investor Show Islington This is taking place on Saturday 28th March 2020 and is held at the Business Design Centre (BDC) in Islington which is in that London. I have probably been to this for most years over the last couple of decades and it can be worthwhile both for the Speakers and the chance to meet up with other Investors, although the Companies tend to be dominated by Oil & Gas and Resources AIM stuff which is certainly not by Cup of Darjeeling. Having said that, there are usually a handful of proper Companies and at least the limited choice makes it easy deciding which Stands to visit !! The Admission Fees are pretty cheap but if you use Discount Code BFMI you can probably get a FREE ticket: https://investoraccess.masterinvestor.co.uk/events/master-investor-show-2020/ I haven’t totally decided if I am going yet but I probably will and no doubt I will be mostly hanging around the Canteen area on the top floor. There is a Restaurant of some sort next door and usually we pop in there. It used to be pizzas but I think it was some sort of burger joint last year. NOTE – it looks like the Share/Cenkos Growth & Innovation Forum which is on February 11th is now full up but if you contact Dan the Editor at Shares Mag maybe he can help you. Blog Slate I did a bit more work on the Gaming Stock Blog last night but there is still loads to do. I am not doing much socially this week so I should have time to get focused on it but of course the General Election will distract me later in the week and I expect to be up really late on Thursday Night as the results come in – usually on such things I can only safely get to sleep once I know what the result is going to be – so it could be 4am or something. I am very keen on the Stock and I don’t want it to get away so I might buy a Starter Position before I actually finish the blog and my Research. However, I am happy enough that the Stock is decent and any further Research will only inform the size of Position I will eventually take. If I discover something that worries me a lot then I might just stick with the Starter Position but if nothing comes up, then I will probably buy a fair bit more. I have been stalking it on the Chart and once I get the signal I will be buying. As I mentioned above I would like to do something on my Income Portfolio and the chances are I will write some Blogs regarding this once the Gaming Stock one is out of the way. I also of course have to write a ‘Scores on the Doors 2019’ Blog in the coming weeks (strewth, the end of December has come around so fast – although I am loving the excuse to stuff my fat belly with Christmas Pud and Mince Pies !!) and I have created a Plan to write a Blog about how to hold a Stock for the Long-term but I have yet to actually start writing the text. Last week I updated the ‘Weekly Performance’ page and I have some ‘Non-Fiction Books’ that I need to put in the Bookshop and I have done a few draft blogs for those. By the way, thank you for all the books you lot keep buying – it is really boosting the Beer Fund. Ghost of Xmas Past I wrote this one back in September 2018 and it has been on my mind recently that what I wrote in it has been very much borne out by the performance of my Portfolios this year. No doubt I will cover this more in my ‘Scores on the Doors’ blog in a few weeks but the effect of smaller Positions hurting a Portfolio less as they drop away and big Positions boosting a Portfolio as they rise has been clearly in evidence in the Real World: https://wheeliedealer.weebly.com/educational-blogs/the-diminishing-problem-part-2-of-2 OK, some Charts are needed now then……. S&P500 As always, the Charts I show are grabbed from SharePad which is this excellent online Software thing I subscribe to. If you click on the images they should grow larger, assuming I have set them up right when loading the Website. First up we have the Weekly Candlesticks for the S&P500. Actually this is a bit surprising because where my Blue Arrow is we have what could be a Bearish ‘Hanging Man’ – if so then it would mean the High at 3154 from the previous week is a Turning Point from which to drop. However, with December usually such a strong month this would be surprising and I suspect there is still upside here. We shall see and of course this Hanging Man is a warning that perhaps things aren’t as Bullish as they seem. When you look at the string of Up Candles leading us to this Hanging Man, it would be possible to think some weakness is getting due. 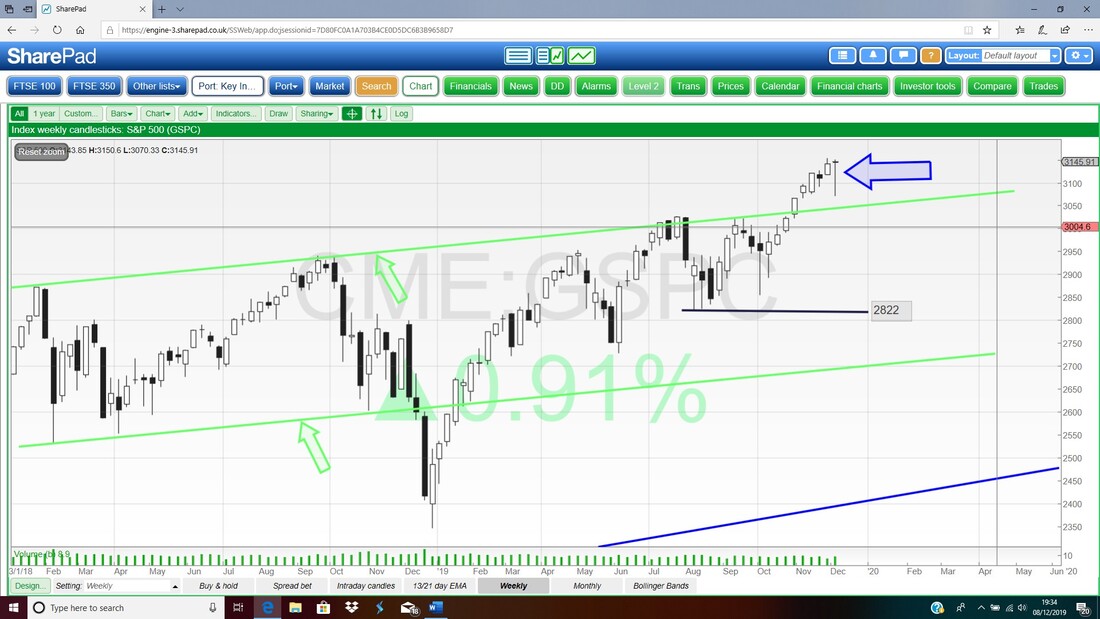
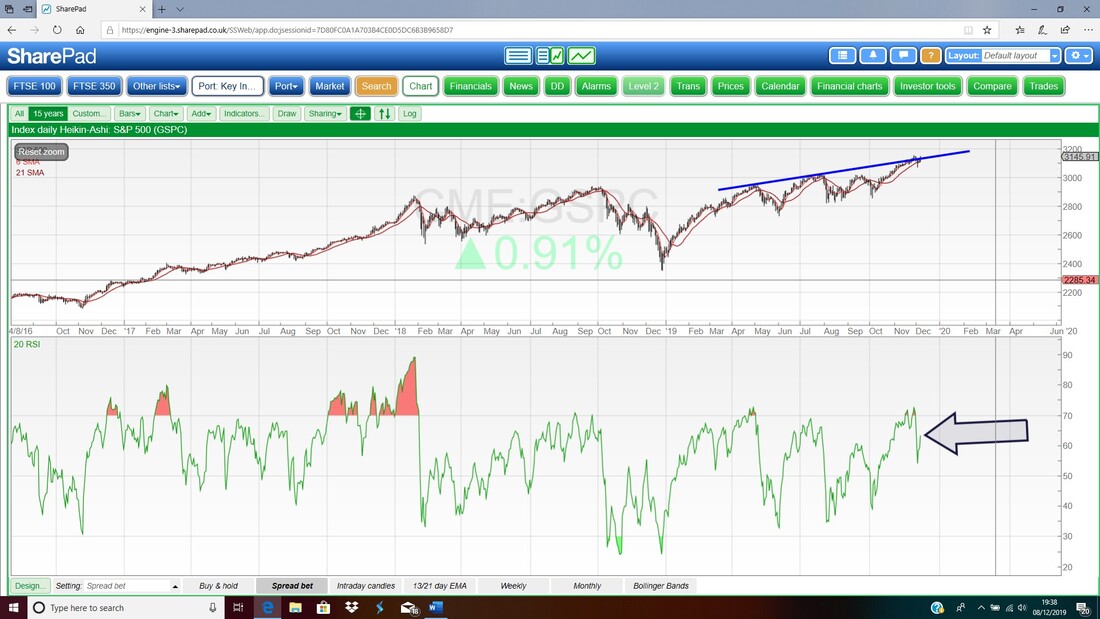
On the next screen, ignore the top window but in the bottom window we have the Relative Strength Index (RSI) for the S&P500 Daily. Where my Black Arrow is, on a Reading of RSI 63 this is not an extreme number and there is plenty of room to move up a bit.
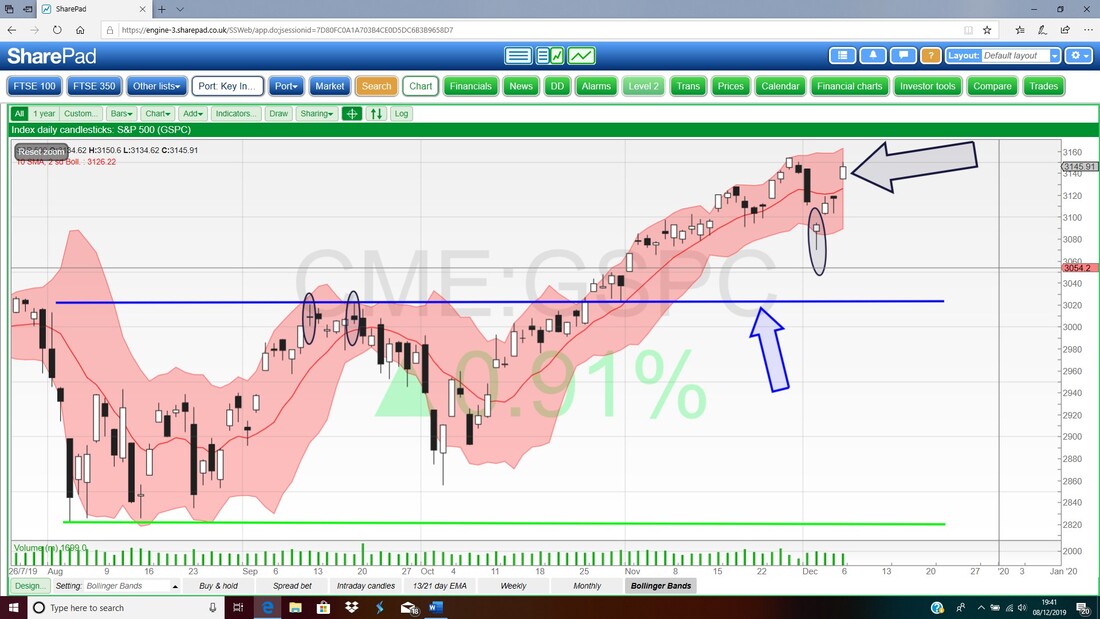
Now we have the Daily Candles with the Pink Zone marking the Upper and Lower Bollinger Bands. My Black Arrow is pointing to the Up Candle from Friday and note this ‘gapped up’ as well which shows some power. We are a way off the Top Bollinger Band and this leaves room for more upside. My Black Ellipse is highlighting a cracking example of a Hammer Candle and look how predictive this turned out to be with a nice jump up off of it. I went long the day after the Hammer (if you look at the ‘Trades’ page on my website then the details are on there). The Gap above the Hammer helped as well – usually a Market will want to ‘fill a Gap’ when they happen – although they can take a long time to fill.
The Nasdaq Comp and the Dow Jones Industrials Index are pretty much identical to the S&P500 so I won’t show them.
FTSE100 First off the Weekly Candles. My Blue Arrow is pointing to a sizeable Down Candle for last week but it did manage to Close up off the Low which was around 7131 and is clearly Support. Note we got this Down Candle off of a ‘Shooting Star’ sort of Candle from the week before (if you check back to last weekend’s blog you can see what I wrote about this) but the real story is that we are still chopping about in a Sideways Range. My Red Arrow is pointing to a messy attempt by me to draw a Curve which is suggesting that we could have a Bearish ‘Rolling Top’ pattern going on and as every week passes I am seeing little evidence that this Rolling Top is not playing out…….. 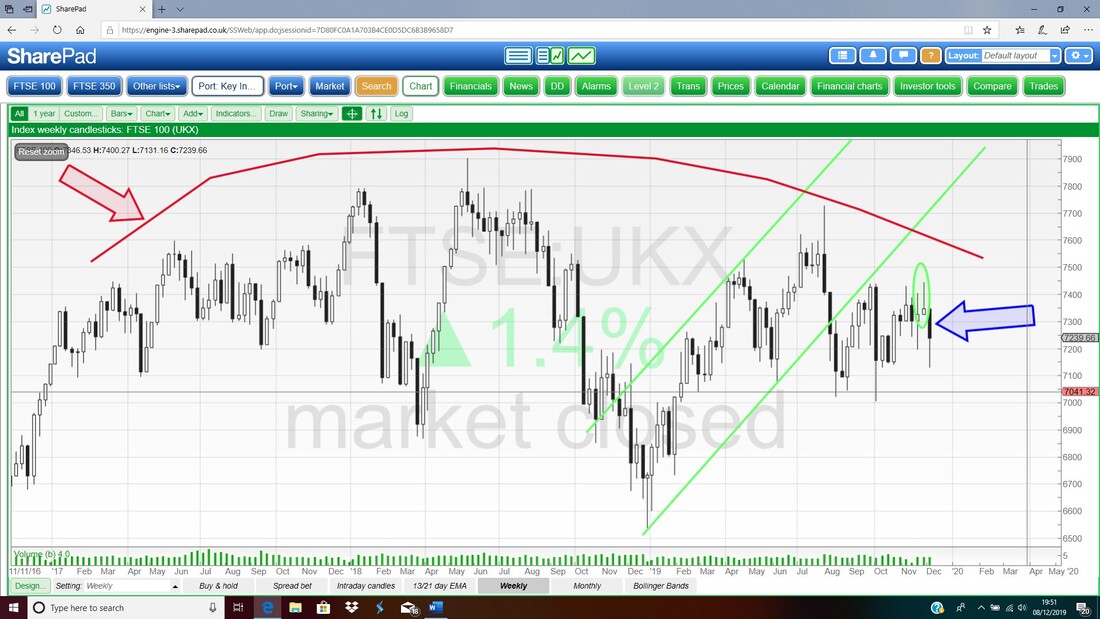
Next I am focused on the Exponential Moving Average (EMA) Lines and my Chart shows the Daily Candles with the Black Line being the ‘faster’ 13 Day EMA and the Red Line being the ‘slower’ 21 Day EMA. My Black Ellipse is an attempt to highlight a ‘Bear Cross’ where the 13 Day EMA dropped through the 21 Day EMA. This is usually bad news but to be fair the FTSE100 has been going sideways for quite a while now and when we get this sort off behaviour you often get Bear Crosses which are soon followed by Bull Crosses – you can see these on the Arrows I have in the diagram.
Having said that, at some point one of these Bull or Bear Crosses will be correct and we will see a move either Up or Down out of the Range…… 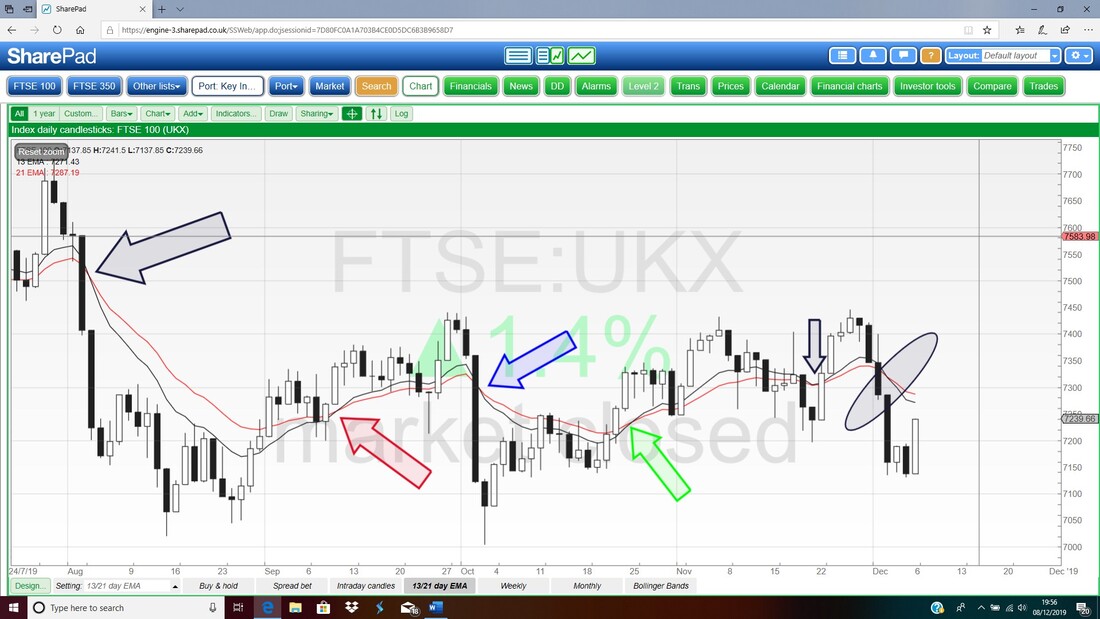
My chart below has the Daily Candles with the Pink Zone showing the Bollinger Bands. My Blue Arrow is pointing to a nice White Up Candle from Friday and this looks like a leader to more upside as the Price wiggles around in the wider Range which has my Black Line (Black Arrow) at the bottom at 7000 and my Green Line (Green Arrow) at 7450 at the top. Note how the Price Candles started moving away from the Bottom Bollinger Band a couple of days ago.
My Black Ellipse to the Top Left is highlighting a Zone of Resistance that could be a pain if the Price does manage to escape up out of the Range. Of course the Election later in the week will impact this Chart but at least we know how things stand at the moment. 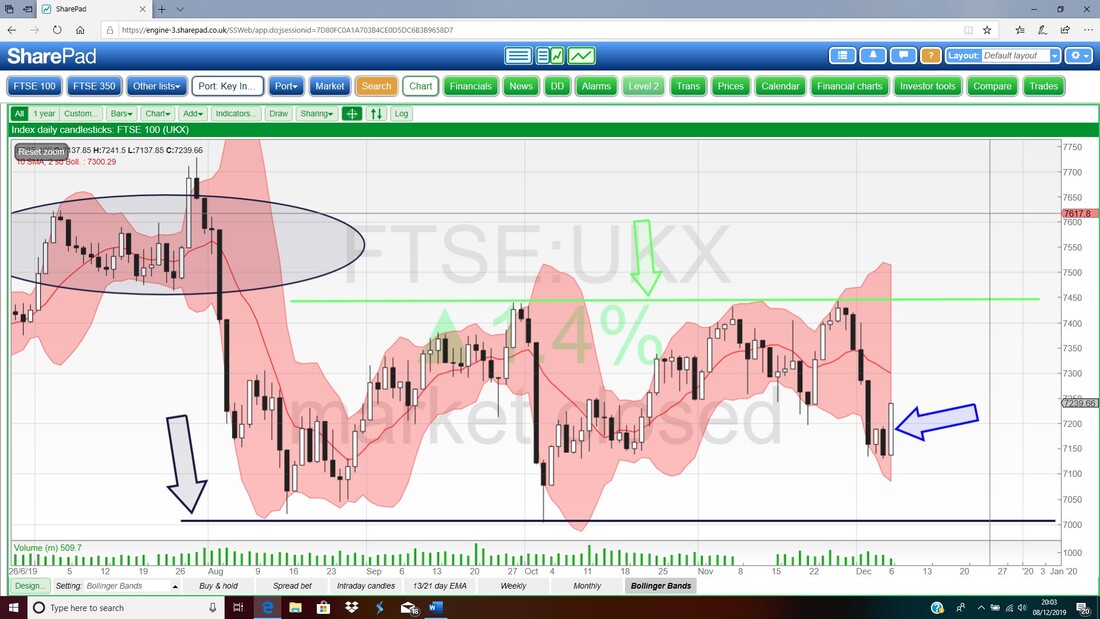
Devro DVO
I’ve done enough on the Index Charts quite speedily and it is still 50 minutes to ‘Guy Martin’s Great Escape’ on Channel 4 so I’ll lob a couple of Stock Charts in. First up DVO which is something I hold that has been really hard work for me. The Chart below which covers about 7 or 8 years says it all really with my Black Arrow pointing to a Long-Term Downtrend Resistance Line and this essentially tells me that we need a move over about 250p to be really sure a longer-term Recovery is taking place. A Breakout of that Black Line would be good news obviously. To the downside my Green Line (Green Arrow) must hold and vitally Support at about 140p from December 2016 must hold. It looks like we might get shorter-term moves up but there is a Range from around 150p to 220p – that is quite a bit of percentage upside though if Traders can capture it. You could draw a Shorter-term Downtrend Resistance Line from the Peak in about October 2017 and including the Peak from July 2019. However, even if it can escape that Downtrend Line, my Longer-term Black Line may limit further upside. 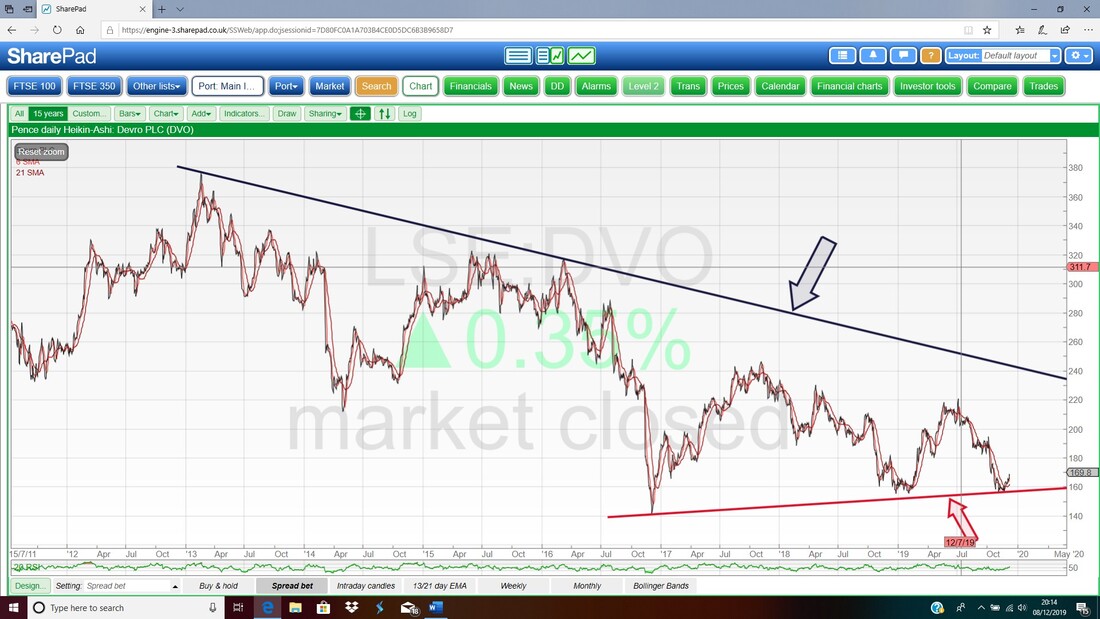
Next here is the ‘List Screen’ from SharePad and the Highlighted Blue Line is for DVO. These Stocks that are shown in the List are my actual Portfolio but of course only the top of it as that is all that fits on my Screen and it is DVO that I want to show you.
From this you can see that DVO is on a Forward P/E of 10.7 falling to 10.2 and a Forward Dividend Yield of 5.4% rising to 5.6%. DVO has had many trading issues recently which is why the Share have struggled so much but I am happy to hold for that Dividend. It has a fair bit of Debt but is very cash generative. If I did not hold, it is something I would be tracking and once they release better Trading news, there could be a nice Buy opportunity. 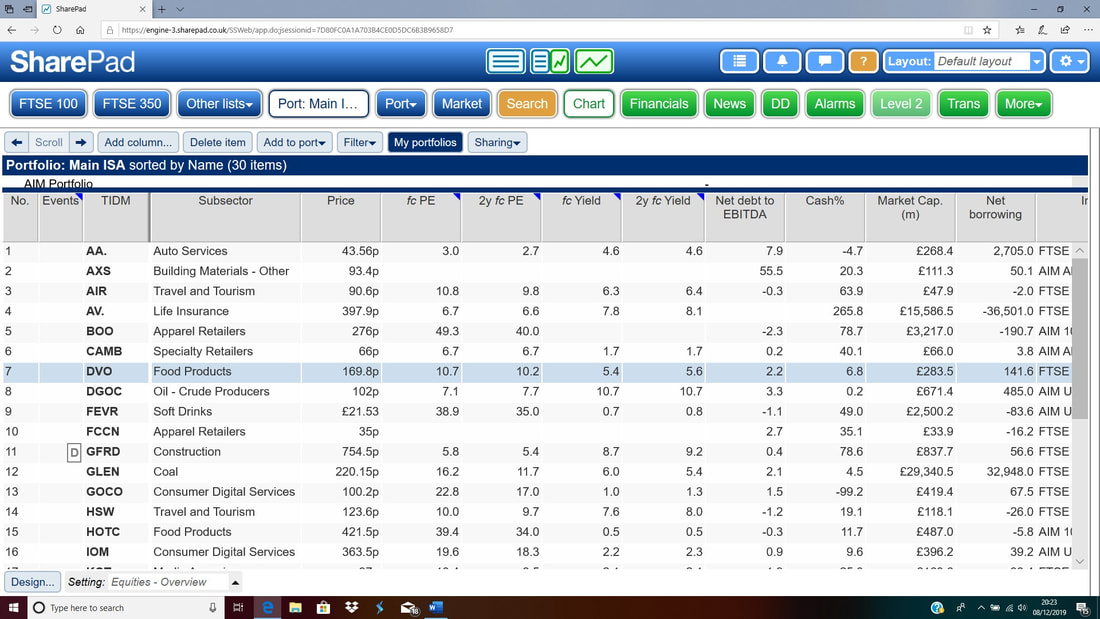
Iomart IOM
Below we have a long-term Chart for IOM, which I hold, and there are two Support Lines here – the Red one first off where my Red Arrow is and then the Black one down below marked by my Black Arrow. It is clear that the Red Line looks like a pretty good bottom line of an Uptrend Channel but if this fails, then the Black Line should provide good Support to help with a recovery. 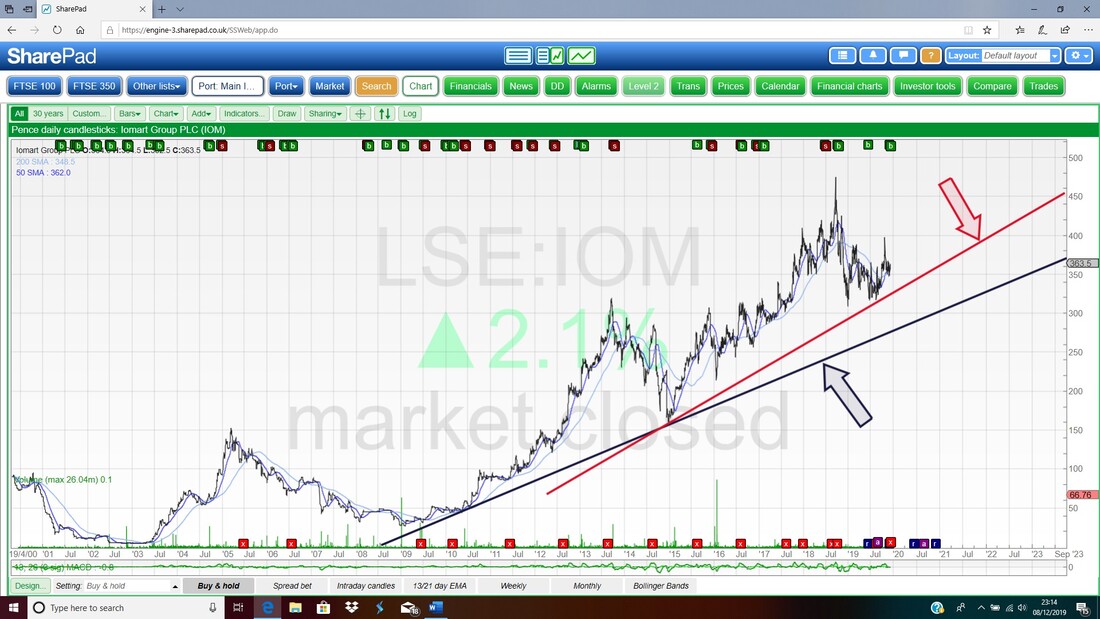
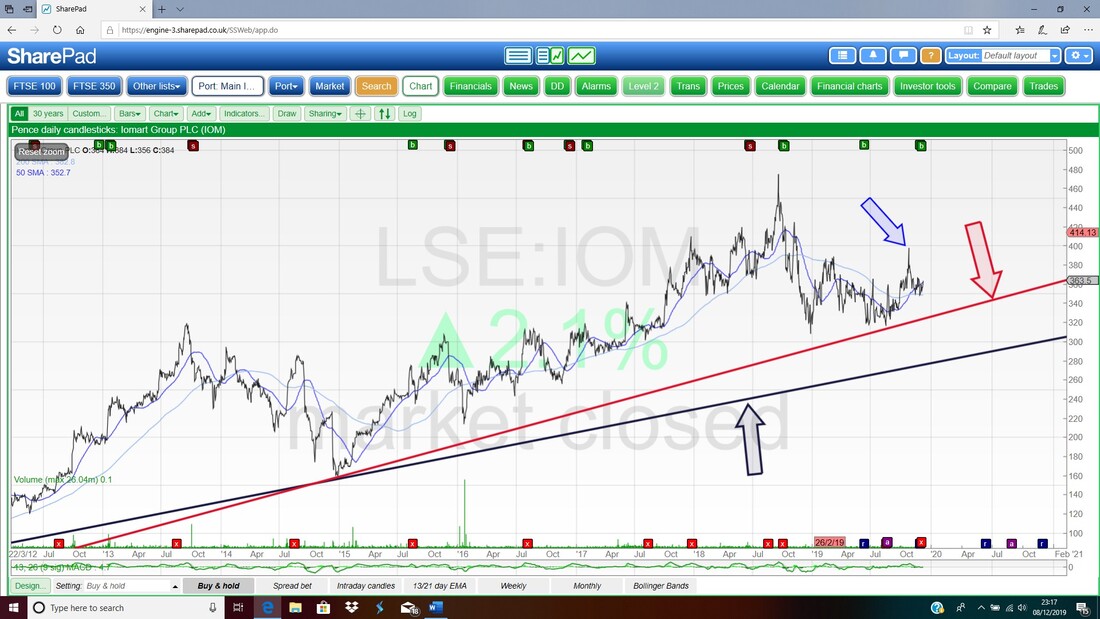
Next I have drilled in on the Chart above and now we are just looking at 6 years or so and the Uptrend is very clear. To the Upside we need to get above the 398p level (call it 400p !!) where my Blue Arrow is. If it cracks this, then it can probably move on to the All Time High at 475p given patience.
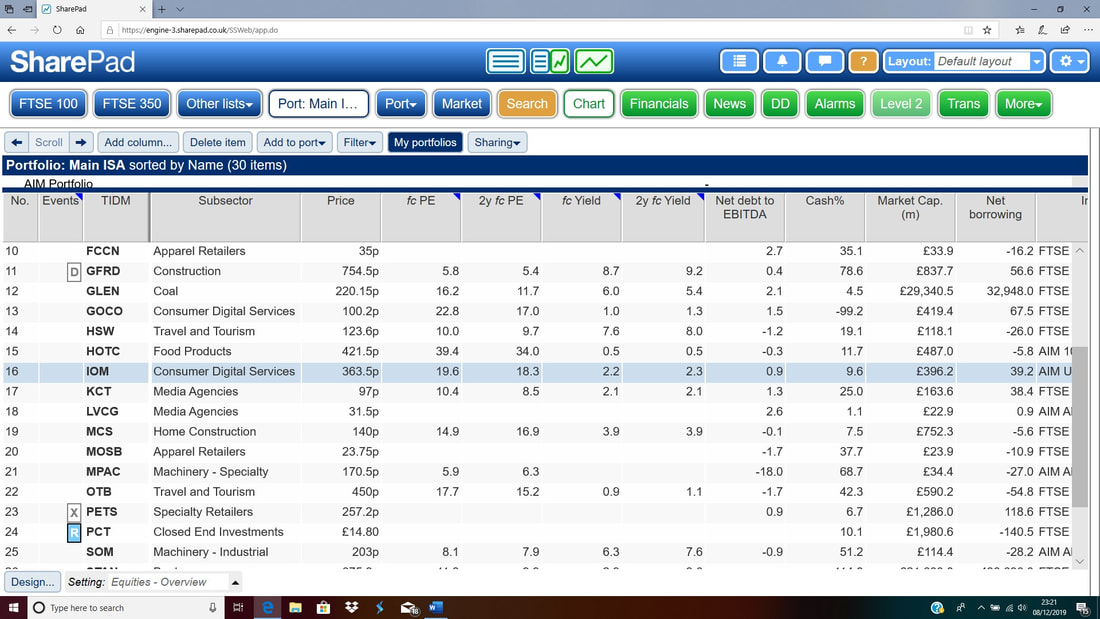
Finally here is the List Screen and the Blue Hazy bit highlights IOM in the List. On a forward P/E of 19.6 falling to 18.3, the value doesn’t look bad for a quality Tech Stock (they do Datacentres and Cloud Computing stuff) and there is also an expected Dividend Yield of 2.2% rising to 2.3%. The Balance Sheet is strong also and things could get interesting because IOM has been investing in its Sales Operation for a while now and we might start seeing the benefits come through in the numbers.
Avation AVAP
Starting off on this Plane Leasing Company that I hold, we have the Long-term Chart which shows a very sweet Uptrend Channel and as long as it stays above the Bottom Red Line, then we should see it go higher. In Number terms, a drop below 200p would be a bit of a worry but there is Support around 175p to 120p – although of course that would be a fair bit of downside to suffer. 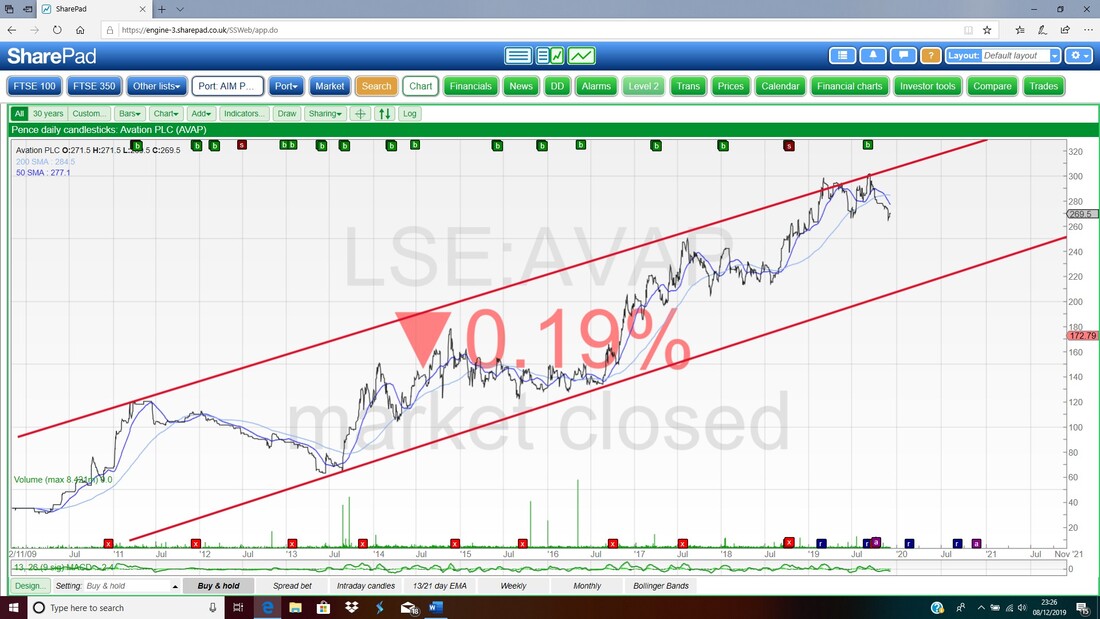
On the next Chart I have zoomed in on the one I showed above and the key thing here is the Blue Downtrend Line (marked by my Blue Arrow) that has been in play for a while now. If the Price can get through this and start rising, then that would be very welcome.
My Green Arrow is marking a very long Hammer Candle which was formed on the 21st November when an AGM Statement was released – but it looks like a huge over-reaction to me. Support was found at the bottom of the Hammer at 264p and this is now important Support that needs to hold in the short-term. 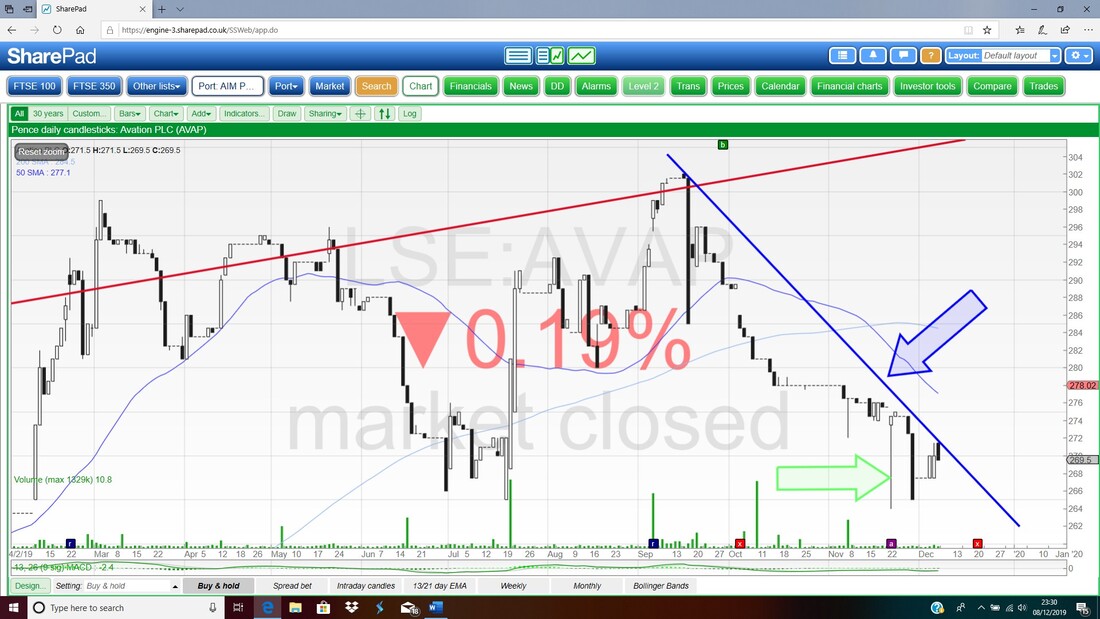
Finally we have the List Screen from SharePad and on this List the Blue Highlight is on AVAP and the thing I want to point out here is the Dividend Yield expected of 3.3% and rising to 3.6%. This isn’t a bad return and it has been growing nicely over time as AVAP have delivered.
The other important element here is that the Current Share Price is around 270p but the last Update I saw from Simon Thompson in the ‘Investors Chronicle’ had the Net Asset Value at something like 460p or a bit higher, so there does appear to be a chunk of value here still. I am very happy holding. OK, I need to get this uploaded as I have spent hours watching Guy Martin which was really good. Happy hunting next week !! Regards, WD. 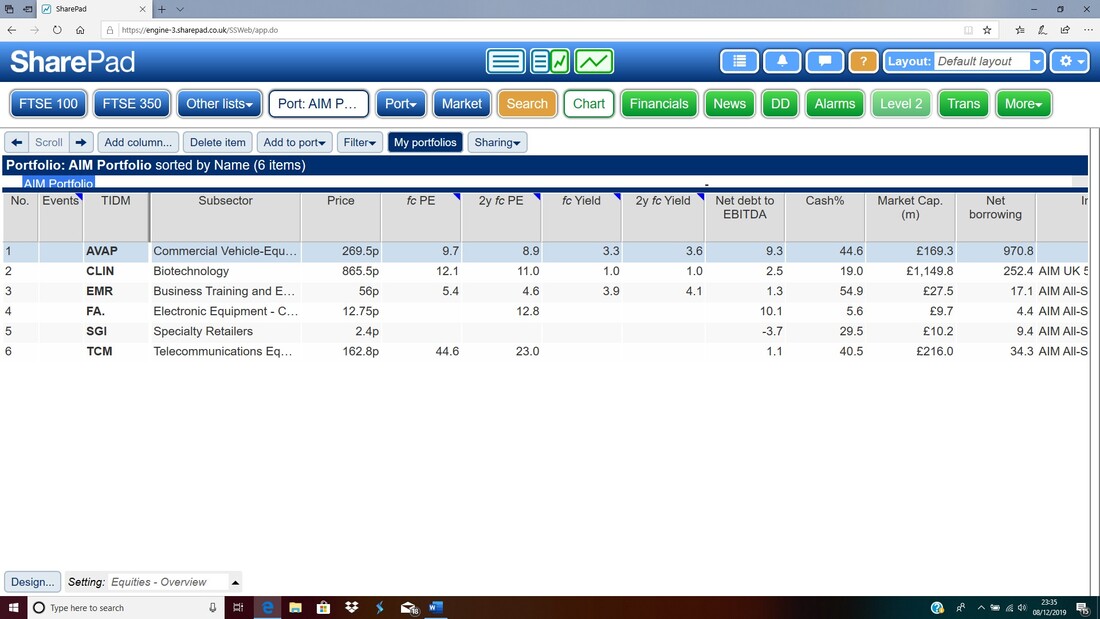
0 Comments
Leave a Reply. |

Stocks & Markets WheelieBlogsThese tend to be more Markets and Stocks related and timely - the Blog Page on the Main WheelieDealer Website has the 'Educational' stuff (well that's the theory anyway !!). Archives
October 2021
Categories
All
|
