

|
stocks & Markets blog |
|
I am really tight for time tonight after a full weekend of MotoGP with Practice, Qualifying and the Race, and I even managed to go round a mate’s house last night which was much more like the ‘old days’ rather than the ‘new normal’ (yuk).
Markets have been really dragging in recent weeks and the direction from here is really unclear. My hunch is that we will avoid a Big Drop but of course it is impossible to know at this point in time and with the fall back in the US Markets just looking like a fairly normal pullback, there is little evidence in the Charts that something nasty is just around the corner.
As ever I will look at a few Charts later in this blog, but really it seems to me that the move is sideways and frustrating rather than anything more serious. There are key levels on the FTSE100 like 6000 and 5900 which must hold but so far the Market is managing to find decent support every time it has deigned to drop back and test these levels.
The usual pattern is for the Autumn to be tough with a sell-off starting in late August quite often and with September being historically the worst month of the year – but that doesn’t mean that the Markets fall every September. My suspicion is that because we had such a nasty spanking back in March, we might avoid a big sell-off this Autumn – although it might still be a grind. The other factor is the US Presidential Election which could inject some fireworks of one sort or other. For now I am pretty much sat on my hands and not doing very much. With the backdrop economically so flippin’ awful and with Markets just grinding along, I cannot get enthused to increase my Long positioning and as it stands I am not getting clear Signals to go Short and hedge. If anything, my priority is on getting out and about and enjoying the remnants of Summer – especially after we lost most of the year stuck indoors on Lockdown. Last Week My Portfolio was down 0.6% last week which pretty much demonstrates the turgid and soggy nature of how the Markets are moving. This means my Portfolio is down 7% so far in 2020 which is a nuisance after I had managed to get it back to just over Breakeven at one point. I am sat on some decent Stocks and I think it is just a case of being patient and letting things play out, but with a keen eye on the Market downside risk and being ready to Hedge if I see a need to. Having been working on Part 2 of the Bango BGO Blog, I am very keen to add more to my position in this Stock – at the moment I don’t really have any spare cash in my ISA but if and when that situation changes, I will be grabbing more BGO if the Price is still at this kind of level. I see significant upside as my Blog will illustrate when it gets issued (probably late on Monday night). The Most Recent Podcast – TPI 27 You have probably figured out that we tend to release a Twin Petes Investing Podcast every 2 weeks and the last one was TPI 27 which you can listen to on Soundcloud at the Link below. Our plan is to record TPI 28 later this week so hopefully around next weekend you should be able to listen to a new one. As always you can also find us on the ‘Conkers Corner’ channel on Audioboom, Apple, Overcast and Spotify: https://soundcloud.com/user-479955511/conkers3-wheeliedealer-27-covid19-vaccine-hopes-azn-clin-ipf-vtu-auto-sfor-mpac-net Blog Slate As I mentioned a few paragraphs ago, I intend to release Part 2 of the Bango BGO Blogs on Monday night. It is nearly finished and I just need to do the Technical Analysis section which is usually pretty ‘easy’ to write and I need to go through all the ‘Valuation’ and ‘Target’ text to change any ‘Current Price’ Numbers to the correct ones at the Close on Monday afternoon. This is dead simple because I have already highlighted in Yellow the bits I need to amend. I then need to upload it to the Website which will take a bit of time because there are loads of Screenshots in it – but it should easily be something that will take 2 hours maximum. I have really enjoyed doing a ‘Buy Rationale’ Blog again but they do take quite a bit of time and of course I am much more motivated when I actually have Money invested in the Stock concerned and when I am thinking of buying more and the act of writing the Blog is an excellent, structured and disciplined way of organizing my Research and Analysis. I doubt I will write another one for a while but I might do one on a Stock I don’t hold if I am struggling to think of things to write !! On that subject, I have no shortage of various ideas for Blogs I want to scribble about and recently I have been taking a more ‘hands-on’ approach in ‘mentoring’ a few fairly new Investors/Traders and that in itself throws up a lot of new concepts. Having said that, I have no idea which topic I will attack next once the Bango one is out and about; but you can be pretty sure I will be writing away and putting stuff out as time goes by. If you haven’t seen it yet, then you can find Part 1 of my ‘Buy Rationale’ Blog for Bango BGO not far below this Blog you are reading now on the WD2 ‘Stocks & Markets’ Blog page. Digging in the Past It’s pretty obvious to me that a major failing many new ‘Investors’ have is that they confuse Price with Value. They claim to be Value Investors but in fact they are really Price Traders who are just trying to buy on a ‘low’ Price and they think this represents ‘Value’ – it doesn’t. Hopefully these Blogs from the Archives will help clarify the crucial difference: https://wheeliedealer.weebly.com/educational-blogs/price-vs-value-think-like-an-owner-part-2-of-2 As ever, all the Blogs I have written are listed on the ‘Blog Index List’ page on WD2 and there are Links to all the ‘Educational’ ones. Right, let’s see how concerning these Charts look !! Brent Oil All the Charts I show are Screenshots from the superb SharePad software that I use. If you click on the images they should get larger on your screen so you can see a bit more detail. My first Chart has the Daily Candlesticks for Brent Oil Composite and the first thing to notice is that the Price broke-out over my Blue Horizontal Line (marked by my Blue Arrow) from last weekend’s blog which was just above $44 and it got up to $45 where my Black Arrow is but both times it fell back during the Trading Day. Clearly Brent Oil Comp needs to breakout properly through $45 and Close above this level and if and when that happens, it sets up the next Resistance Level which is at about $48.50 and then we are not far from $50. To the downside there is good Support at $40. Despite the sideways grind that even Brent appears to be doing, Bulls on Oil can take heart from the ‘Bull Cross’ where my Green Arrow is between the Black 13 Day EMA (Exponential Moving Average) and the Red 21 Day EMA, which is still in force at the moment. 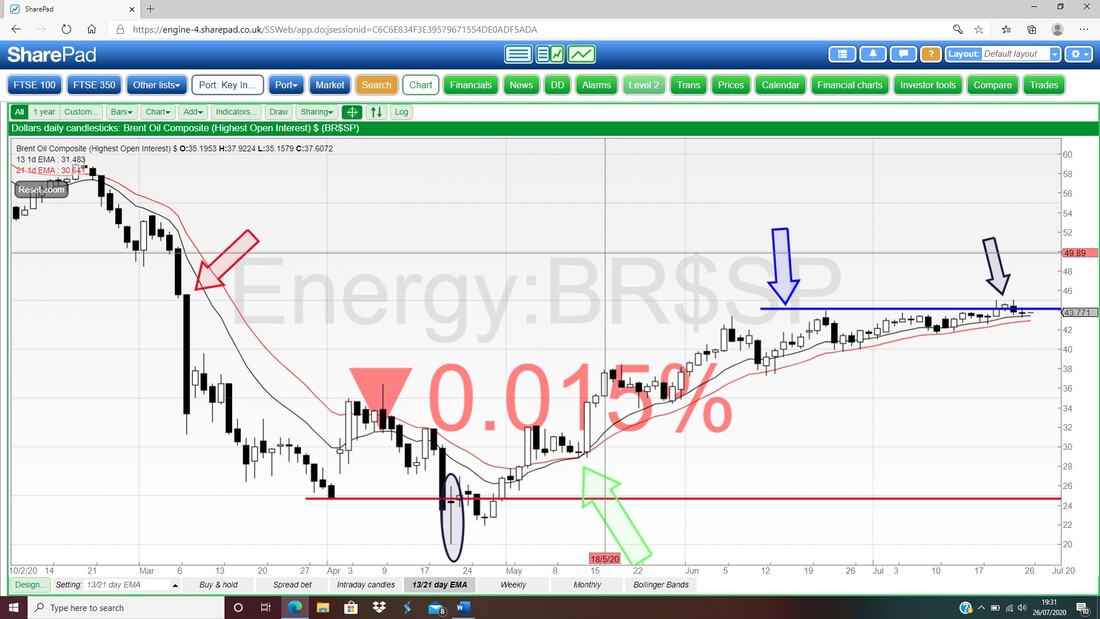
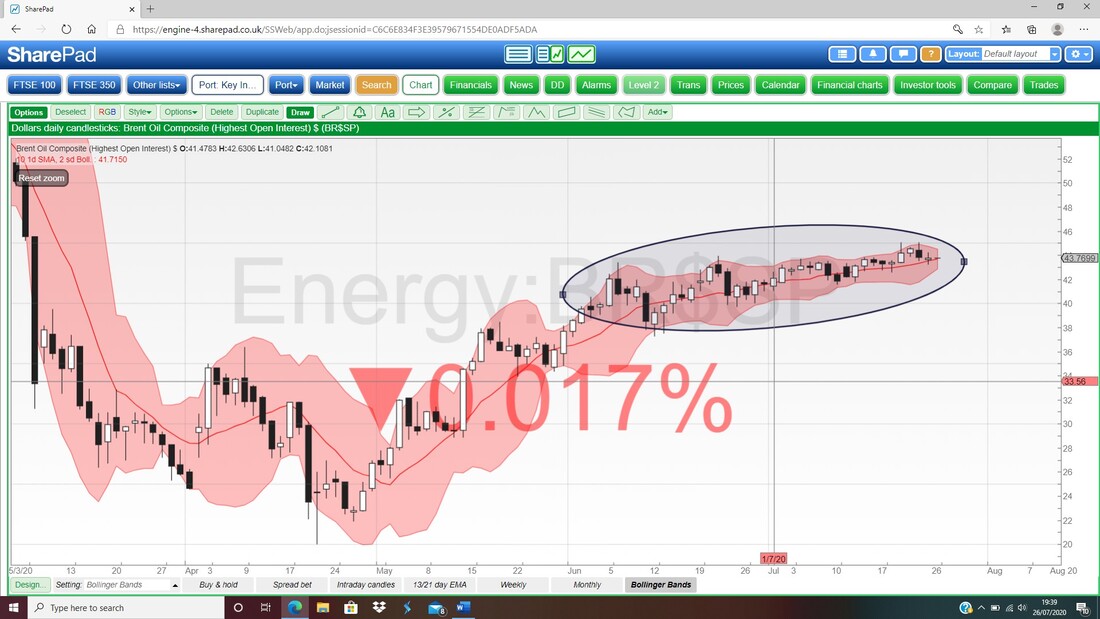
My next Chart has something quite intriguing. The Candles are Daily ones and the Pink Zone marks the Upper and Lower Bollinger Bands. Where my Black Ellipse is I am trying to capture the fact that the Bands are starting to squeeze together (this is no shock when you consider that the Price has been pretty much sideways for weeks) and usually when you get such tightening we see an explosive move one way or the other. Could be exciting soon then !!
S&P500
The Chart below shows precisely what I was saying at the start of this Blog about how the US Markets just look like a mere ease back in the context of the strong Uptrend. The Candles are Daily ones again and my Red Arrow shows that a ‘Bull Cross’ was put in on the 13 and 21 Day EMAs some time ago and this is still very much in force. My Blue Arrow is pointing to a tiny Doji Candle from Friday and the S&P500 found Support at 3200 and below that the Support looks good if we do see any more weakness in coming sessions. To the Upside, we are not a million miles from the All Time High from earlier in the year at 3393 and I see no reason why that Level won’t be taken out soon – I know, it does seem insane when you consider the state of the World but sometimes you need to shut your brain off to all that and just read what the Charts are telling you. If that ATH gets broken, then there is nothing to stop the S&P500 going higher…….. 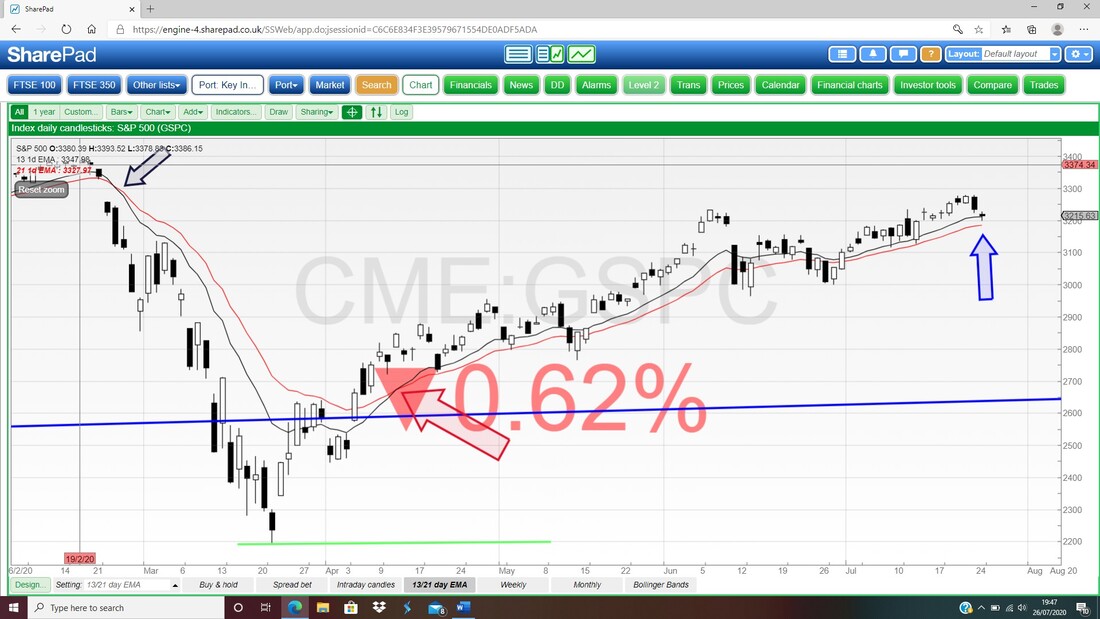
With the S&P500 looking pretty good really, I thought it would be important to see how the Daily RSI was looking and in the bottom window on the Screen below we have my Black Arrow pointing at an RSI of 59 which is not at all over-bought, although we might see it ease back a bit more.
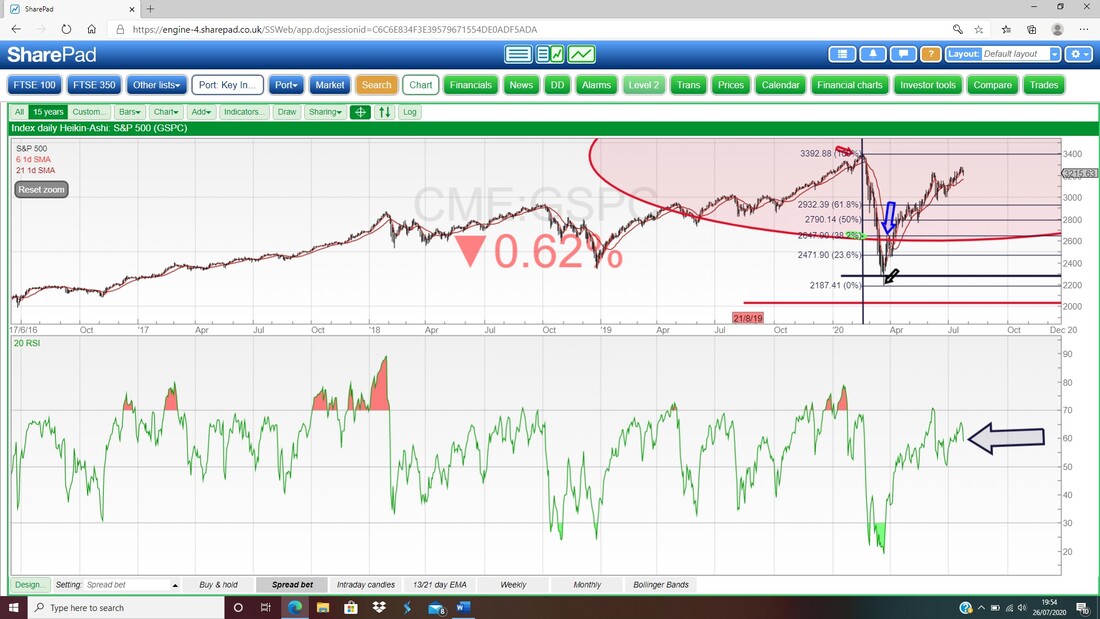
Next on the Weekly for the S&P500 there is a bit of negativity. My Blue Arrow is pointing to a ‘Bearish Shooting Star’ Candle for last week and this suggests more weakness ahead. I don’t think we should worry too much though – as I pointed out on the previous Chart, there is good Support not far below and with the Markets a bit sideways it might be nothing to make us fret.
The context is not great for a Bearish Shooting Start to be highly predictive – for such a scenario you would need more of a starting run up for several weeks before. 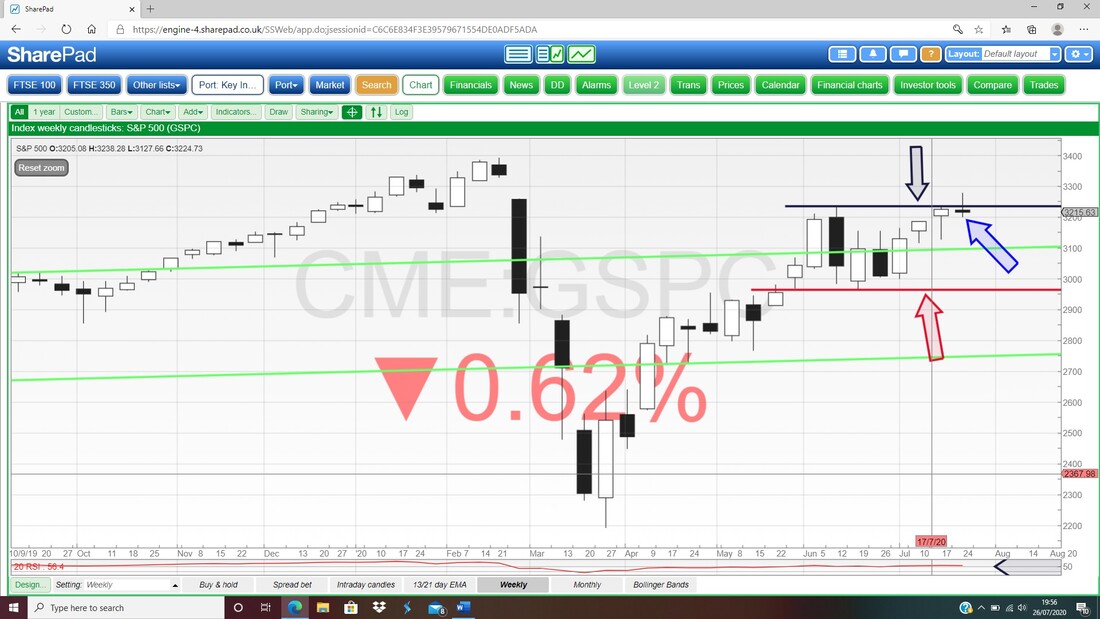
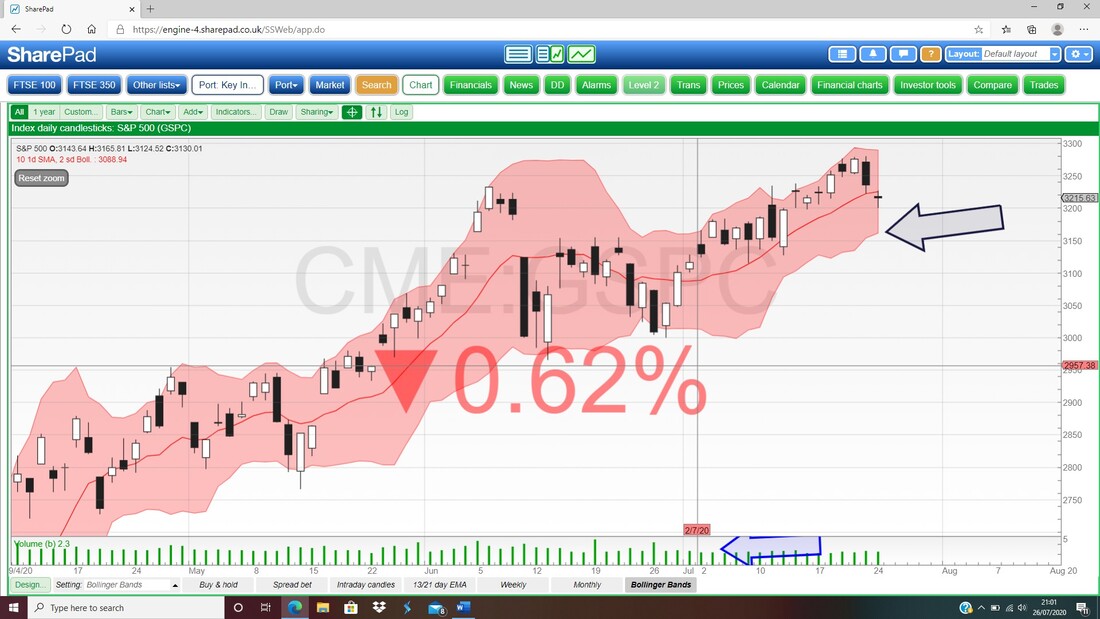
Last up for the S&P500 here are the Daily Candles with the Bollinger Bands marked by the Pink Zone. My Black Arrow is pointing to the lower Band at about 3160 and this could be support and the Red Midpoint Line capped the upside on Friday and this was at about 3226 which may continue to be Resistance in the short term.
FTSE100
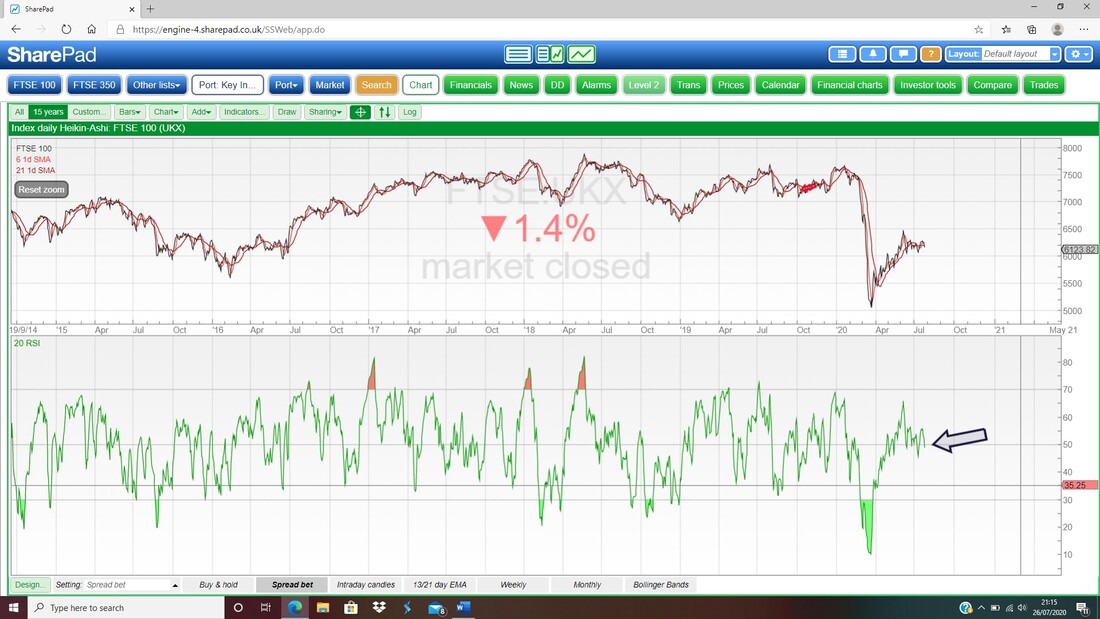
My Chart below has the Daily Candles for the FTSE100 and really this has been in a Sideways Range between about 6000 and 6342 for around 4 weeks or more. My Black Arrow is pointing to where we look to be getting a ‘Bear Cross’ between the Black 13 Day EMA and the Red 21 Day EMA, but until we get further confirmation that a big down move is coming, I think we need to assume this is just one of those rare situations where the 13/21 Day EMAs do not give a clear Signal and really the FTSE100 is just chopping about in that Sideways Range. My Blue Ellipse is capturing an important Candle from a couple of weeks ago where the 6000 Level was tested and held as good Support. My Green Arrow is pointing to where we found Support on Friday at 6100. If 6000 fails on an End of Day Close, then the next Support is 5952 and if that fails I will probably start to get more concerned and might put on a Hedge. To the upside we are looking at that 6342 Level and if it can crack that we then focus on 6512 – if that is beaten, then we open up as high as 6850 and more. 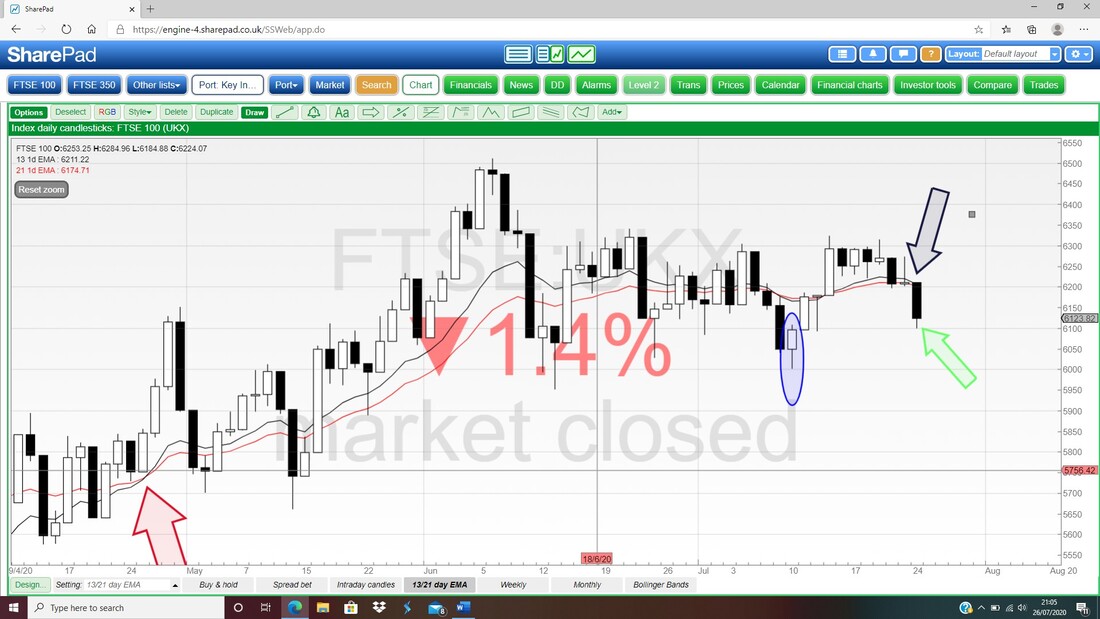
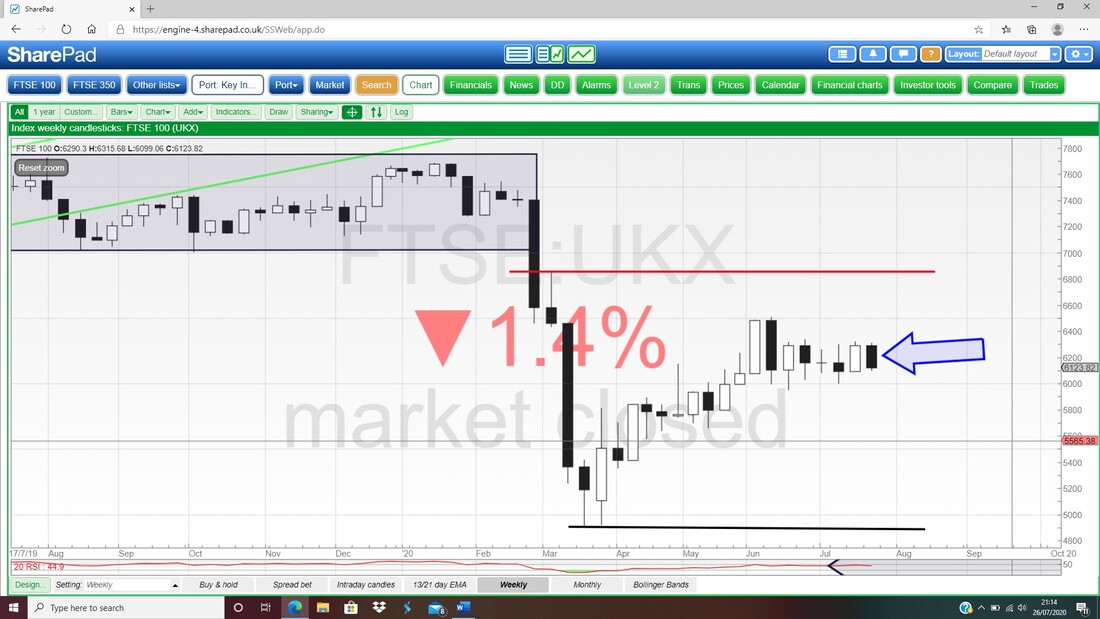
Next we have the Weekly Candles. My Blue Arrow is pointing to a big Down Candle from last week but in the context of the Sideways Range I doubt we need to worry too much about this. Just focus on those Support levels I mentioned above.
In the bottom window on the next screen we have the Daily RSI and my Black Arrow is pointing to a Reading of RSI 49. That is pretty much bang on Neutral and says that in the short term this is neither Overbought nor Oversold.
Finally for tonight I have thrown in the Chart of the Daily Candles with the Bollinger Bands for the FTSE100. My Black Ellipse is trying to show how the Sideways move of recent weeks has inevitably led to the Bollinger Bands tightening up and this again suggests an explosive move is on the way – but it could be Up or Down !!
Note how we Closed on Friday just above Support at the bottom Bollinger Band. OK, that’s it for this weekend. You might not have realised but pretty much every night around 10.30pm or so I am tweeting out about what I am seeing on the Index Charts and some Stocks occasionally, and if you do not follow me on Twitter then you can use the Twitter Feeds that are embedded on the Homepage of my Website and I think there is a page on WD2 with another embedded Feed. Anyway, good luck for the coming week and try to enjoy the Summer when you can !! Cheers, WD. 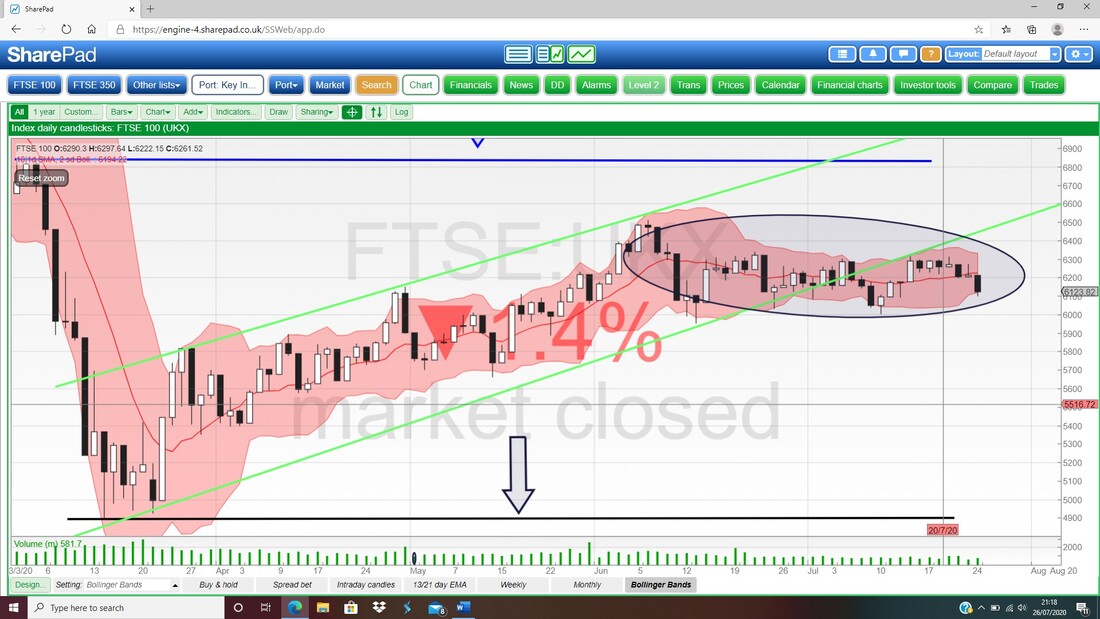
0 Comments
Leave a Reply. |

Stocks & Markets WheelieBlogsThese tend to be more Markets and Stocks related and timely - the Blog Page on the Main WheelieDealer Website has the 'Educational' stuff (well that's the theory anyway !!). Archives
October 2021
Categories
All
|
