

|
stocks & Markets blog |
|
Looks like we are in for a truly bonkers time with Politics next week and I suspect we will see full on warfare between the Remain MPs and the Government, egged on by the political connivance of Corbyn and his Stalinist buddies. Parliament reopens on Tuesday early in the afternoon and the Prorogation (suspension) of Parliament is due to start between September 9th and the 14th I think – I guess it is up to Boris to decide when he shuts the doors.
There are 3 Court Cases going on regarding the Suspension with one even involving John (“I prorogued Parliament to avoid Cash for Questions scandal”) Major which is utterly bizarre not just for his blatant and shameless hypocrisy but because we are being treated to the sight of a Former Tory Prime Minister in effect taking the current Tory Prime Minister to Court. Truly ‘Blue on Blue’ (or perhaps ‘Unfriendly Fire’).
I think these Court Cases are a sideshow though and of very little relevance. If Gina Miller or whoever succeeds then all it would mean is more time for Parliament to dick about and try to stop a ‘No Deal’ Brexit but however long they have it really comes down to the numbers. The last time that Parliament ‘took control of the Order Paper’ and passed a Law to force Theresa May to ask for an Extension, they only won by a single vote. This time the stakes are massively higher and it is extremely likely that many Labour MPs (remember a huge number of them from Northern Seats wrote to Corbyn a while back saying that the party should not let down Brexit Voters) will actually vote with Boris and this changes the numbers a lot.
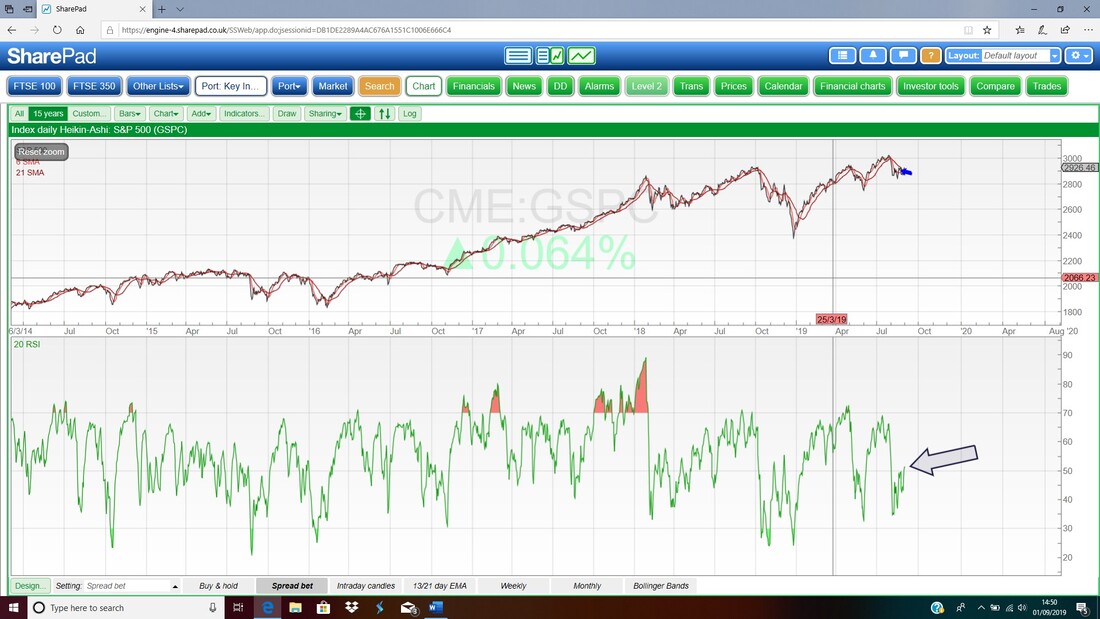
From memory last time the Labour MPs were whipped but now we are in a situation where the Brexit Party has changed the game and many Labour MPs are in a bind where they will lose their Seats if they do not allow Brexit to go ahead. This applies to Tory MPs as well and the reason why the Remain Faction is bleating so much about a “Constitutional outrage” is that they are trying to prise off Tory MPs from supporting Boris – I suspect they will have little success with this. There is even talk now of Tory MPs being deselected if they vote against the Government the Tory Whipping operation is going to be immense. If and when the Remain MPs fail to get their way on an Extension to Article 50, it is hard to see how they do not go down the route of a ‘No Confidence’ Vote but Corbyn has been quite wishy washy on this (no surprises there then) and of course they are still all arguing about whether or not they could accept Corbyn as the Interim PM (heaven help us). Anyway, again it strikes me that Boris would win a No Confidence Vote – the simple reason for this is that although the Media keeps saying the Government’s Majority (in combination with the DUP) is only 1 MP but this is not in fact true in practical terms. The truth is that there are many Independent MPs who will not vote for Corbyn and the upshot is that Labour would need something like 7 or more Tory MPs to vote against their own Party – this is extremely unlikely and the most I can discern is about 2. Anyway, apart from all the Political squabbling in Parliament we will also have the EU considering what to do about a ‘No Deal’ Brexit and the key date here is the upcoming Summit which is on the 17th October I think so we might have quite a wait until things become a bit more clearer (and over the weekend Micky Barnier has been saying that the Backstop can’t be removed although I am not convinced he is the final decider on such matters – however, a ‘No Deal’ Brexit seems ever more likely). It is not a huge stretch to realise that Markets are going to find life tough against such a backdrop and I can’t see Buyers being too eager to get their wallets out and buy Stocks. September is usually a very poor month and October has the potential to be rough – chuck in the Brexit balls up and the ingredients are rife for trouble before I even chuck in the issues which are apparent in the Global Economy and Trump’s Trade Wars etc. The US Markets are closed on Monday and then on Friday we have the US Non-Farm Payrolls numbers which come out at 1.30pm UK time and tend to cause some swings on Friday afternoon but I’m not sure they are all that relevant in the Bigger Picture. Collectively with lots of other Economic Information they might have some importance but one Napalm Number on its own is pretty ‘noisy’. Last Week Isn’t it just typical that after a really strong Week where my Portfolio gained 4%, it has to be followed by a pants Week where my Portfolio got hit to the tune of 2.5% - that’s just how it goes I guess. The damage was partly caused by my Index Shorts which suffered a bit but the fact is my Stocks were quite weak and that meant there was little or no ‘offset’ for the Hedges – it is not unusual and just something that happens and nothing to worry about. Vodafone VOD broke higher out of the Sideways Range it had been in and I pounced on Friday Morning to pick up some more for my Income Portfolio – it comes with a Forward Yield of 5.3% and I was keen to lock that in for my Dividend Stream. If you go to the ‘Trades’ page you can see this Buy and one I did a few weeks ago. Whilst I was in that Account I checked the Valuation and I am extremely pleased to report that it is up 9.7% on 2019 so far which is a strong result when you consider how little interest I take in it !! A lot of the performance comes from AstraZeneca AZN doing so well and of course I had the KCOM takeover recently as well which helped. The weakest one is Royal Mail Group RMG but the exposure there is tiny and it has little impact on the Portfolio overall. I noted igIndex IGG was also quite a relatively small position and last time I looked at it there was a Dividend Yield up near 8% yet this is backed by a mountain of Cash so it seems quite safe to me. I am not in a position or mood to buy more at the moment but as soon as I am in a situation to be buying I might add more IGG. Other than that, nothing has changed with regards to my Strategy and I am hugely Short on the FTSE100 and I have a small Short on the S&P500 and I wouldn’t mind shorting the S&P more if I get a Sell Signal but at the moment I am sitting tight. I can’t see myself buying much for a while although I must say I was very impressed with the recent news from Live Company Group LVCG and might be tempted to add a few more of those – but it is not something I will go into in a big way because it is very High Risk and of course there are some question marks around Corporate Governance which are a bit frustrating. It does looks cheap though……… And MPAC has Results later this week so I will be eager to see what they have to say. If the Outlook etc. is good then I suspect this one could gain ground as it is still extremely cheap. Recent TPI Podcast About a week ago, Peter @Conkers3 and meself recorded a TPI Podcast which covers a lot on how we see the Markets at the moment and in particular what levels on the FTSE100 etc. to look out for and obviously I go into this in the Charts bit later in this Blog. If you subscribe to the TPI Channel then SoundCloud will notify you when new Podcasts are released. You can find the latest Podcast here but I must warn you that the Sound quality is very poor when I am speaking which shows our experiments with using my new laptop have not worked as I had hoped. Anyway, I have now invested in a USB Microfone thing and I tested it today with Skype and it appears to be very good and I will test it with Conkers3 over the next few days. Anyway, it is still worth bearing with the sound issues as we cover a lot of stuff in the Podcast and feedback about the content has been very good. You can hear it here: https://soundcloud.com/user-479955511/conkers3-wheeliedealer-talk-about-the-rule-of-72-eto-gnk-bur-itv-azn-gsk-more Oh, if you are new to the Podcast thing then I recommend you listen to some of the ones we have recorded already because although part of them has a time-specific element, we have lots of general Investing Education type stuff in them so really they are quite evergreen (and the sound is generally far better because I used Skype via my fone when we recorded all of those). WheelieBash 7th September Incredible how fast the Summer has evaporated, and as a result at the time I am typing this we are less than a week away from the WheelieBash 2019 !! It looks like being the ‘Best ever’ with around 60 people coming and with luck we will get reasonable weather so we can get out and enjoy the superb Garden area like we managed to last year. There are still a couple of spaces available if anyone wants to come along and if you go to the ‘Events’ page on WD2 then you should be able to see details about the Bash. It is FREE to attend and a rare opportunity to mix with some of the best Investors and Traders in the country. And it will probably be a good laugh……. Blog Slate You won’t believe it but my hip is still playing up and as a result I have had to be on my sofa a lot recently and this has meant that I have made some excellent progress on building a long pipeline of Blog Drafts for future release on the Websites. It is very frustrating from the health point of view and every time I think the Pressure Sore is healed it seems to go ropey again. I sat up in my Wheelchair all day on Thursday and when I looked at the hip on Friday I decided that it could not take my weight and I got on the sofa again. I am typing this on Saturday night and when I looked at it this afternoon it was much better but I am thinking of keeping out of my Wheelchair quite a bit this week because obviously on Saturday at the Bash I will need to be fully fixed. It is doable but irritating. A couple of days ago I released the first of 2 Blogs about the dangers of panicking and ways we can avoid getting in such a state – with the current threats around the markets this seems highly appropriate and I intend to publish Part 2 later this Week. I also updated the ‘Little Black Book’ which sits on WD2 and has a list of Stock Ideas that need more research. It has been in my mind for a while that my Websites are a bit complicated and many people struggle to understand what is on them and how to navigate them. In order to address this, I have started work on a Blog which describes the structure of the Websites and covers what is on each one with Pictures and stuff. I made good progress on it last night but it needs several hours work yet before it is complete. Anyway, my current thinking is that I will issue it as a Blog but I will also add a Button or something on the Homepage so people can find it with a simple click. It is a bit like a ‘Site Map’ I guess and it might not help experienced WD Website sufferers but at least Newbies should be able to make more sense of things when they first discover my Website(s). I also have a couple of Guest Blogs that are being hammered into shape and these are likely to appear in coming weeks. Once I have the Site Map one done I will no doubt start on something else but I have not decided what as yet. The usual process is that once I have one completed something comes into my mind and I head off and write that – so anything could be produced !! (my natural default is to write about stuff that interests me or I fancy doing – whenever I try writing something my heart is not really in I find it a grind and very tedious – it probably doesn’t create the best material). We are at the end of August so I will need to update the ‘Weekly Performance’ page at some point soon – I have a busy week ahead so it might not be for a bit. On the whole I think August was ok for me so it will be interesting to do the ‘analysis’ bit and work out the numbers. Something Old, Something New. Something Borrowed, Something Blue No, I am not getting married, but this continues the Blue theme !! BooHoo BOO has been doing nicely of late both in terms of the Share Price and in terms of the progress within the business. It seems somewhat appropriate to chuck this one in. This week I bring you this old ‘beauty’ from the Archives: http://wheeliedealer.weebly.com/educational-blogs/a-simple-framework-to-model-growth-featuring-boo OK, it’s time for the Charts…… S&P500 As ever the Charts I show are ScreenGrabs from SharePad which I use every day as a key element of how I do stuff (note, every evening during the Week I tend to issue a series of Tweets which summarise what I am seeing on the Index Charts – if you are not seeing these you might find them useful. They usually appear after 10pm). If you click on them then they should grow a bit bigger so you can see more detail. . I would like to show more Charts but it is much easier for me to do this using my ‘Big screen’ so it means I have to sit in my Wheelchair and with my on-going hip problems I don’t want to do this for too long. I tried doing the Charts on the laptop and it was a lot harder and more time consuming so I prefer to crack on and I will just focus on the S&P500 and the FTSE100 because they are of more importance for me because I have Short positions on them. I just want to quickly refresh on ‘The Big Picture’ and my Chart below goes back to the 2009 Lows and my Blue Line (marked by the Blue Arrow) shows the long-term Uptrend Support Line and this is very important obviously because it this breaks to the downside, then that tells us there is big trouble. At the moment we are nicely above this and arguably Bulls don’t have much to worry about but of course at some point in time that Bull Uptrend will end and being complacent is foolish. The important Support Levels that we must stay above are really around 2500 and the critical one is 2346. If the latter one goes then it is really gonna get ugly. 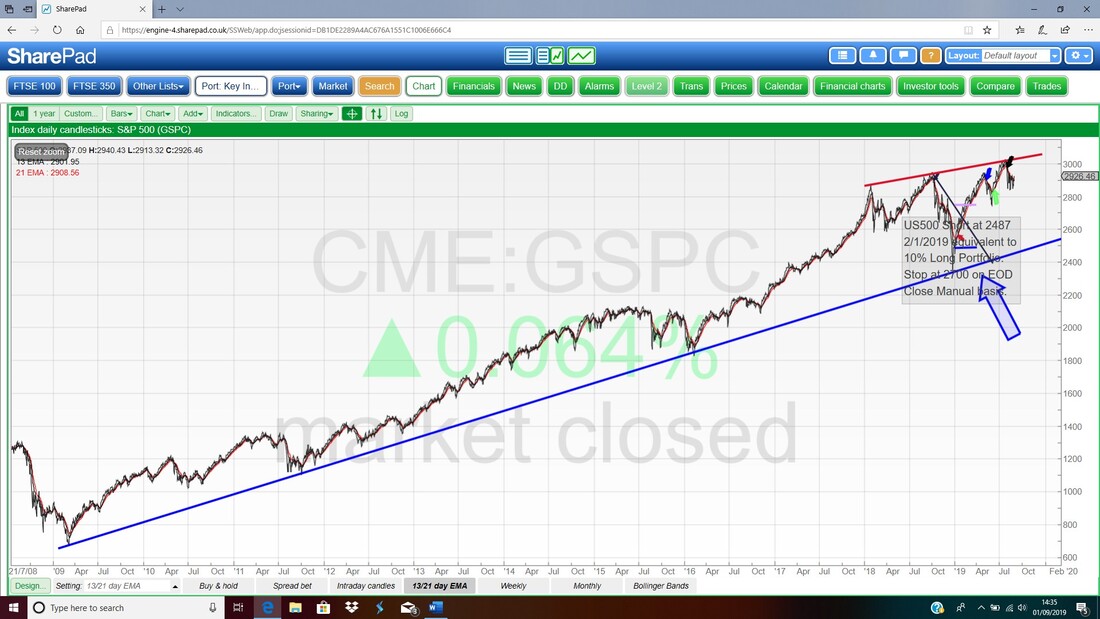
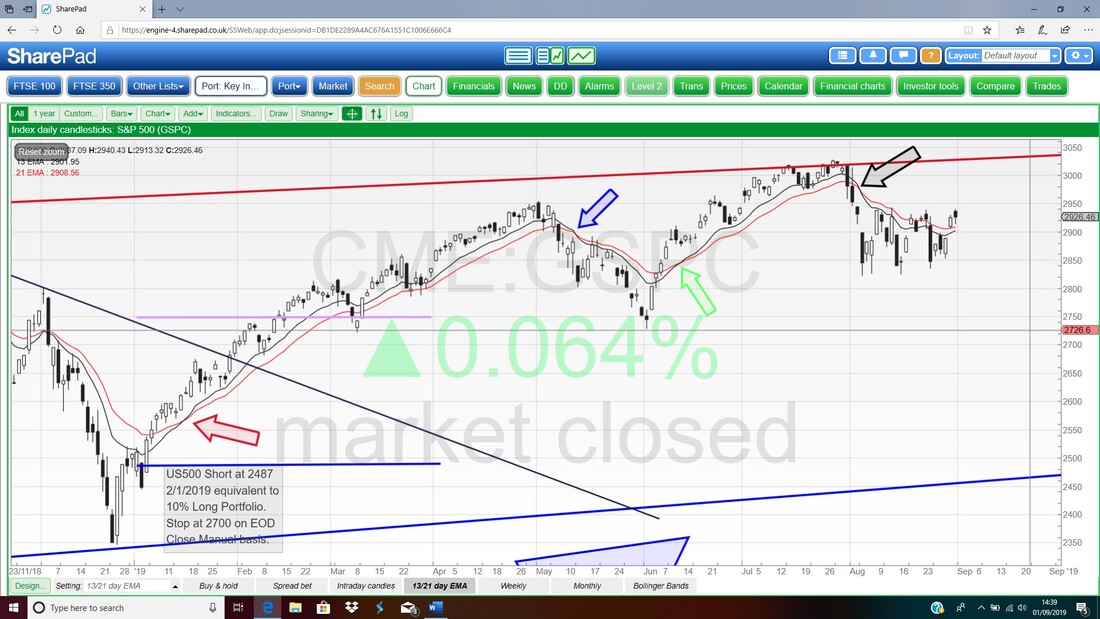
Next up it is one of my favourite Indicators with the 13 and 21 Day Exponential Moving Average Lines (EMA). Where my Black Arrow is you should be able to see that we had a Bear Cross and that is not good until we get a Bull Cross in the other direction like the one we had where my Green Arrow is. Note that the Lines are converging together at the moment so it is possible that a Bull Cross happens in the next few days – something to watch for.
Next we have the Weekly Candles – it is always good practice to look at longer time periods first before digging down to the Daily Candlesticks and the shorter-term Indicators – this is because the shorter-term stuff can wiggle around but inside the longer-term Indicators, Signals and Trends. The Longer factors dominate over the shorter ones.
On my Chart below the Blue Arrow is pointing to a nice Up Candle from last Week and this is Bullish in itself but in the context of the Chart it could just be wiggling around and note how the Candles from each of the last 4 Weeks have their Highs around the same Levels – roughly 2950. Clearly the S&P500 needs to get over that Level to make meaningful progress. Something to note is how the DOW and the German DAX Index have managed to Break-out above the Top of their similar Sideways Ranges – this is interesting because there is inconsistency here and either the DOW is pointing to the future or the DOW has ‘overshot’ and given a False Breakout and in fact the S&P500 is correct. Note also that the Nasdaq Composite Index is following what the S&P500 is saying and of course the DOW has only 30 utterly massive constituents so perhaps it is more likely to be ‘wrong’. The DAX also only has 30 Stocks in it. 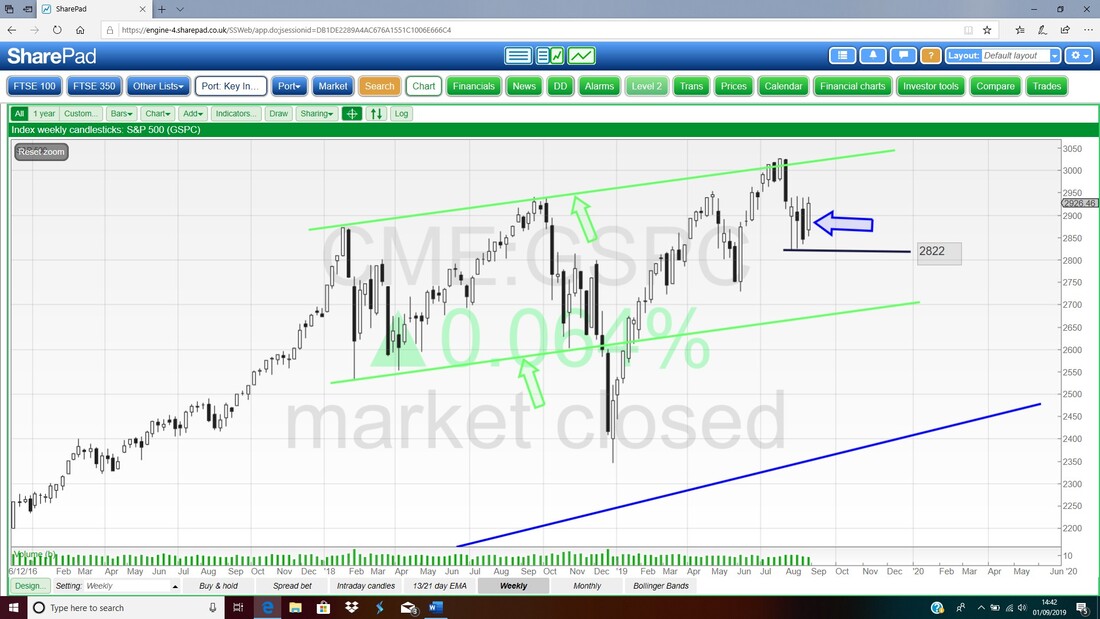
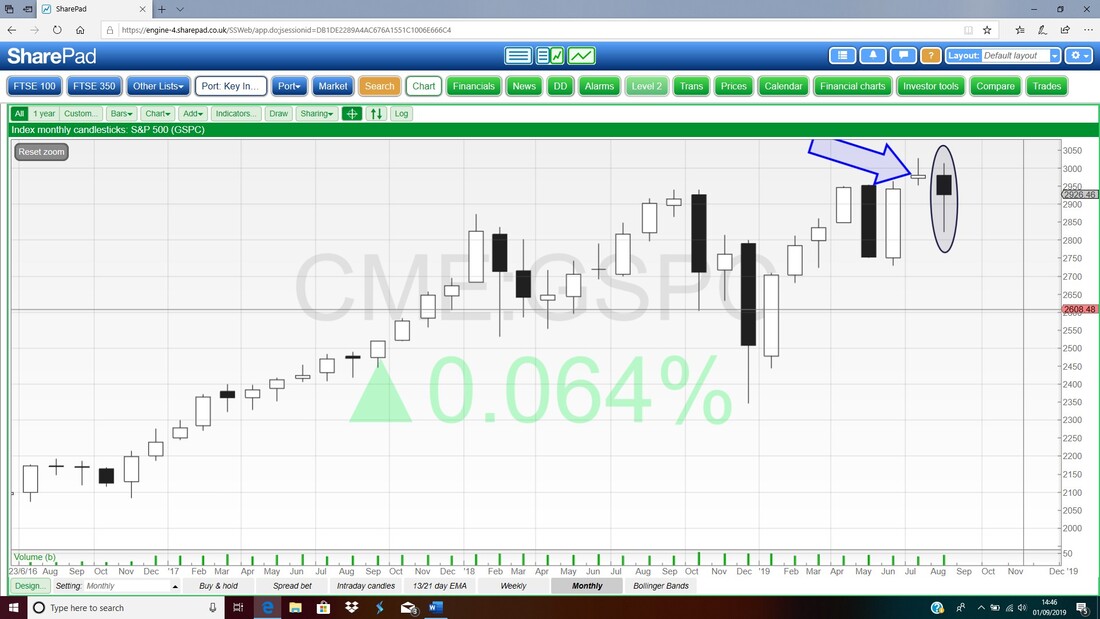
Moving out to the Monthly Candles now that August is complete and remembering that this will dominate over the Weekly – my Ellipse is capturing a Down Candle from last Month but note how it Closed up off the Low of the Month. That is a bit of hope for Bulls but if you look at the Month before (July obviously where my Blue Arrow is) then that looks like a ‘Shooting Star’ Bearish Reversal Candle and I think it could be a Turning Point from which the S&P500 drops – we shall see but remember September has a very poor history.
In the bottom window below we have the Relative Strength Index for the S&P500 Daily and on a Reading of RSI 52 this is around the Neutral level (so it is neither Overbought nor Oversold) and it is rising. This doesn’t tell us much but if the S&P500 wanted to rise more then the RSI is not contradicting this possibility.
I have incorporated a few things on this next Chart to save time. Here we have the Daily Candlesticks for the S&P500 and the Pink Zone marks the Upper and Lower Bollinger Bands. At the moment, where my Black Arrow is pointing, we are near the Upper Band but there is still ‘room’ to move up to it. Note however that the Candle from Friday is a Black Down Candle and shows that the S&P500 was unable to hold its High of the day (coming into a Holiday Weekend with the US Markets shut on Monday it is not all that surprising).
The key here are those Parallel Horizontal Lines. The Blue one is at about 2943 and that is Key Resistance now which must be broken over. If the S&P500 can Close above 2943 that would suggest Bulls are still winning here and it could go back up to the All Time High. If Bears win and it drops out of the Green Support Line at about 2822 then expect more grief. 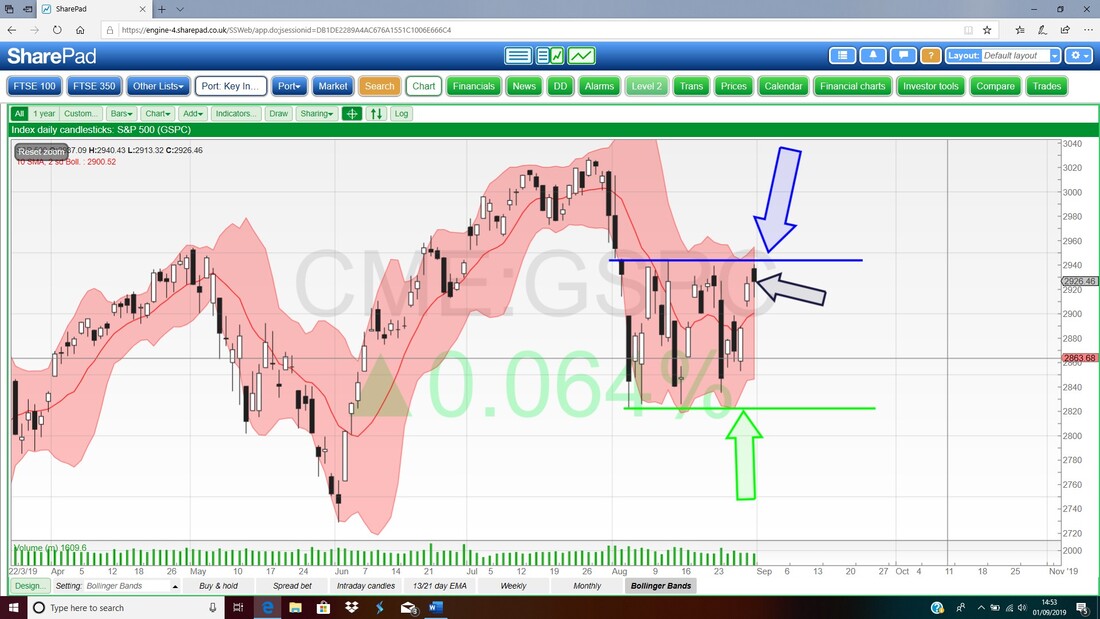
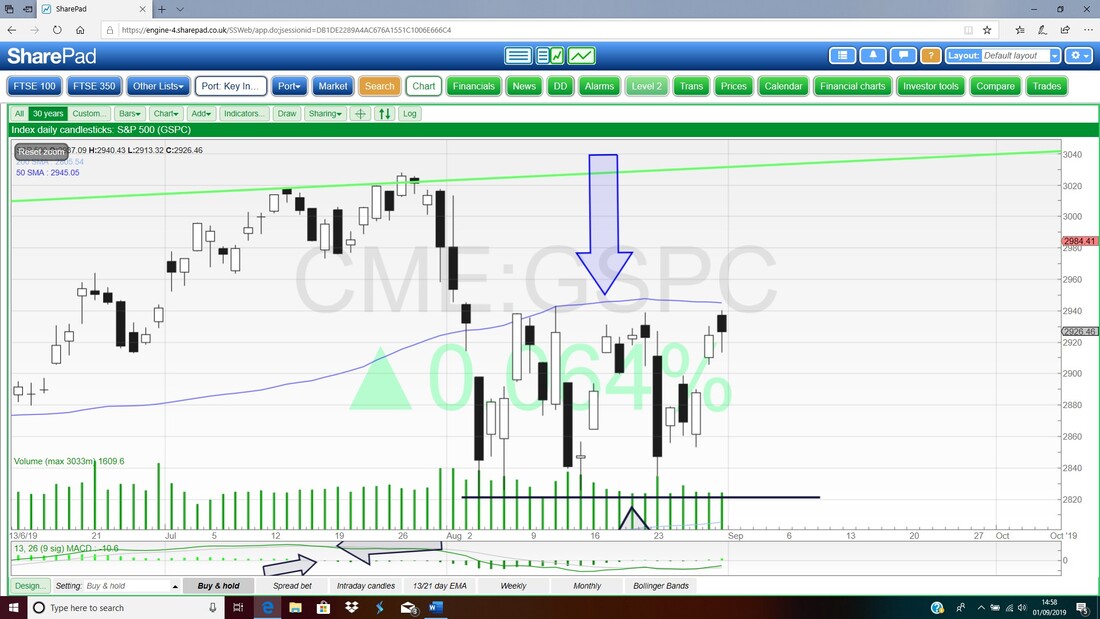
I was about to move on to the FTSE100 but at the last moment I noticed this and it is worth noting. On the Screen below we have the Daily Candles for the S&P500 and I have zoomed in a lot but the key thing is that Blue Line marked by my Blue Arrow which is the 50 Day Moving Average – note how that is acting as Resistance at the moment.
FTSE100
First up the Monthly Candles. My Ellipse is capturing a Big Down Candle for August and this comes off a Candle for July (Blue Arrow) which failed to hold its High although it wasn’t a very good Bearish Reversal Candle in the textbook sense. Anyway, this looks Bearish although the FTSE100 did managed to Close up off the Low of the Month. 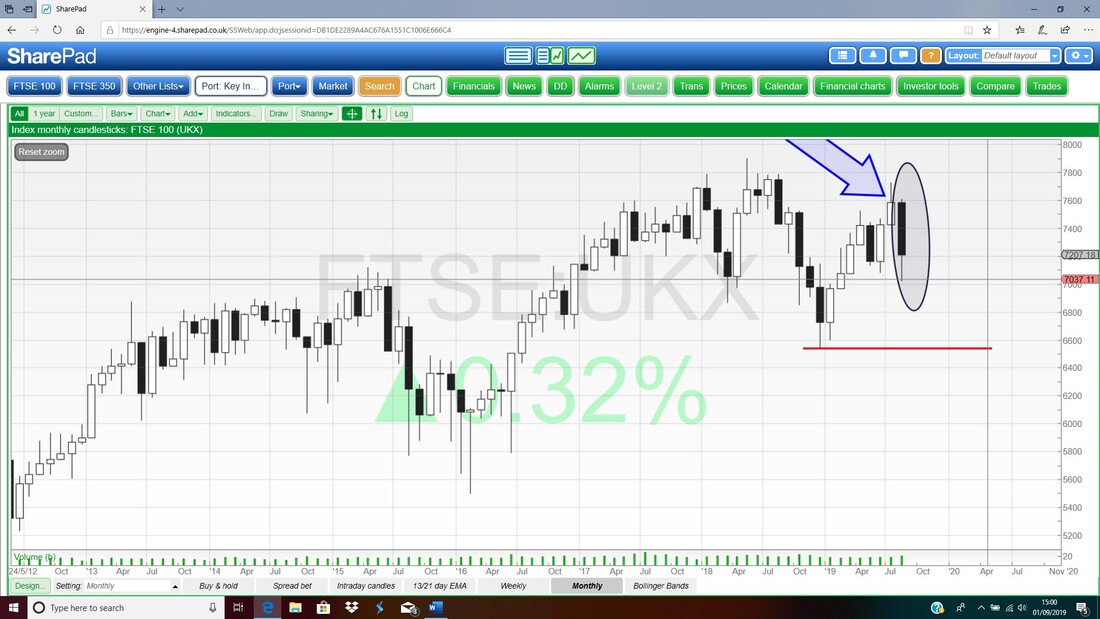
Next up the Weekly. My Red Arrow is pointing to a Big White Up Candle and this comes off an unusual ‘Inverted Hammer’ which is looking like a Bullish Turning Point. However, it is not impossible for us to rally a bit and then for the rally to fizzle out so we could have an interesting Week (and of course with the political trauma we are likely to have this Week it has plenty of reasons to misbehave).
7020 is the Crucial Support Level here and if that Breaks then I expect we will quickly see 7000 and a drop towards 6900 etc. is highly likely. 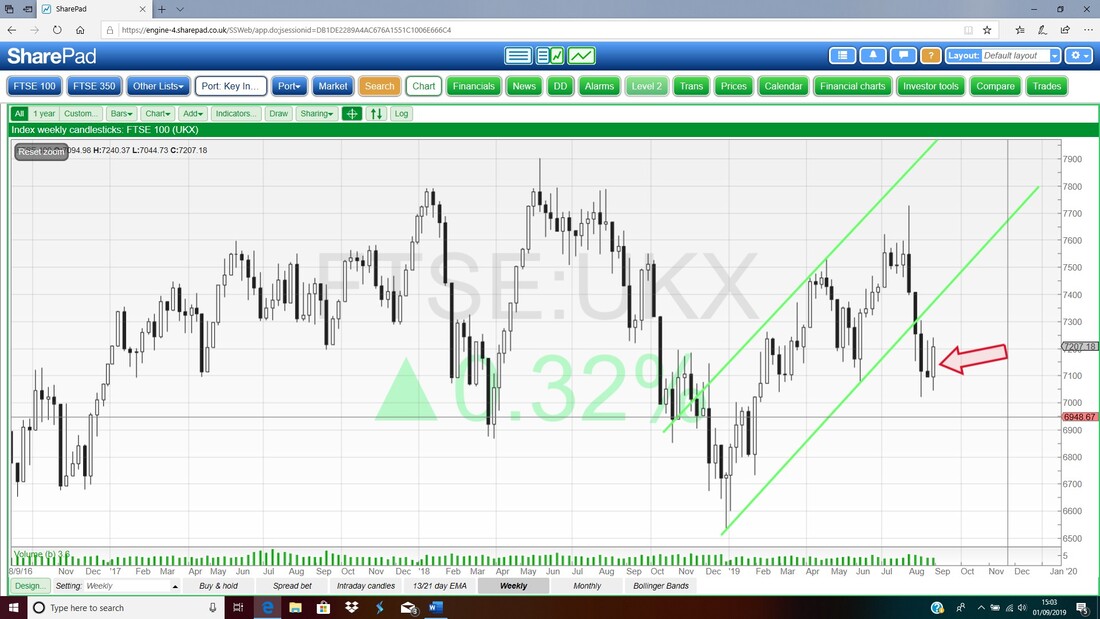
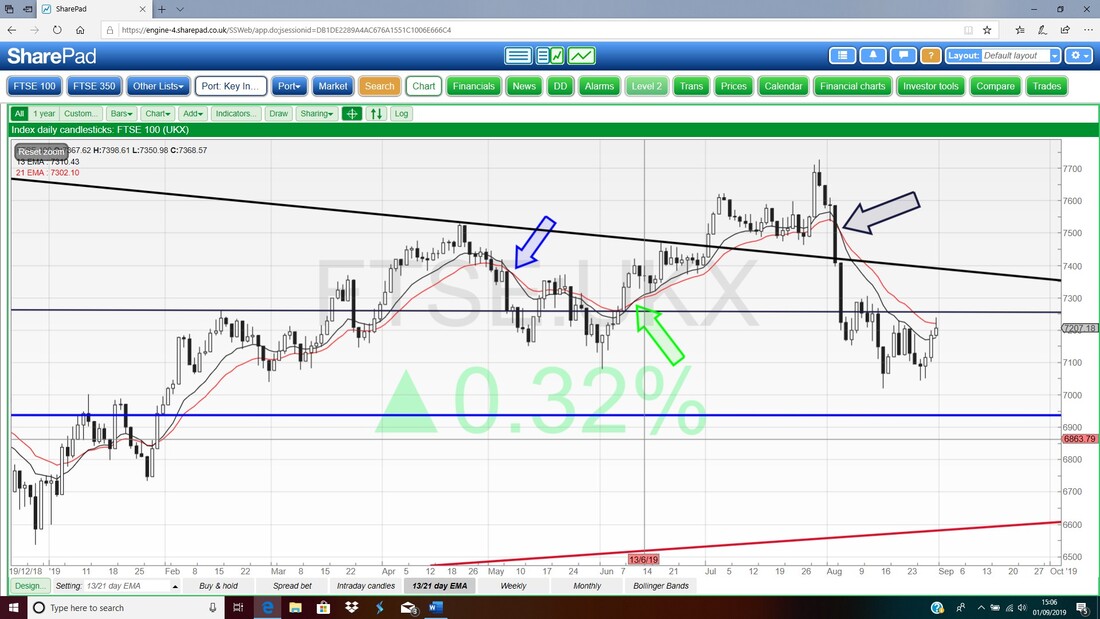
Below we have the Daily Candles with the 13 and 21 Day EMA Lines being shown as well and it is them what I am interested in here. My Black Arrow is pointing to a Bear Cross and that is still ‘in force’. The 13 and 21 Day EMAs have started to converge a little but at the moment it is just wobbling about. We would need a few good Up Days to get a Bull Cross here.
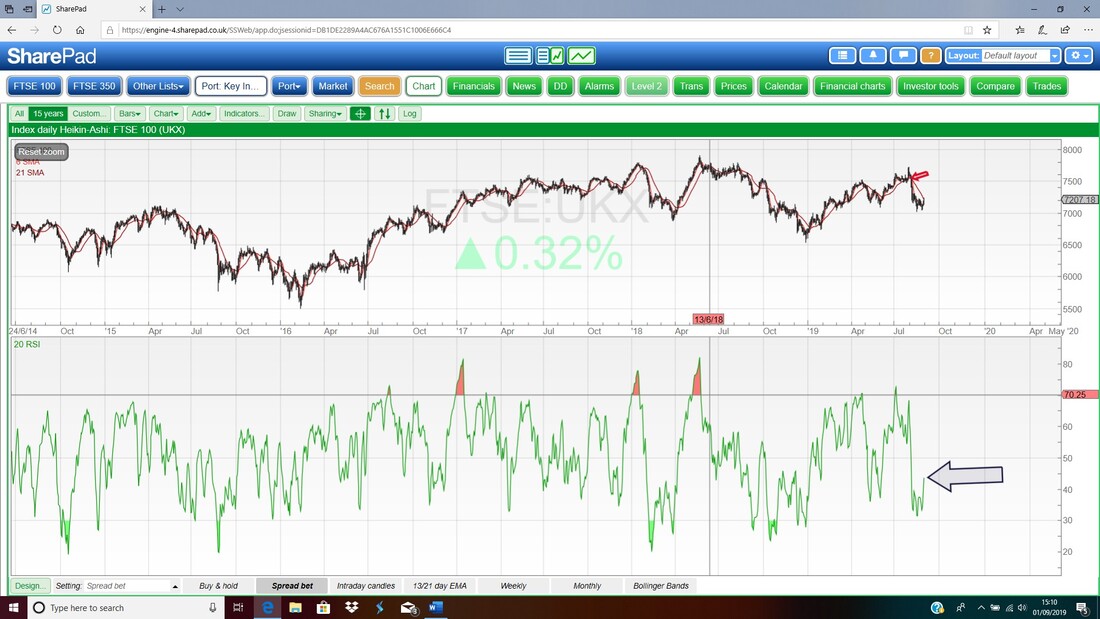
Next look at the bottom window on the Screen below where we have the RSI for the FTSE100 Daily. Where my Black Arrow is we have a Reading of RSI 44 and this is rising but approaching neutral. It doesn’t tell us much and really the FTSE100 is not constrained by this Indicator at the moment.
Like on the S&P500 I will cover a lot on this next Chart. Here we have the Daily Candles for the FTSE100 with the Bollinger Bands and note how on Friday where my Blue Arrow is we had a ‘Shooting Star’ sort of Candle which has bearish overtones especially because it fell away from testing the Upper Bollinger Band.
Again the FTSE100 looks to be stuck in a Sideways Range really with the top at around 7250 to 7300 and the bottom down near 7000. My Black Line here with the Black Arrow is that Support at 7020 I mentioned earlier. It strikes me we could be seeing a Sideways Continuation Pattern here which comes after the initial Drop from the Highs and it implies another Drop to come when the Sideways Range breaks. Note the US Indexes could be doing a similar thing. 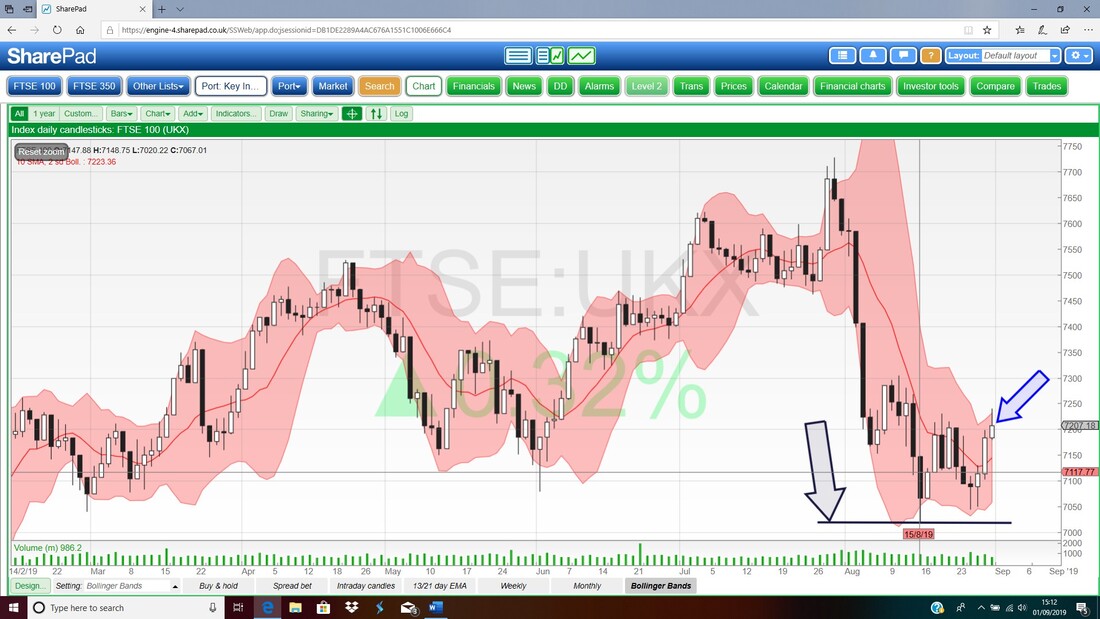
Finally I just wanted to show these Moving Averages. Please ignore most of the noise on the Chart and just focus on my Blue Arrow which is pointing to the Light Blue Line which is the 200 Day Moving Average – at the moment the FTSE100 seems stuck around this Line. Next look at my Red Arrow which is pointing to the Darker Blue 50 Day MA – this has started to curve down and if we see some negativity in coming sessions then this will get near to the 200 Day MA Line and we might get a ‘Death Cross’ – something to watch for.
OK, that’s it for this Weekend, have a good Week and be careful, Oh, and see you at the Bash !! Cheers, WD. 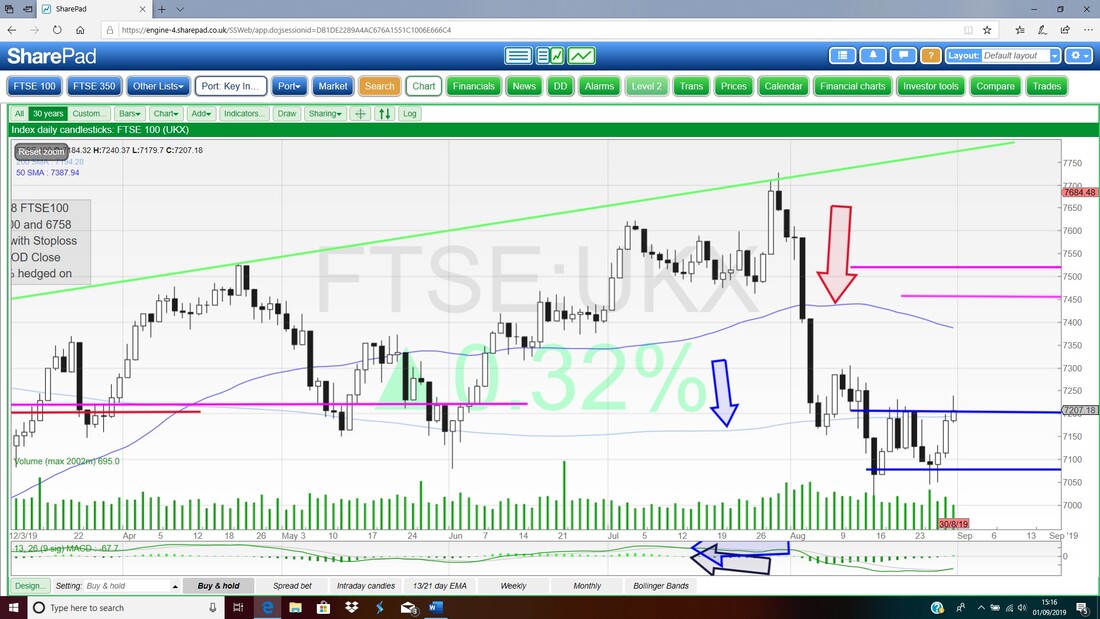
0 Comments
Leave a Reply. |

Stocks & Markets WheelieBlogsThese tend to be more Markets and Stocks related and timely - the Blog Page on the Main WheelieDealer Website has the 'Educational' stuff (well that's the theory anyway !!). Archives
October 2021
Categories
All
|
