

|
stocks & Markets blog |
|
Of course the big news of the week was the spanking that Boohoo BOO got and that was particularly painful for me as it was one of my largest positions before the drop. Anyway, as per various discussions and tweets I am not selling and I expect the whole fuss to blow over in time. I have seen such occurrences far too many times before and won’t be falling for the inducements of Bears to scare me out of my stock.
Peter @Conkers3 and myself did the ‘TPI Live’ session at Mello Virtual on Friday and unfortunately what was supposed to be a 45 minute event got cut to just half an hour due to over-runs and suchlike. That was a pity, but it was a fun thing to do and I enjoyed using a new format to, in effect, do a Podcast and that was certainly a useful experience. If you have access to the Mello Virtual event and did not get around to seeing us on Friday, then I believe it will be there as a recording soon and you can see it for 30 days (something like that anyway).
The feedback I have heard about Mello Virtual has been very good although I understand they had a few technical issues. That is no surprise and I think they did a superb job in a short time of creating a platform to do the ‘show’ and it was a decent alternative to the currently impossible holding of a proper, physical, event. Like so many things we have taken for granted for decades, the advent of the Virus has accelerated new ways of doing things online and Mello Virtual was another example. Of course, much of this acceleration has only been possible in recent years due to the rapid expansion in both computing power and network speed and capacity.
I dread to think how miserable the C19 Lockdowns would have been if this had happened 20 years ago where we barely had dial-in modems and sending an email was about all we could undertake in terms of digital communication. We would have been playing Pacman as well !! Oh, if you haven’t yet heard the latest Podcast, TPI 26, then if you go to the ‘Twin Petes Investing Podcasts’ page then you should find it there now. Or you can click this link: https://soundcloud.com/user-479955511/conkers3-wheeliedealer-26-winning-stocks-ytd-ocdo-avct-smt-pog-phe-ao-indv-bvc-cmcx Last Week My Portfolio got hit again down 1.6% for the week and this run of weakness seems never-ending !! That brings my Portfolio to down about 6.5% for the year so far since January 1st and after a brief nip into positive territory a few weeks ago, the progress has been the wrong way !! There are 2 clear reasons for much of the hit and they account for probably 4% or more of the damage. One was my total balls up on an S&P500 Short that I put on a couple of weeks ago and which I then switched to a FTSE100 Short that I then ended up closing out just before the Markets had 3 down days – very infuriating but in truth my error was in putting the Trade on in the first place as I should have been more patient. I talked about this in depth towards the end of the Podcast TPI 26 and there are some useful psychological lessons around Confirmation Bias and impatience that Readers might find worth listening to. Also if you go to the ‘Trades’ page on WD1 you can see a lot that I have written about this. Obviously the other hit was from BOO and it suggests to me that actually without my screw up on the Shorts and without BOO, the rest of my Portfolio is not doing too badly. Like anything, such periods of soggy performance always come to an end and I just need to grit my teeth and keep trying to smile at it all and not to focus too much on the short term. It is the long-term, big picture, that counts for my way of investing. It has struck me that many of my Stocks look decent and undervalued, and the following ones particularly spring to mind:
If that lot comes good I will be laughing big time !! As always, later in this Blog I will look at the Charts and try to get a sense of what is happening and any clues about the most likely future direction. Something highly significant that happened last week was Bear Crosses on the 13/21 Day EMAs (Exponential Moving Averages) on the FTSE100 and the FTSE250 and this often means weeks of falls or, at best, soggy markets ahead of us. However, I saw that the US had a strong day on Friday and certainly the picture over there is looking a lot better – and the Nasdaq made a new All Time High (ATH) yet again. So my Strategy remains pretty much what I have been doing all this year so far. I am not buying much in terms of Shares because I have all my Slots filled (the full WD40) and although I am due to buy something in my Income Portfolio, I am in no rush to deploy Cash (not that I have much spare anyway) as I think there are plenty of opportunities for Markets to get seriously grumpy again – especially as we get into Autumn with September being historically the worst month. Bearing this in mind I don’t expect to be doing much for a while and my main focus will be on trying to identify carefully and patiently whether or not I need to put Short Hedges on. I think it will happen in the next couple of months but I am not going to move unless I get clear, unambiguous, Technical Signals on the Charts. And I will build a Hedge Position slowly – that was another of my errors with that recent Short Trade – I went too big, too soon. When Tears were shed in the past I noticed in the Questions that were lobbed our way during the TPI Live Session at Mello Virtual that there was one about Retirement and I am sure we will discuss this further in a future Podcast. Anyway, the links below are to 2 blogs on the subject I wrote back in 2015 and there is probably some decent stuff in these although I do think I should revisit this subject at some point with my current thoughts. As per usual, these are taken from the ‘Blog Index List’ on WD2 where you can find the full list of all WheelieBlogs ever written, and there are links to the full articles etc. https://wheeliedealer.weebly.com/educational-blogs/when-can-i-retire-and-how-much-capital-do-i-need-part-1-of-2 https://wheeliedealer.weebly.com/educational-blogs/when-can-i-retire-and-how-much-capital-do-i-need-part-2-of-2 Blog Slate A few days ago I released Part 1 of a ‘Buy Rationale’ blog on Bango BGO and I have already started work on Part 2 but I suspect that is a couple of weeks away because I have a lot on at the moment and it is a question of time as much as ‘work’/life balance and all that. I am due to go fishing on Friday this week and we have the revival of MotoGP next weekend so that will take out a big chunk of time !! I also did some work on a Guest Blog that a mate provided recently and that is probably something I can release quite soon – I haven’t decided for definite but I might put it out this coming week because it shouldn’t need a lot of work to do a final proof-read and load it up to the website. I then have plenty of other ideas to work on and just a few minutes ago I realised that an update on my thoughts on Retirement could be useful !! And no doubt there will be another Podcast on the way soon so that will need a bit of time to get done. No peace for the extremely wicked and all that. I also have several Blogs in various states of completion so I should be able to keep putting stuff out in coming months. Time for Charts then……. FTSE100 As is always the case, my Charts are screengrabs from the superb SharePad software that I use and if you click on the pictures they should get larger on your screen for improved detail. I am starting with the 13/21 Day EMAs because I have already mentioned this and it is highly significant. My Chart below just has the Daily Candlesticks and my Black Arrow is pointing to the offending ‘Bear Cross’ where the Black 13 Day EMA (Exponential Moving Average – more recent days get heavier weighting so it can pick up a change in mood earlier) crossed down through the ‘slower’ Red 21 Day EMA Line. In general, I find both Bull and Bear Crosses on the 13/21 Day EMAs highly predictive and you can look at pretty much any asset and see the same thing – a Bear Cross tends to lead to weeks or months of weakness and a Bull Cross tends to lead to weeks or months of upside. However, the only time that this does not work so well is with a Sideways Trending Market where you can get a Bear Cross quickly followed by a Bull Cross and back to a Bear Cross etc. – this is however a very rare state on Major Indexes and few assets exhibit such traits. On that basis, this recent Bear Cross is quite concerning. I need to inject a tiny bit of hope for Bulls – if you look at my Black Ellipse it is capturing an Up Candle from Friday and this reversed nicely off the day’s Low at near 6000, and in combination with the Candle from Thursday this is arguably a Bullish Harami 2 day pattern but it is a poor context as really you would want more down days before. It does confirm that 6000 is important Support though and a Daily Close below that would be very worrying. In line with my comments about a Sideways Market, maybe there is a Range between about 6000 at the bottom and 6300 to 6350 at the top. I am not convinced though and suspect we might stay above 6000 for a while but it is most likely that as we get towards the typically weaker Autumn Months (late August and September) we might get a sizeable drop. I am decidedly looking to go Short and Hedge my Portfolio when I see the time is right. 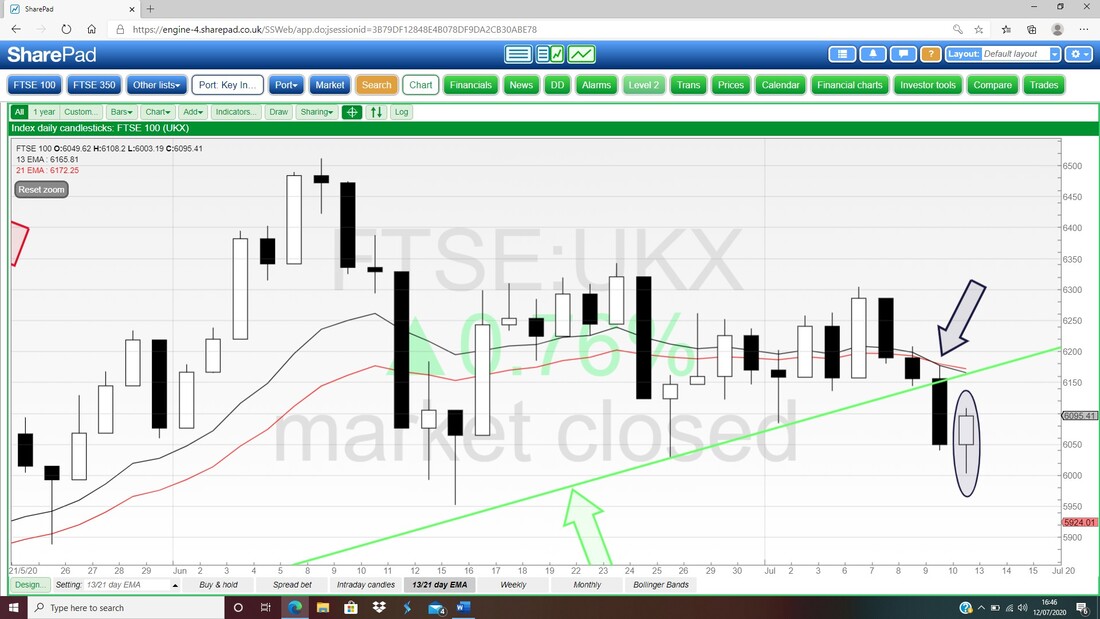
On the TPI Live session at Mello Virtual I mentioned what had happened when we had a 13/21 Day EMA Bear Cross before the big nasty drop earlier in 2020. My Chart below zooms in on this occurrence and where my Green Arrow is we had the Bear Cross and then my Black Ellipse marks the Price Action for about 4 weeks afterwards; then where my Red Arrow is we got that Huge Down Black Candle and then the rest is history.
This suggests that we might be able to tread water for a while but we need to be on guard and fully awake for any big signs of falling. 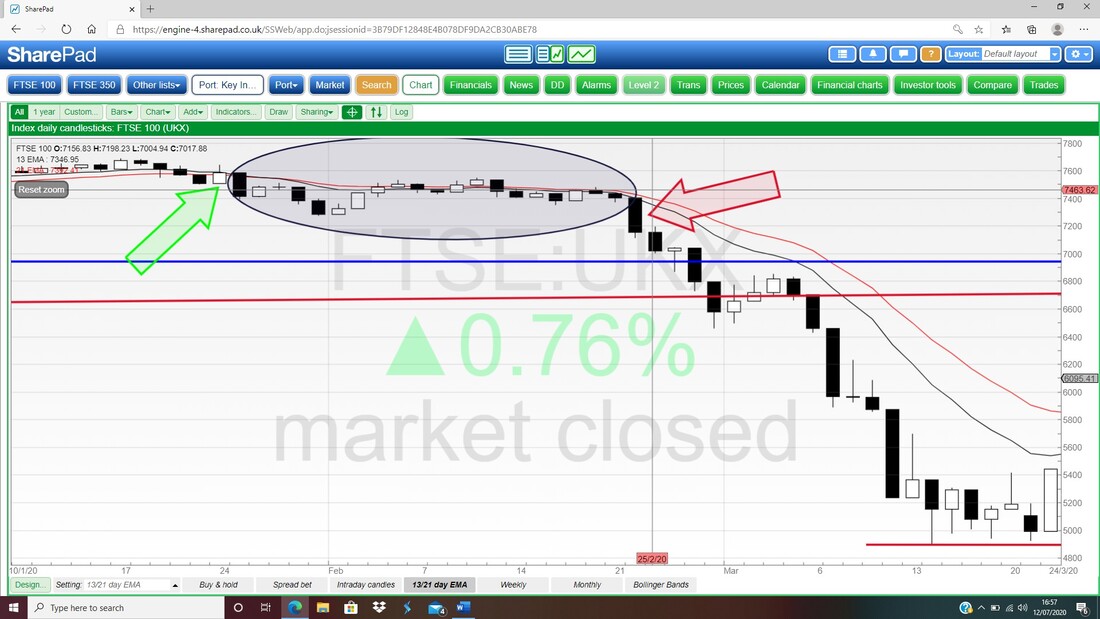
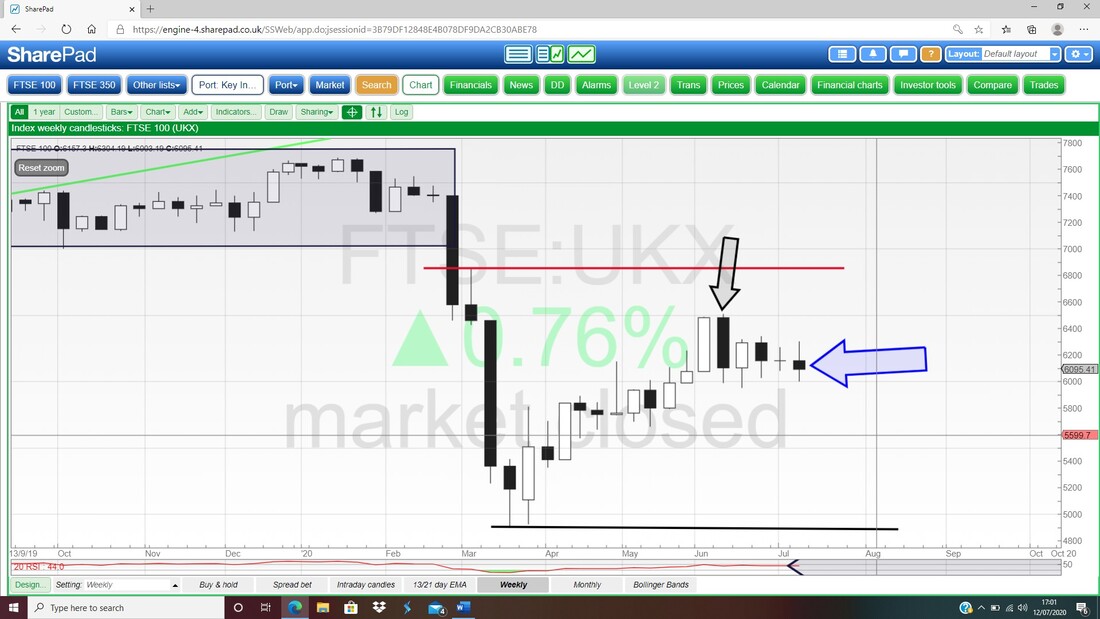
Next it’s the Weekly Candles for the FTSE100 and my Blue Arrow is marking a Long Tails Doji from last week and what is interesting here is that we had a Doji on the previous week yet the FTSE100 couldn’t build on this and push up properly. If you look at the last 4 weeks we have been pretty choppy and thrashing about.
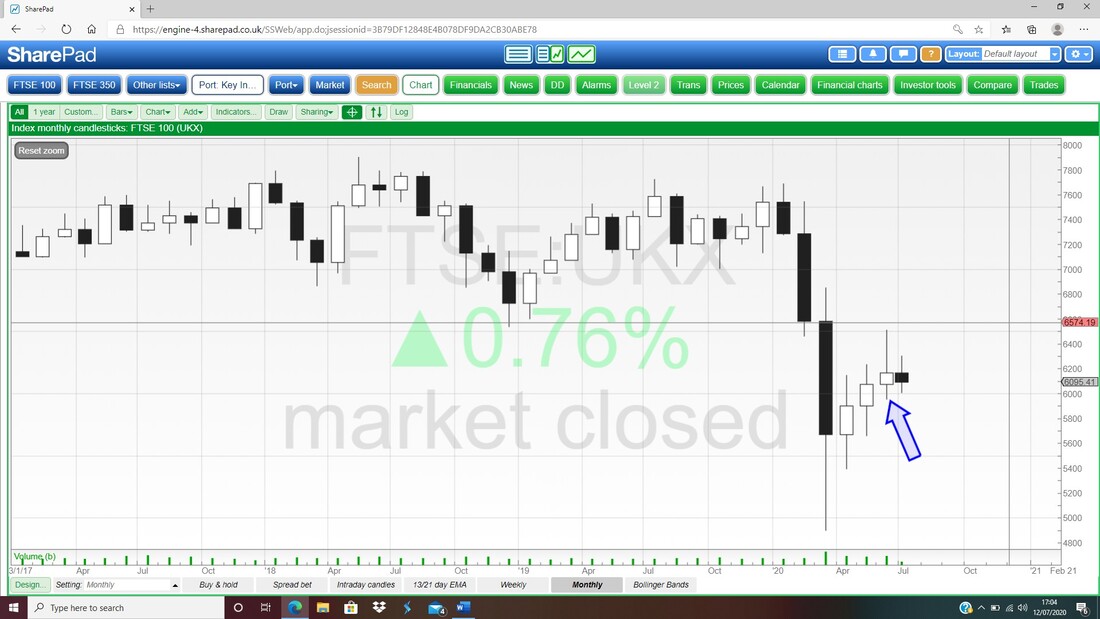
I am throwing the next Chart in as a reminder because it is important in the ‘big picture’. This is the Monthly Candles for the FTSE100 and my Blue Arrow is pointing to that horrible Bearish looking ‘Shooting Star’ for June and this really suggests we will turn down. The Black Candle forming up for July is not valid yet and should be ignored until it is complete.
My final Chart for the FTSE100 has the Daily Candles with the Pink Zone marking the upper and lower Bollinger Bands. My Black Arrow is pointing to where the Candle on Friday moved up off the Bottom Band and note the Red Midpoint Line is at about 6170 and this could be Resistance. Note also that the Upper Band is at about 6300 which is consistent with what I mentioned earlier about the possible Sideways Range.
Obviously 6000 is an important level but if that fails then I think 5952 comes into play from where my Blue Arrow is; and if that fails to act as Support then I think it is extremely worrying and that is the time to Short (assuming we won’t be Short already – or perhaps failure of 5952 is time to add more Short.) I will Short using Spreadbet Shorts but of course an alternative is to use the XUKS ETF which you buy and sell like a normal Share but it gains value when the FTSE100 falls (and loses value when it rises). 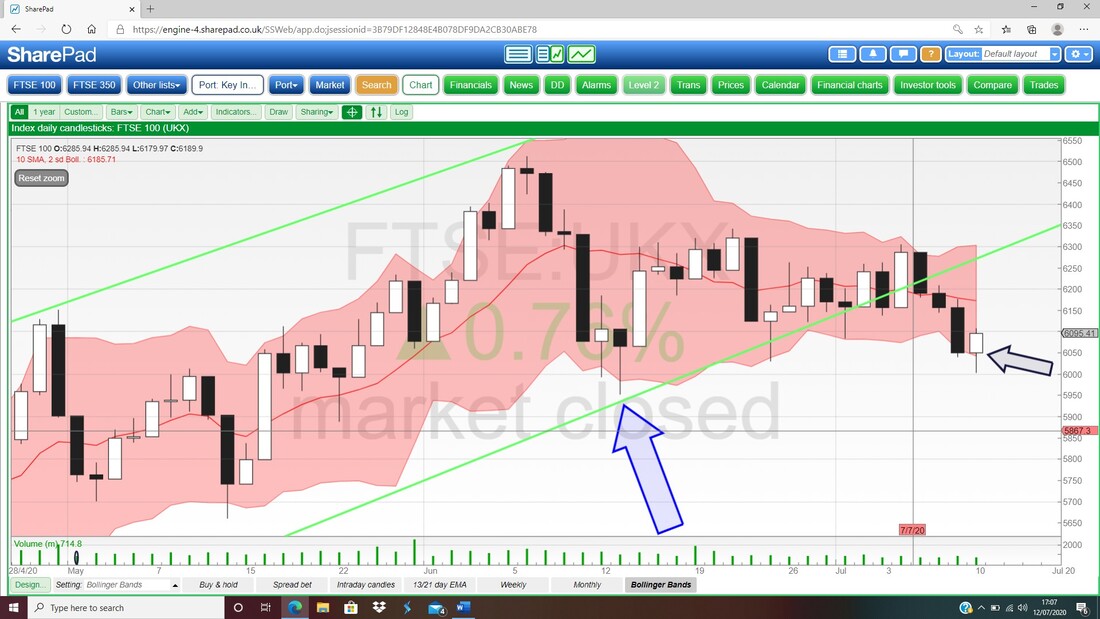
FTSE250
I am just throwing this in because if the FTSE100 falls it is hard to see how the FTSE250 will avoid a similar fate if the mood goes more ‘Risk off’. My Chart below has the Daily Candles for the FTSE250 and my Blue Arrow is showing where we are bang on a Bear Cross on the 13 and 21 Day EMA Lines. We might dodge this but I am highly skeptical we will get away with that. If the FTSE250 falls I would expect the smaller Indexes to drop as well. 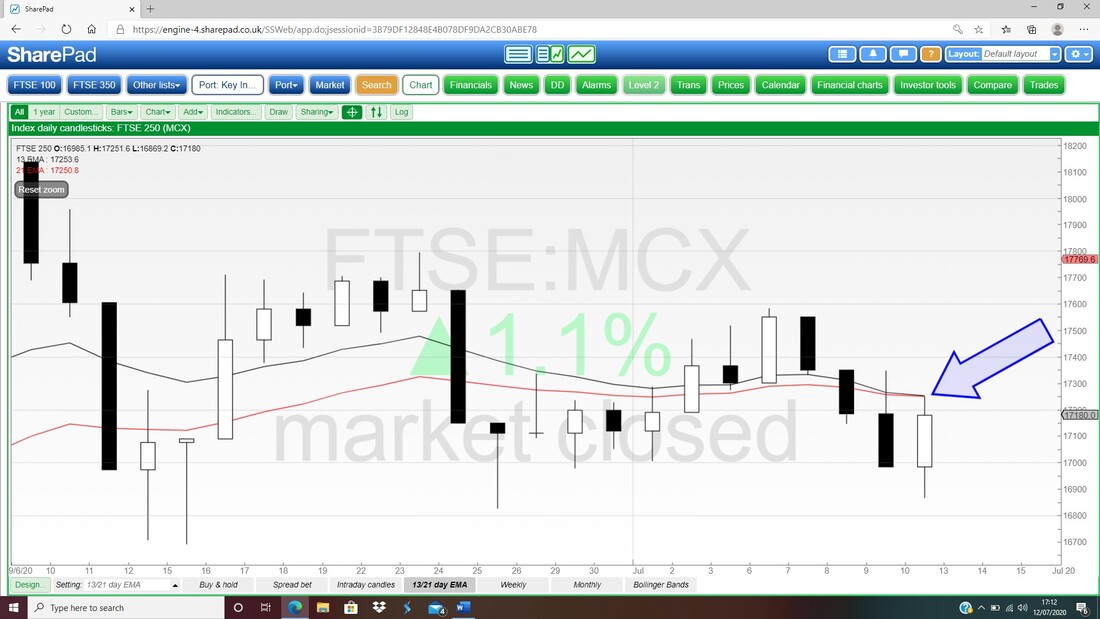
Brent Oil Composite
Obviously Oil has quite an effect on the FTSE100 even with the Oil Majors being down so much and not having the weight in the Index they had last year. It struck me the other day that even though the UK Economy was sort of getting back on its feet, there were not many cars around even on a Friday afternoon when you would expect horrendous jams with the Rush Hour. I suspect this is because people are ‘working from home’ and of course if this is the case they are not driving and burning fuel. There is reason to be a bit more optimistic here than with what we saw on the FTSE100. My Chart below has the Daily Candles for Brent with my Black Arrow pointing to where the 13 and 21 Day EMA Lines are still in ‘Bull Mode’ and this is good for more upside. Note on Friday we got a down candle but this supports the idea that we are in a Sideways Range between $44 at the top where my Blue Line is and then $40 below. Below that there is Support at $37.4. 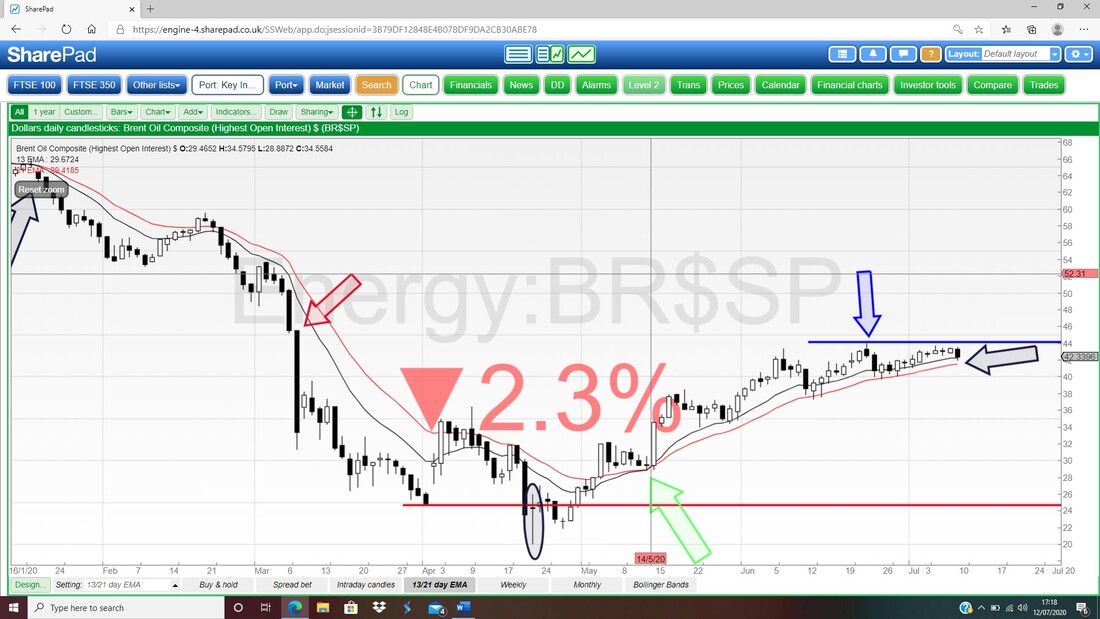
S&P500
Below we have the Daily Candles with the 13 and 21 Day EMA Lines. My Blue Arrow is pointing to where we are still in Bull Mode on these lines and on that basis it looks set to go higher. I think we are coming into the US Earnings Season now and of course we have the Presidential Election on the near horizon. It would be unusual for the US Markets to rise but the UK Markets to fall, so that is a bit of a paradox. I suspect Brexit worries might be playing in a bit but it is still quite weird. 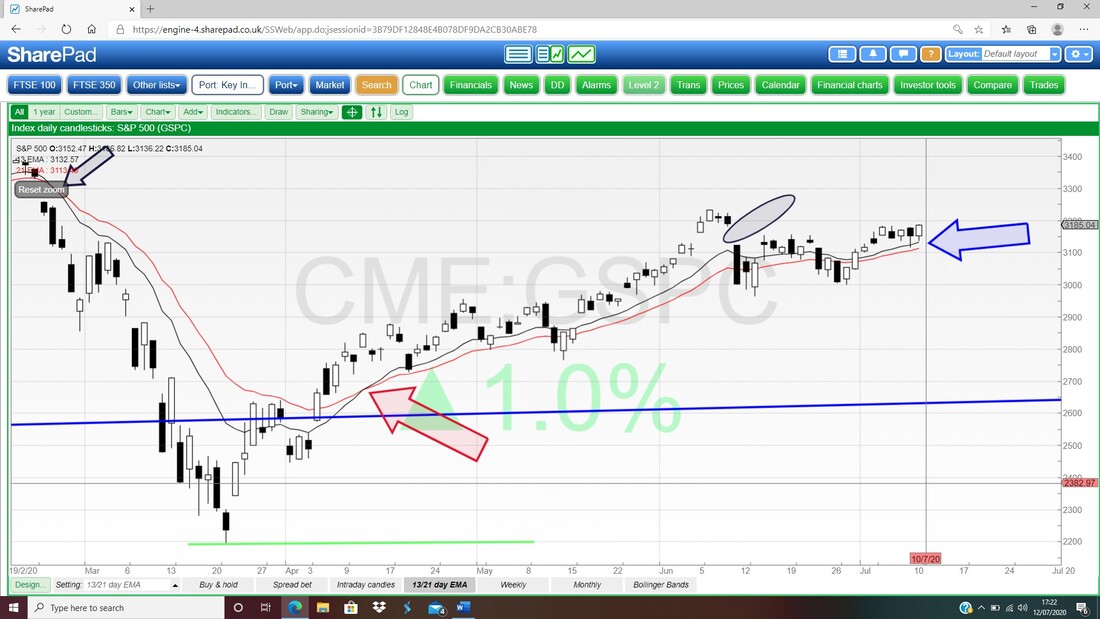
Next we have the Monthly Candles for the S&P500 and my Red Ellipse is capturing a similar Bearish Shooting Star for June to what we saw on the FTSE100. However, the interesting thing here is that even though we should not rely too much on the forming up Candle for July (where my Blue Arrow is), the textbooks would say that if the June Candle is a proper Bearish Shooting Star then the next Candle (i.e. for July) should fall straightaway to ‘confirm’ the Bearish Signal. This is not happening.
OK, I am going to end it there. If you follow me on Twitter you will probably see that I tend to Tweet about the Index Charts every night (not so much on Friday) with regards to what I am seeing after each Day Closes. This is usually just after 10pm. It will be around that time that I place any Shorts if I decide to go that way. Anyway, get out and enjoy the decent weather and try not to spend too much time worrying about what the Markets are doing !! Cheers, WD. 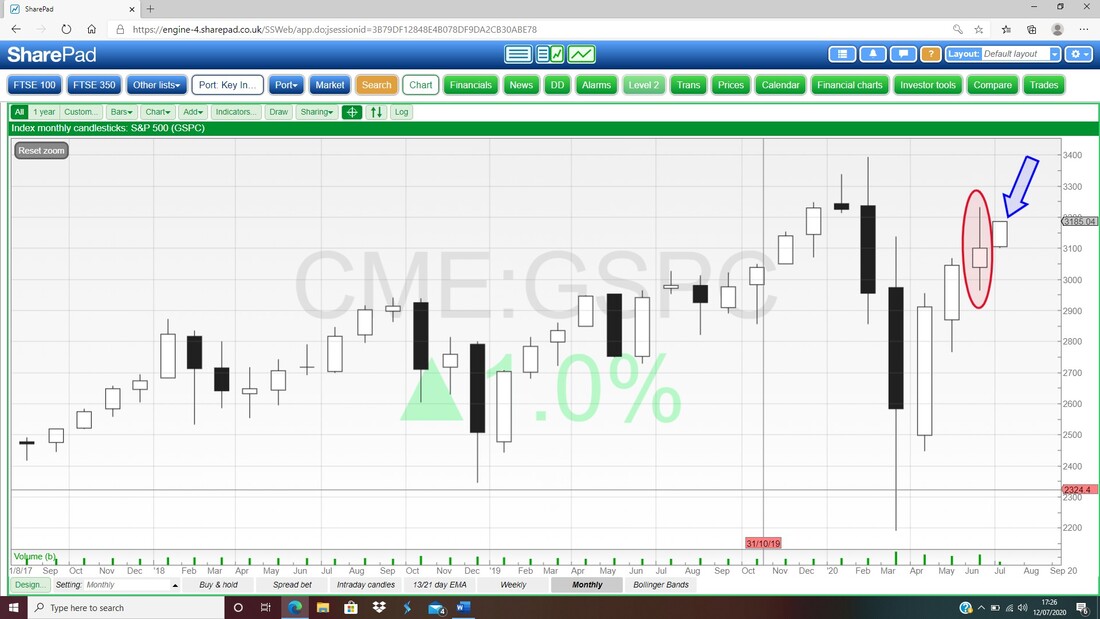
0 Comments
Leave a Reply. |

Stocks & Markets WheelieBlogsThese tend to be more Markets and Stocks related and timely - the Blog Page on the Main WheelieDealer Website has the 'Educational' stuff (well that's the theory anyway !!). Archives
October 2021
Categories
All
|
