

|
stocks & Markets blog |
|
These initial 2 paragraphs have been added on Sunday night after I had written most of the text below on Saturday night (up until the Charts bit starting), and since then the situation in the US with the Protests and Riots has got very messy and could impact on Markets next week. However, my sense is that any hit to Markets will be limited providing that the problem doesn’t drag on too long and I will be watching the Charts like a hawk in an U2 Spyplane over the next few days to look for any signs that things are breaking down on the technical picture. I suspect a key factor on the Riots is how strongly the US Authorities enforce the Curfews they have declared and once a strong hand comes down it is likely many less committed Rioters melt away. Up until now the Charts have looked very bullish and I suspect any weakness will be snapped up by the Bulls. In my Charts chunk I start off by looking at the Monthly Candles and they are very bullish.
On Friday I think we will have the US Non-farm Payroll Numbers and these are likely to be flippin’ dire. However, that is a backwards looking thing and on the assumption that the Riots calm down quite soon, I doubt a high Jobs number will cause too many problems. It could even be seen as bullish because it could mean more Stimulus is on the way and we must never underestimate the commitment of the Fed and the US Government to juice the system in a continuing effort to stave off economic meltdown (especially with a Presidential Election just around the corner).
I am starting this on Saturday Night very late because I have an old buddy coming round tomorrow and this will limit my time to get the blog written. I managed to get out in the MX5 this afternoon and it was perfect weather and I stopped off to shout to a few friends and got a real sense that things are starting to head back to being a bit more normal. It’s been more and more noticeable that roads are getting busier and more people have been out and about for many weeks now and I guess the gorgeous weather encourages everybody out. Unless we get some setbacks with the path of the Virus (I think this is extremely unlikely and there is little evidence that a ‘Second Wave’ is anything more than yet more fear stories), it looks like the direction of travel is for more and more ‘normality’ to sneak its way in and in a few months’ time we could be mostly as we used to be. Of course there will still be some sectors that are particularly struggling and hopefully the Government will continue to support these but it seems most likely that perhaps 70% of sectors will be back like they were in time and I would expect a lot of spending that would have gone on things like Holidays and Theatre events and stuff will be diverted into other things. It is probably not the case that people will just save the money – over the years the population of the UK has been pretty bad at saving and lots of people live a real ‘hand to mouth’ existence where they literally spend all of their pay every week or month with nothing left over (and if anything the borrow more !!). I can’t see that changing. So this means that we might see money that would have been spent in particular sectors being diverted to other sectors so GDP after quite some time (years?) is probably going to get back to where it was before the Virus and I am pretty sure that after this glitch we will be seeing GDP grow as the years tick by. That’s how human history has always gone before and it would be a brave call to argue that this well established trend is going to end. On top of that it strikes me that this left-wing Boris Government has no qualms at all about turning the Spending taps full on and more Government Spending will boost GDP provided that they can chop through the Admin nonsense and actually get stuff done. Sadly the UK seems to be almost the worst or the worst of all Developed Countries and not only have we done badly on keeping Deaths down, but we have also made a right old mess of our Economy and we are still only slowly escaping Lockdown whereas lots of other Countries are much further ahead of us in getting back to normal. It is hard to know what the consequences of this will be but a weak pound seems almost certain with such a backdrop. That though might help our Exporters which would be useful if we end up leaving the EU without a Deal although I suspect there is a lot of posturing going on by both sides. Perhaps this is a time when we should be thankful that the FTSE100 has a lot of exposure to Companies that do a lot of business overseas and with the rest of the world perhaps rebounding a lot faster than us, we might benefit anyway in terms of how our Stocks do. A recovering Global Economy should mean higher Oil Prices in time and other Industrial Commodities I would expect to rise also – that would help the FTSE100. Of course we are well into the Summer Months now and historically the trend is that the Summer is a pretty soggy time for Markets. I guess this has been skewed by the mega Sell-off we had a few weeks back and we are still very much recovering from that. It is pretty impressive how strong the US Markets have been with the Nasdaq really not far from its All Time High although the DOW and the S&P500 have a bit more work to do. The FTSE100 is still quite a long way off its peak but if we see the US continuing upwards then it is highly likely that the FTSE100 and the European Markets like the CAC40 and the DAX will keep rising as well. If things do continue to be pretty good or at worst go sideways, then it is very possible that the Autumn trends of a bit of weakness or a fairly harsh Sell-off come into play again. On that basis, as we get more into August/September we need to be extra alert to look for Signals that a drop could be coming. Of course I will be tracking the Index Charts closely all through and if I see anything worrying I will be shouting and no doubt taking action myself. An obvious Media Narrative for such an Autumn fall would be a second wave of the Virus (and if that doesn’t occur, then you can expect the Media to dig up another explanation of why the Markets are falling !!). Last Week Well it was an absolute belter for me with my Portfolio gaining 4.5% and this means it is now down a mere 2.6% from the starting position on January 1st 2020. It really has been a surprising spring-back but I am not going to be complaining and I will take whatever is on offer !! I see no reason at the moment why this Rally will stop and technically the Charts are still very bullish with room to rise more. If that changes I will hopefully spot that something is happening but at the moment I am happy to stay positioned like I am at about 150% Long and with a bit of luck I should be able to get back to Breakeven soon and then start building some actual Profits for 2020. I really don’t see a need to do much. I am fully invested in my Share Portfolios (there is scope to buy something in my Income Portfolio and I intend to put more focus onto that task soon) and the rest of my Long Exposure is via a Long Spreadbet on the FTSE100 and a Long Spreadbet on the S&P500. I don’t want to add to that because I am wary of getting over-exposure on the Long side and as Stocks keep rising, my Risk is increasing, so at some point soon I will need to start seriously thinking about lowering my Exposure a little which might mean a bit of TopChopping on a few Share Positions or Closing part of my Long Spreadbets. I am not rushing to do this though but I mustn’t add more Long Exposure. Blog Slate A few days ago I published an Educational Blog about how I think Funds are best used and it also contains quite a lot of information about different types of Funds such as ETFs etc. so it is probably worth reading especially if you are fairly new to this game. I am not totally sure what I am going to start writing next but I have a few nascent ideas so no doubt something will emerge from my ‘pen’. Later this week I expect to be talking to Peter @Conkers3 again on a Podcast (blimey, the weeks go by so fast !!) and no doubt there will be plenty going on in the markets to keep us all busy. You might not have noticed but if you go to the ‘Twin Petes Investing Podcast’ page which is on WD2, then I recently brought in a whizzy new innovation which is these sort of embedded ‘Widget’ things which means that you can just play the Podcasts direct from that Webpage – have a look because you might like it and all the Archive is set up on the page that way. It is pretty neat I must say but it was nothing to do with me – I just take the code I am sent and paste it into a clever box on my Website !! From previously Normal times If you go to the ‘Blog Index List’ page then there is the full list of all Blogs I have ever bashed out since starting this Website back in late 2014 I think. Strewth that time has whizzed past but there is a huge Archive now and well worth having a look through – all the ‘Educational’ blogs have links so they are dead easy to track down. From that Archive, I bring you this Series of 3 blogs (Links to the first 2 parts are at the bottom of this one), and to be honest although I can remember writing it, I am not actually sure what it is about !! Sounds fishy but it is a bit of a lucky dip this week !! https://wheeliedealer.weebly.com/educational-blogs/for-investors-red-herrings-are-a-poor-diet-part-3-of-3 OK, let’s look at the Charts and in particular I am obsessed by the Monthly Candlesticks and what they are telling us. Monthly Candlesticks This is extremely important because longer time period things in Charting/Technical Analysis dominate over things with a shorter time period. So a Monthly Candle has more importance and significance than a Weekly Candle (think of that as a wiggle within a forming up Monthly Candle if you like) and that, in turn, has more significance than a Daily Candle (a Daily Candle is merely a wiggle around within a Weekly Candle). It is all a bit like those Russian Dolls with the big one being the heavyweight !! Because they are so important, I will work through several Index Charts and see what messages they are giving us as we now have completed Candles for May. It is also key to realise that Candlesticks are ‘pixels’ and the same basic principles work on all Candles, irrespective of the timescales involved. As ever, the Charts I show are taken as screenshots from the excellent SharePad software that I use and if you click on them they should grow larger on your screen so you can see a bit more detail (assuming I have uploaded them correctly to the website obviously !!). Dow Jones Industrials Index (DOW) If you look back at previous Weekend Blogs I have written lately, you will see that I was highlighting with my Red Ellipse a ‘Bullish Piercing Lines’ 2 Candle Pattern on the DOW and my Black Arrow is pointing to a nice Up Candle for May which ‘confirms’ the Bullish Signal from the 2-Candle Pattern. 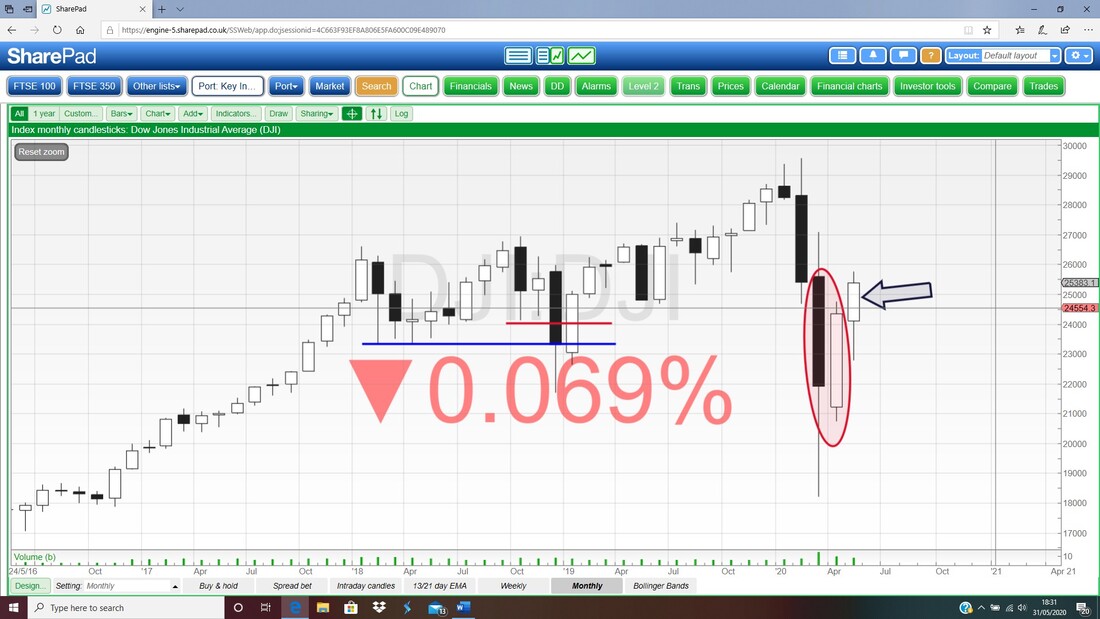
Nasdaq Composite
On my Chart below I had previously highlighted the April Candle which was a ‘Bullish Engulfing Candle’ (marked by my Blue Arrow) and the Candle for May is a nice White Up Candle (marked by Black Arrow) and confirms this Bullish Signal. 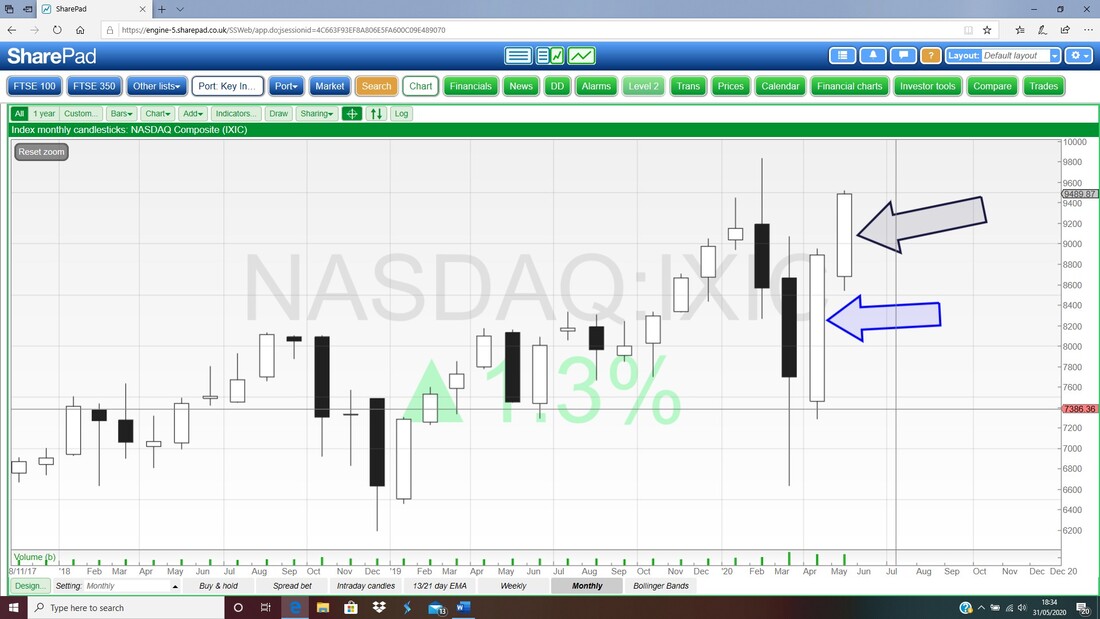
S&P500
Same bullish story as the DOW – I am Long on the S&P500. 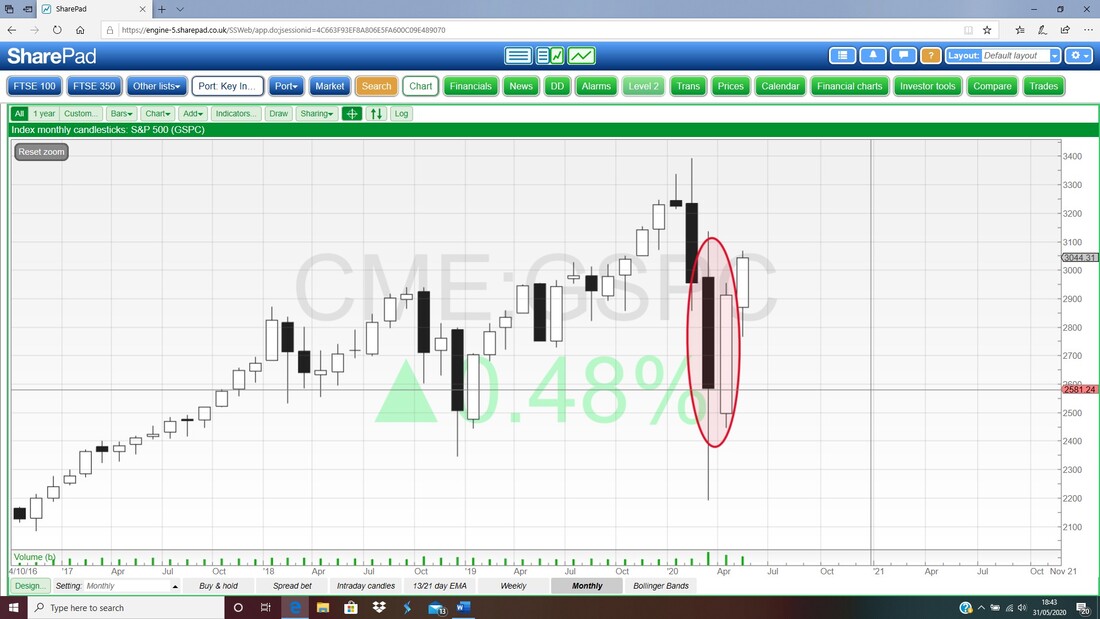
NIKKEI 225
Same story as the DOW. 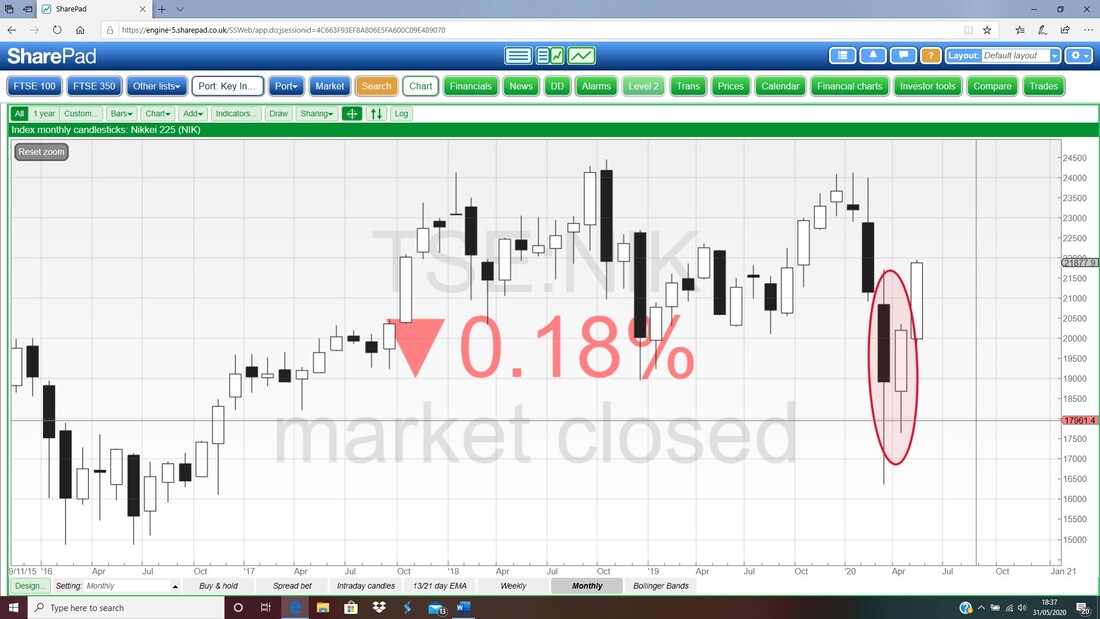
Brent Oil Composite
I mentioned in a previous blog that Brent was showing a Bullish Harami/ Long Tails Doji thing on the Monthly for April and the Candle for May (marked by my Blue Arrow) has confirmed this was a Turning Point up. It’s bullish. 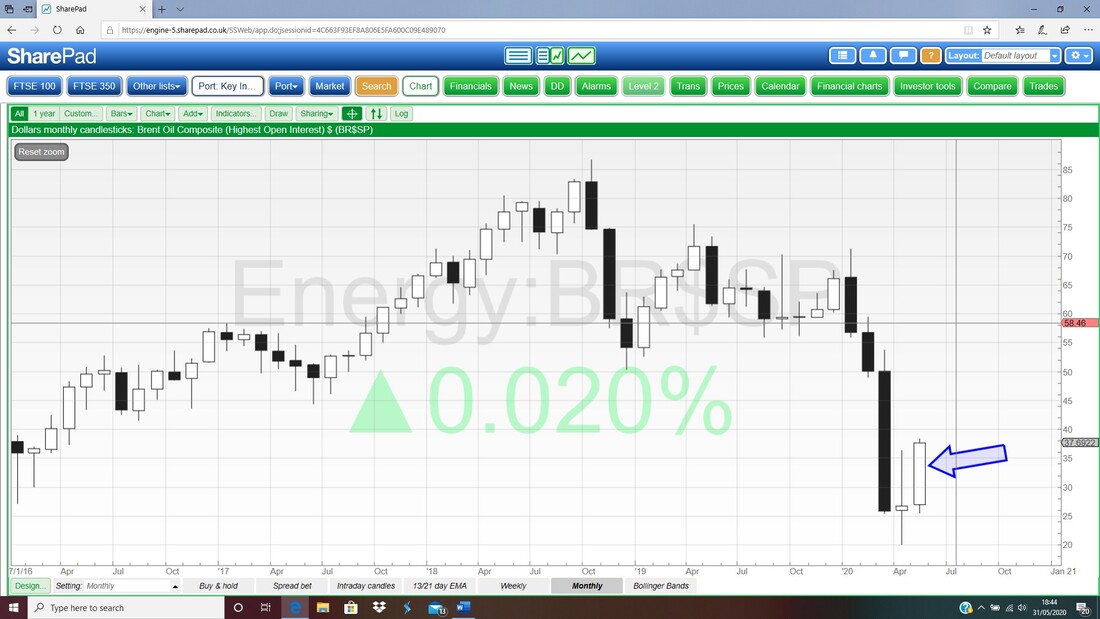
CAC40
Same bullish story. 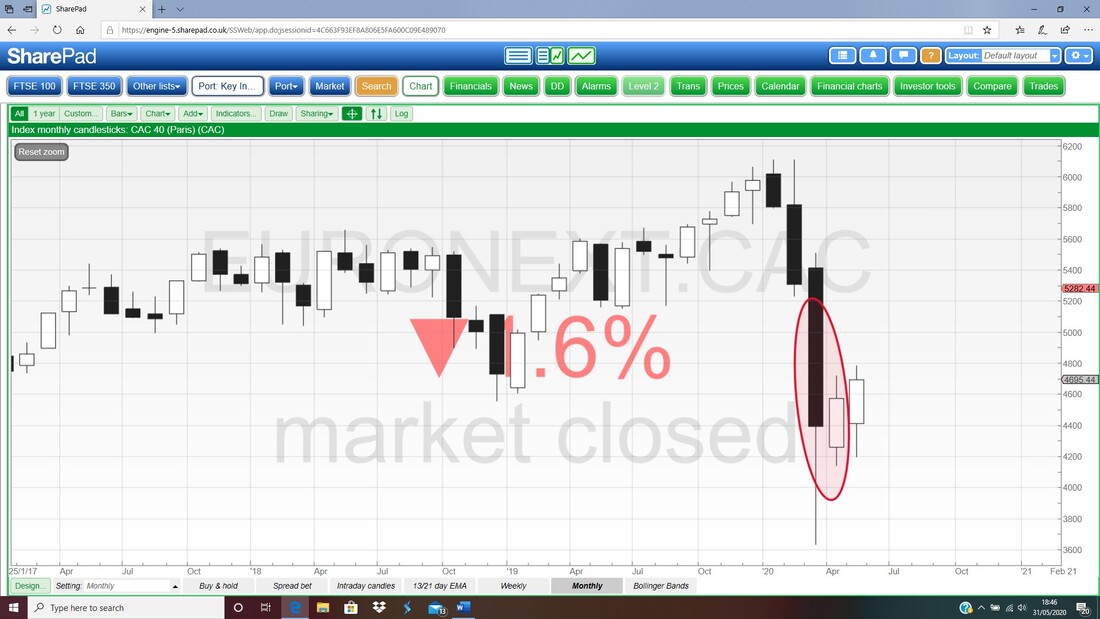
DAX
Same bullish story. 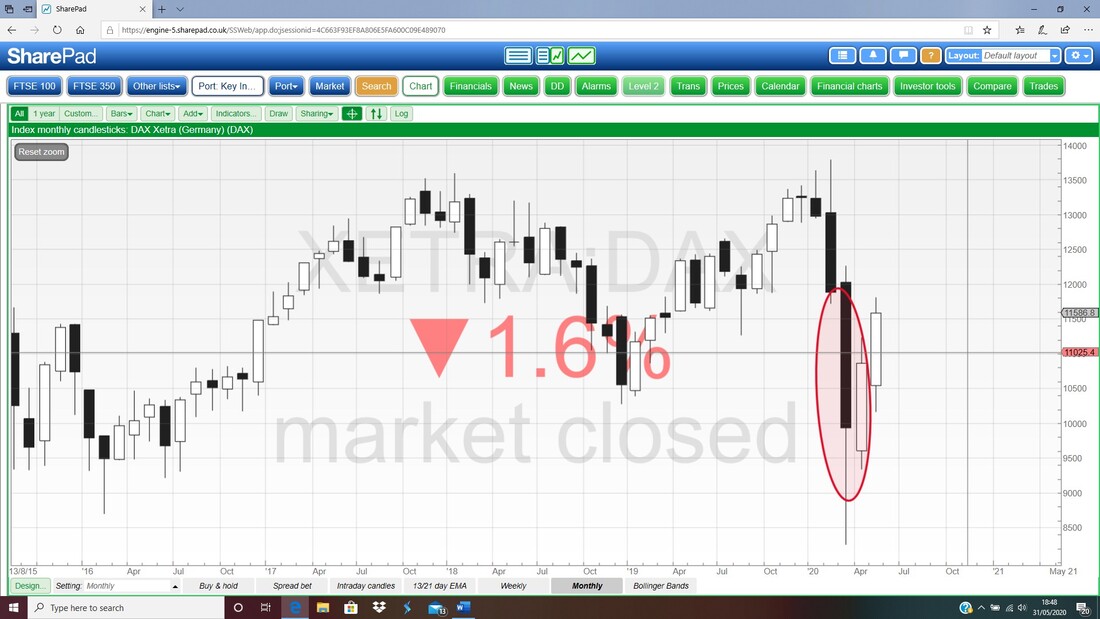
FTSE100
Yet another bullish one. My Red Ellipse marks a textbook 2-Candle ‘Bullish Harami’ pattern and the Candle for May (Blue Arrow) confirms that bullish signal. I am Long on the FTSE100. 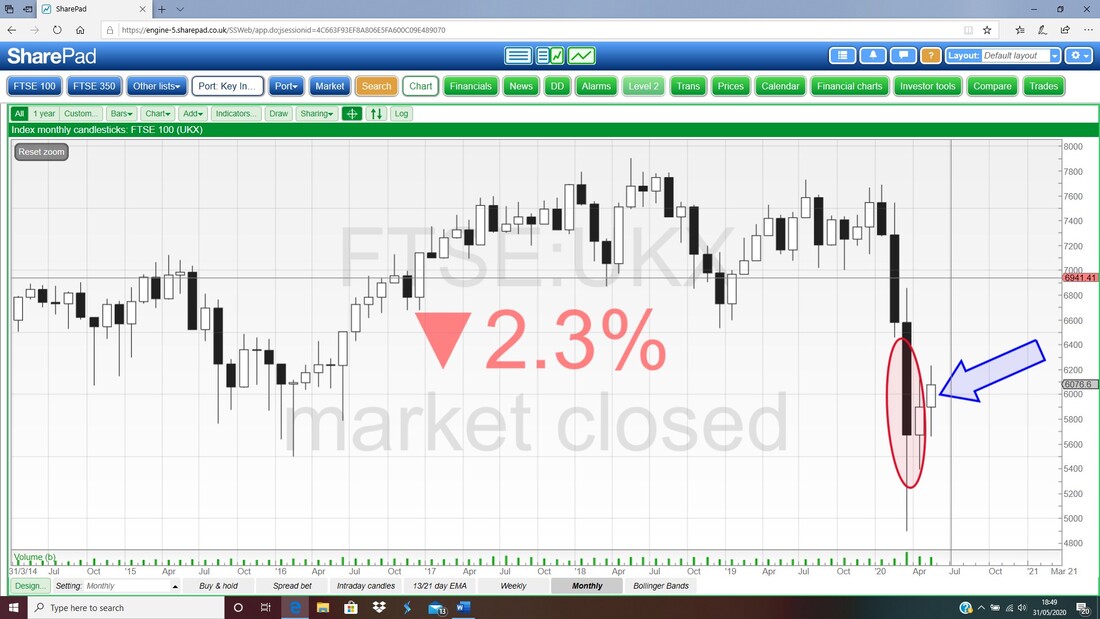
FTSE250
Same as FTSE100 and in fact looks prettier as less chopping about (the long ‘tails’ on the FTSE100 May Candle show this volatility). The long tail below the May Candle (Blue Arrow) shows how strongly the FTSE250 reversed off the Lows during the month. 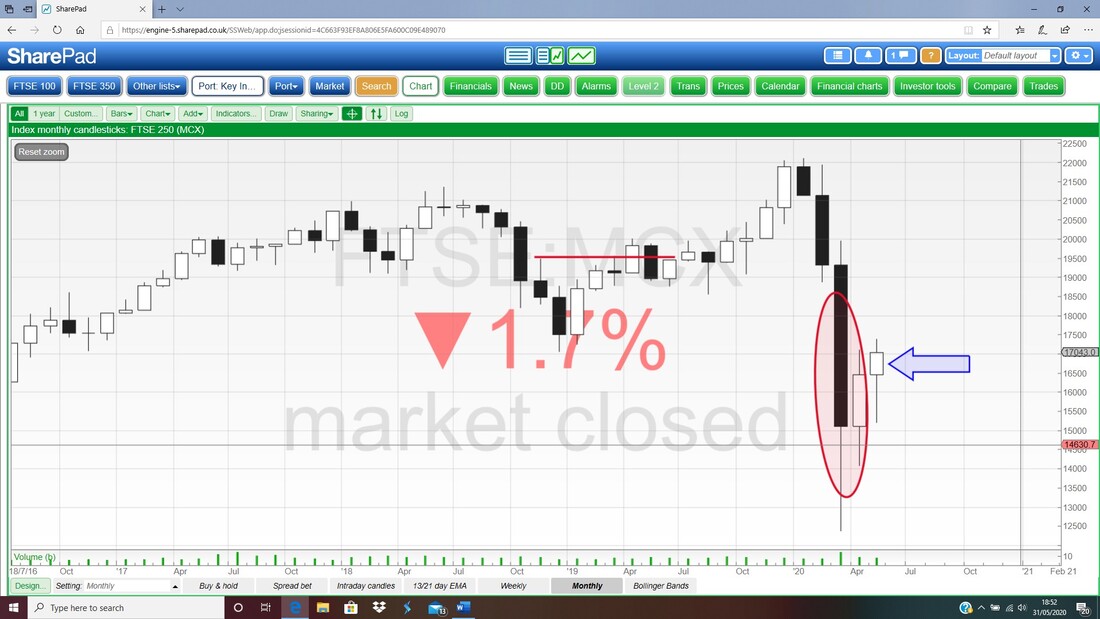
AIM All-Share
Bullish again. 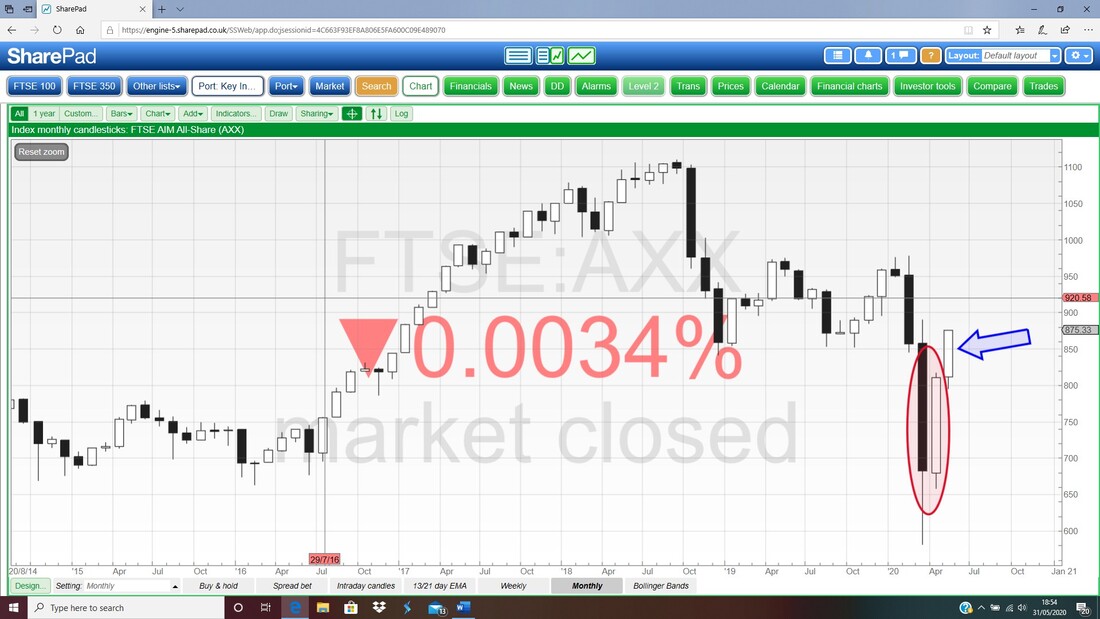
FTSE Smallcap
Same bullish story. 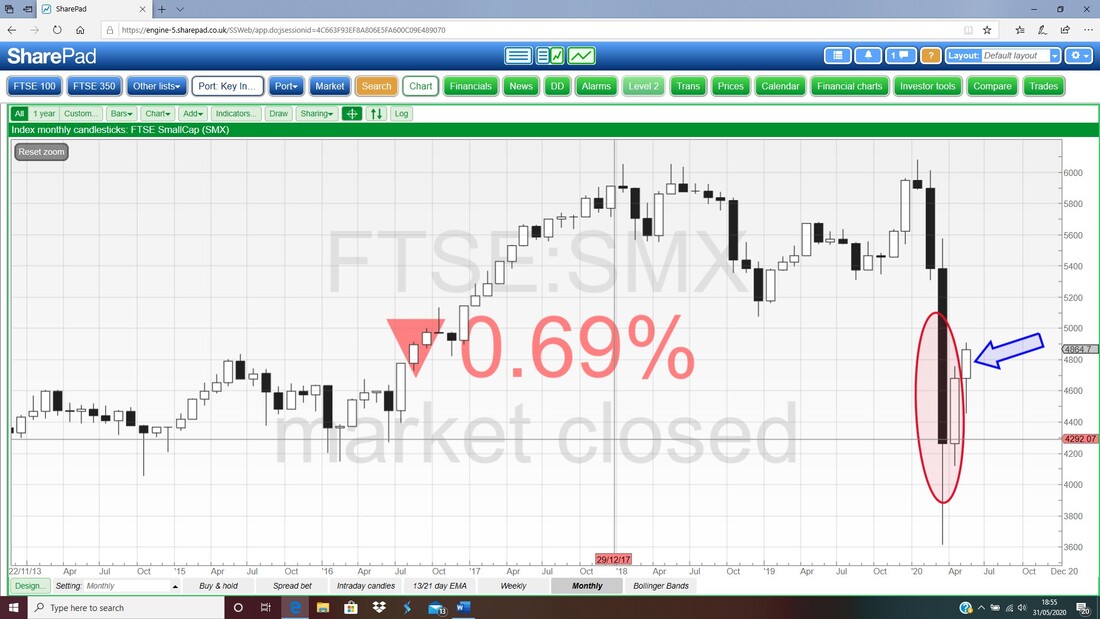
This bullishness across the board on all Global Indexes is very important. Markets tend to move together and it shows that Bulls are very much in the driving seat and taking bets against this is a very risky thing to do. Obviously we need to watch this Riot situation in the US but there are also positive economic forces from other Countries coming out of Lockdowns that could impact on how the Markets move in coming days.
OK, I will now drill down more on the S&P500 and FTSE100 because I am Long on those, but that is after a quick butchers at Brent. Brent Oil Composite Lot on this Chart so you need to turn up the brain power to 11. First off my Green Arrow is pointing to a ‘Bull Cross’ where the Black 13 Day EMA (Exponential Moving Average) crossed the Red 21 Day EMA. This is probably my favourite Indicator and it suggests more upside to come. My Blue Horizontal Line (Blue Arrow) at about $36.4 got broken through which is Bullish and it is important that the Price can stay above this. My Black Arrow is pointing to a tiny Doji Candle from Friday where the Price barely moved. My Red Arrow points to Resistance at $39.55 which is pretty much $40 and I think if Brent Oil can break above $40 then we will see $50 soon after and I expect it to drag the FTSE100 up. 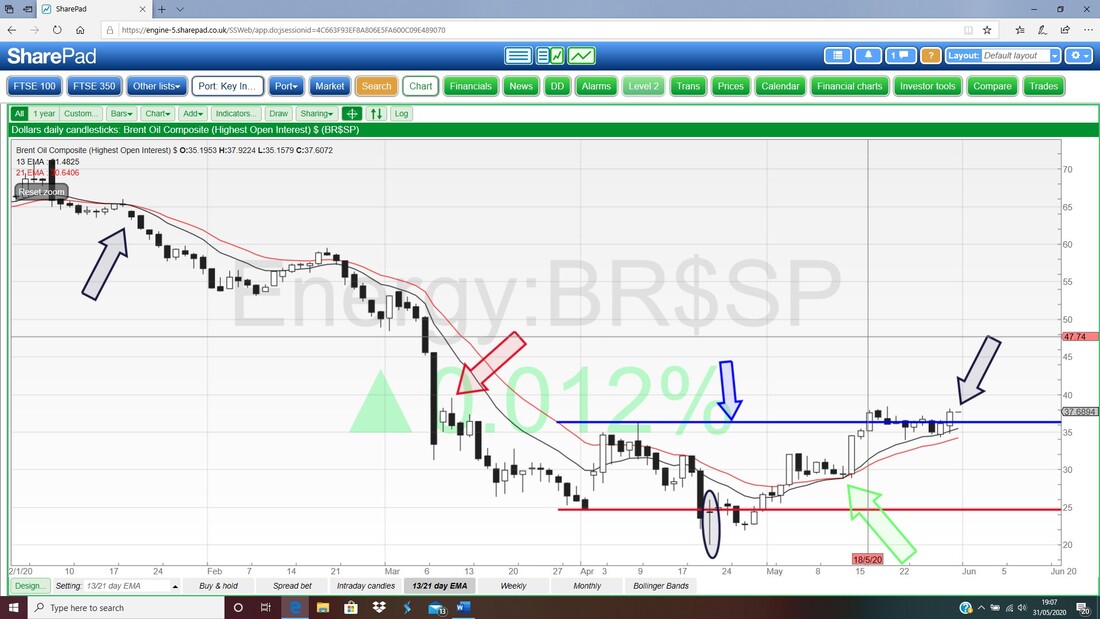
S&P500
First up the 13/21 Day EMAs and my Red arrow is pointing to a Bull Cross which is very much in force. 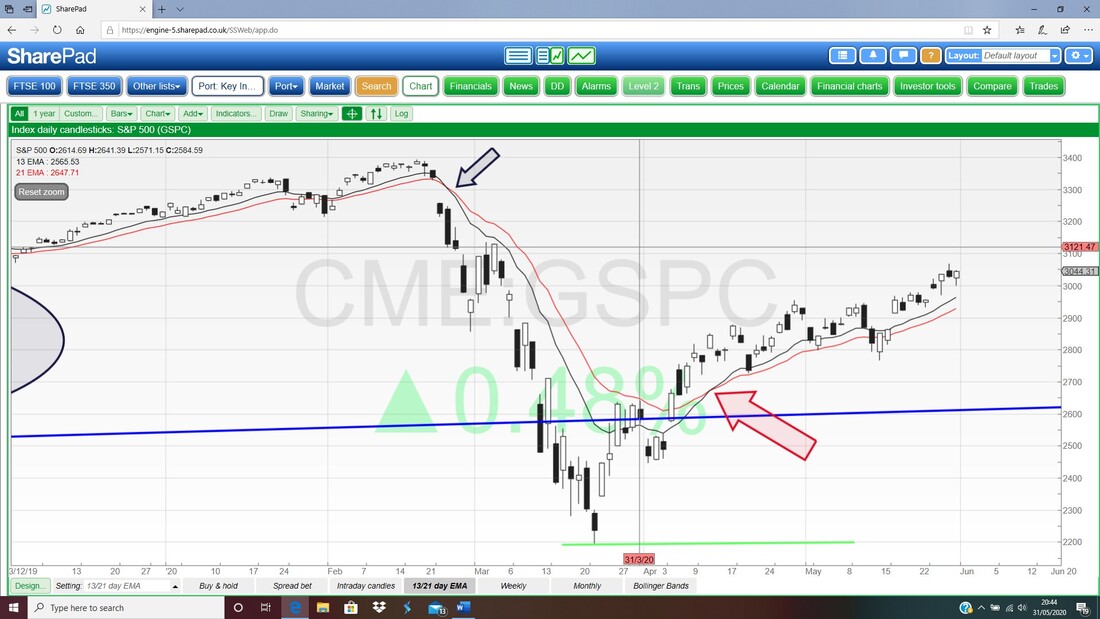
Below we have the Weekly Candles and my Blue Ellipse is encapsulating a Bullish Up Candle from last week. It has some small Tails but the main bit of the ‘Body’ is sizeable and this is unlikely to be a Turning Point down based on what the Technicals are saying (of course the Riots may change this picture but any pullback for a few days could easily be within the Bullish bigger picture as shown by my Monthly Candlestick Charts and the 13/21 Day EMAs).
My Red Horizontal Line (marked by the Red Arrow) at 3000 was Resistance and it was broken above which is Bullish and now it becomes Support. Up above my Black Horizontal Line (Black Arrow) at 3136 is substantial Resistance. 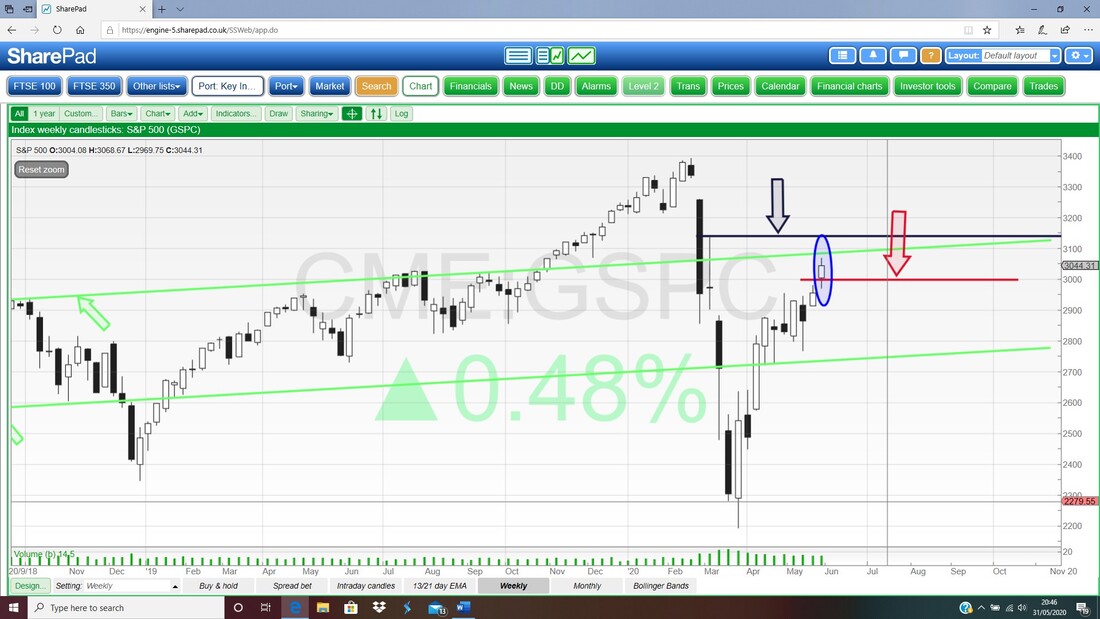
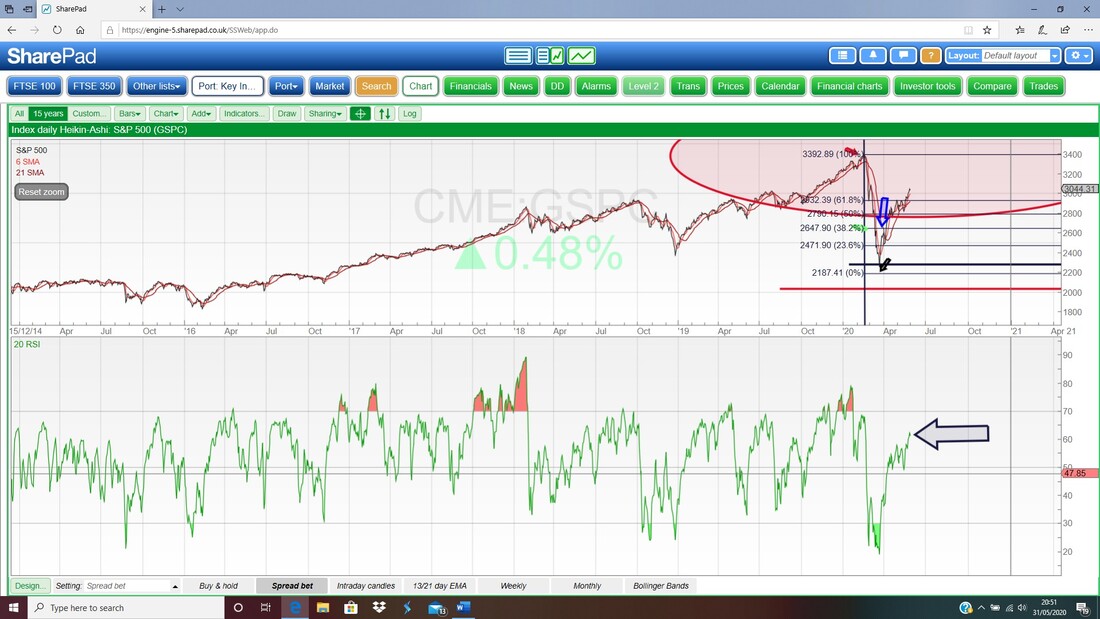
In the bottom window on the Screen below we have the Daily RSI (Relative Strength Index) for the S&P500. On a Reading of RSI 61 where my Black Arrow is, this is not overbought and can go a lot higher.
FTSE100
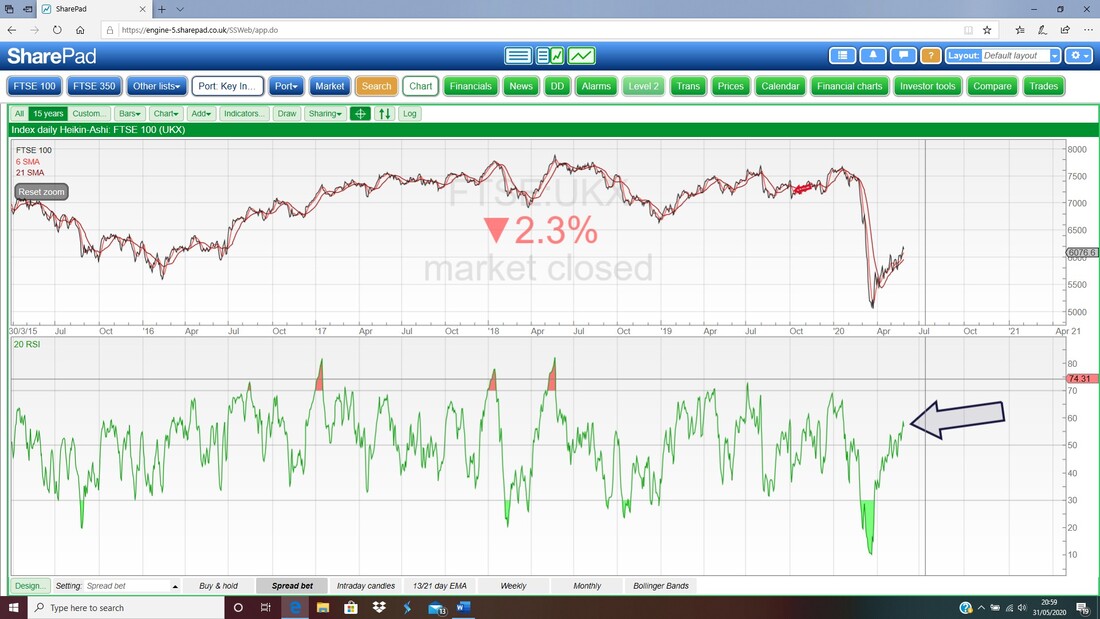
On the Chart below of the Daily Candles for the FTSE100, my Red Arrow is pointing at a Bull Cross on the 13/21 Day EMA Lines and that suggests more upside. My Black Arrow is pointing to a big Down Candle from Friday but note that the FTSE100 Closed on Friday before the US Markets rallied a lot. Note also there is a fair bit of Support not far below as well. 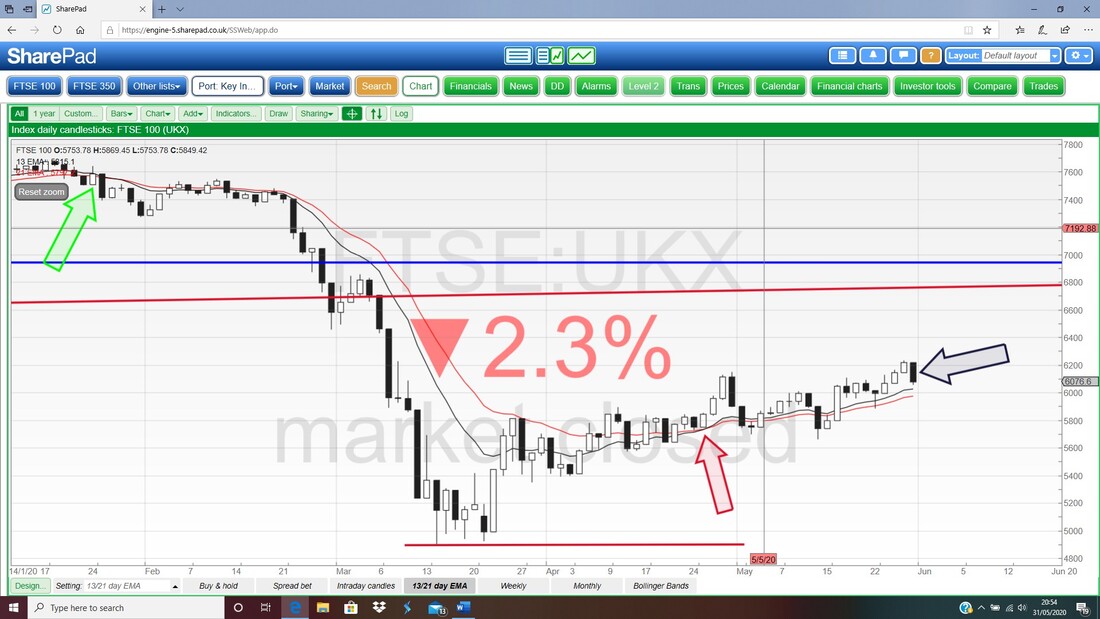
Next we have the Weekly Candles. My Blue Arrow is pointing to a ‘Bearish Shooting Star’ from last week and this suggests a pullback. The key level here is the High from last week at 6234 and if it gets above this then expect a lot more gains. Note also that 6000 is in important Support Level and it would be good to stay above that.
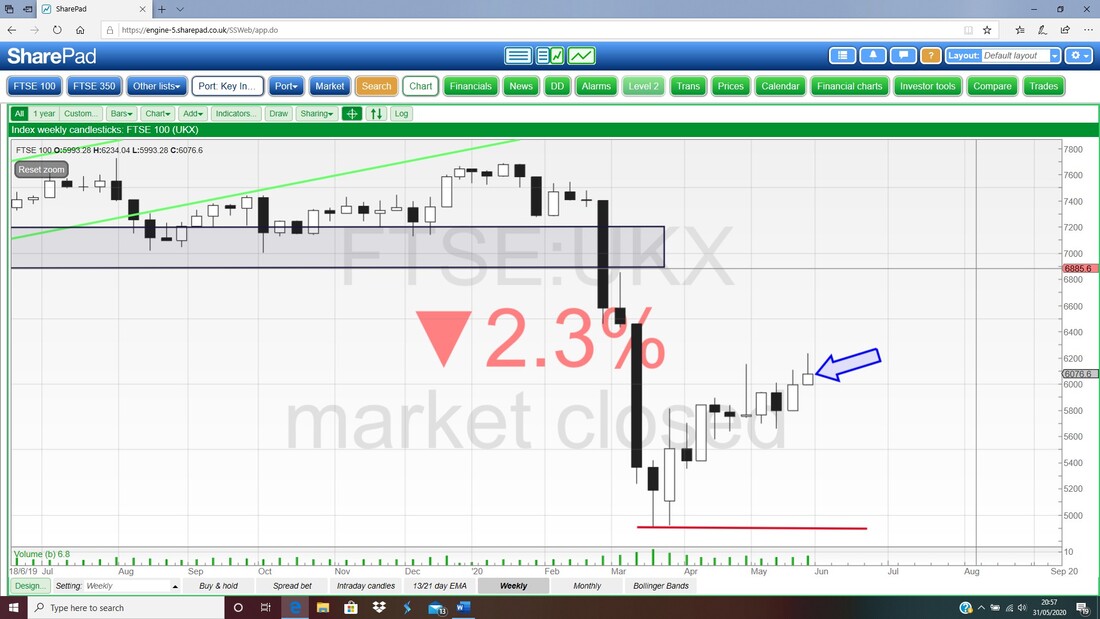
In the bottom window on the Chart below we have the Daily RSI for the FTSE100 and on a Reading of RSI 57 it is not remotely overbought.
Finally, we have the Daily Candles for the FTSE100 with the Pink Zone marking the Bollinger Bands. My Red Arrow is pointing at the Big Down Candle from Friday and note it Closed at 6060 and is just above the Midpoint of the Bollinger Bands. This Midpoint can often act as Support and note that the Bottom Bollinger Band is at about 5800 which should also be Support.
To the upside it would be very good to get above that Blue Horizontal Line at 6231 (Blue Arrow) and to Close above it at the End of a Day (EOD). My Green Parallel Lines (ok, not all that parallel !!) could be marking an Uptrend Channel. Right, that’s it for this weekend – good luck with your forthcoming battles and let’s hope the US situation doesn’t get any messier. Cheers, WD. 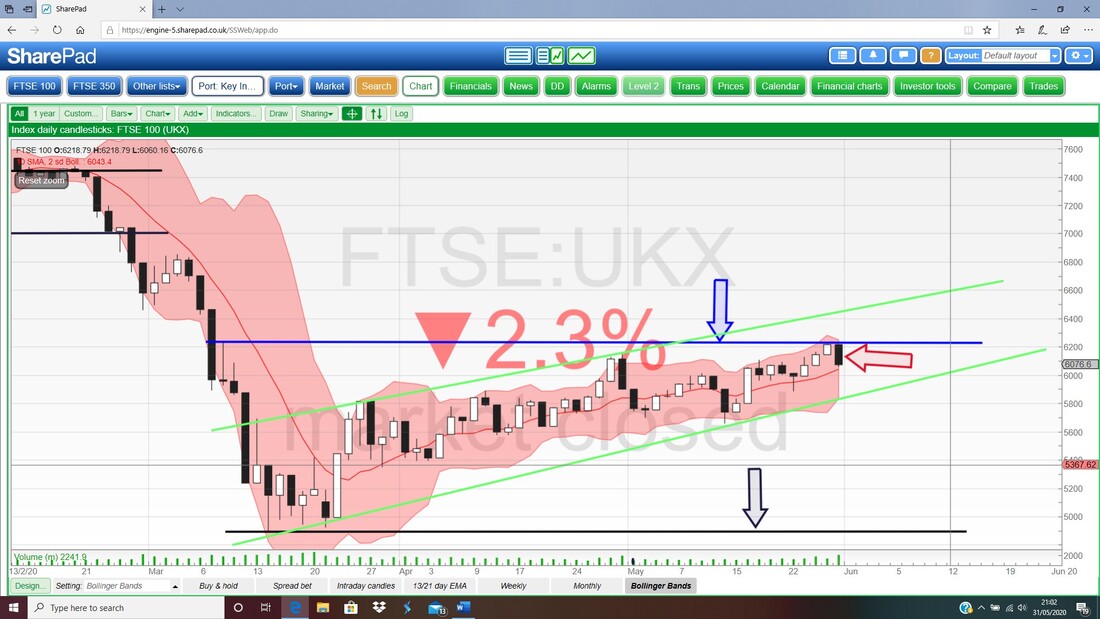
2 Comments
Ann Droid
6/1/2020 02:28:02 am
Markets seem to be ignoring the risks, just like in late january or early february. Eek.
WheelieDealer
6/2/2020 01:08:44 pm
Hi Ann, Leave a Reply. |

Stocks & Markets WheelieBlogsThese tend to be more Markets and Stocks related and timely - the Blog Page on the Main WheelieDealer Website has the 'Educational' stuff (well that's the theory anyway !!). Archives
October 2021
Categories
All
|
