

|
stocks & Markets blog |
|
Hopefully this won’t be a hugely long blog because I don’t want to spend too long on it after publishing a blog last night and doing a New Podcast on Thursday and having spent a fair bit of time this week mucking about with WD2 trying to get the Theme how I want it. The latter is very much a soul-destroying way of burning time and, unfortunately, I need to do a bit more of it in coming days so that I can get it finalized and then apply the new Theme to WD1. And as Readers probably know by now, the last thing I want to do is to let writing stuff for the Website become like a Job !!
On the subject of Podcasts, here is a link to the latest one on Soundcloud and if you use Apple or Audioboom then go to the ‘Twin Petes Investing’ Channel and look for TPI 20. This one is well worth listening to because right near the end Peter C3 nearly knocks me off my perch with a bit of a shocking revelation – I guess he was getting his own back for me pulling stunts like this on him in many of the previous Podcasts !!
https://soundcloud.com/user-479955511/conkers3-wheelidealer-20-potential-domino-effects-of-covid19-conkers3-new-strategy-ams-azn The reason for the title tonight is that I have been seeing much Bullish talk around and I find it rather surreal and baffling. To me the big question is why would Markets want to rally? In other words, what would be the catalyst for a sustainable move up? (rather than just a Dead-Cat Bounce which the recent positivity in the Markets is starting to look like). I can see numerous reasons to be Bearish but very few to be Bullish. I can’t help thinking that there is an immense amount of wishful thinking and hope and it is unlikely that living in dreamland is going to be a reliable Investment Strategy. Apart from the obvious Fundamental reasons to be Bearish, when it comes to the Technical picture I am seeing nothing in the Charts that makes me Bullish – in fact, it is quite the opposite, as I will cover in a bit. In addition to this, there was a good article in ‘Investors Chronicle’ today on page 55 which is written by Mark Robinson and is titled ‘How long will the bears be with us?’ and has the following subtitle: ‘With the bear market in its infancy, it may pay to delay your return to the buyers’ circle.’ Mark’s article looks at the S&P500 over 6 decades and in that time says there were 10 Bear Markets and the average fall was 34.3% and lasted 10.7 months (so the idea that we are over a Bear Market in just a few weeks seems a bit dodgy) and the worst one was 48% down for the S&P500 with a duration of 20.7 months back in 1973/4. On the date of writing this blog, the S&P500 is down 26.7% from its recent Peak and has only lasted just a bit less than 7 Weeks. Compare that to the averages and it looks like a very slight knock. Is it really believable that the Bear Market could be about to end so quickly? And especially when many people (myself included !!) think this is fundamentally far worse than 2008/2009? Last Week A bit of a dull week really after all the recent excitement (perhaps that is a bad choice of word and ‘terror’ might be more appropriate !!) and my Portfolio took a hit of 0.7% which is neither here nor there really. With my Hedging up near to 50% now via S&P500 Shorts in the main and a smaller one on the FTSE100, my Portfolio should be fairly resilient and bizarrely I would probably prefer Markets to fall for a bit and apart from that helping my Spreadbet Account, it would unwind all the fluff in the Markets more and make a Recovery that much more strong and more sustainable. A Rally now after just such a small drop is unlikely to really ‘clear the Market’ and get rid of a lot of the over-enthusiasm and exuberance that we have seen in the longest Bull Market of all time. My Strategy is staying pretty much as it has been in recent weeks – I am doing nothing on the Long side of things and keeping my Portfolio Hedged. I will be opportunistic if we get any Rallies by Closing my Shorts as I did recently but I will be re-opening them if I see a need to. If you look at my ‘Trades’ page on WD1 it is all on there. I am probably Short enough now but if anything I might add a little more S&P500 Short if I see the relevant Signals. Blog Slate Last night I published an ‘Educational’ blog on WD1 which talks about the Trade Plan that I always write up just before I place a Spreadbet Trade with igIndex. If you are a bit intrigued by Spreadbetting but have never done it, then you will probably find this worth reading because I have included links in it to 2 previous blogs which cover how to do Spreadbets and also my approach for Trading the Indexes. I am in an unusual position now of not knowing what to start writing next. I have a long list of blog ideas I can choose from so I will have a look through that once I get some time. However, I need to sort the Theme issue on the Websites first so there might be a bit of a delay to when my next blog comes out although no doubt I will create a Charts blog next weekend whatever happens because I need to do that to inform my own Trades anyway !! OK, let’s get straight into the Charts……… S&P500 As always, the Charts I show here are taken from the cracking SharePad software that I use and if you click on the images then they should grow bigger and clearer for you to look at. First up we have the Weekly Candlesticks. My Red Arrow is pointing to a small Down Candle from last week and note it has quite long ‘Tails’ with a High up at about 2641 which was very near where the S&P500 hit Resistance the previous week. There is something really important on this Chart though – last week we had a ‘Bullish Engulfing’ Candle (see what I said about it in last weekend’s blog) and what is key here is that the S&P500 has FAILED to build on a Bullish setup from that Bullish Engulfing Candle. This was a golden opportunity for Bulls to take the Price and drive it on up and they totally fluffed it. That is not Bullish. 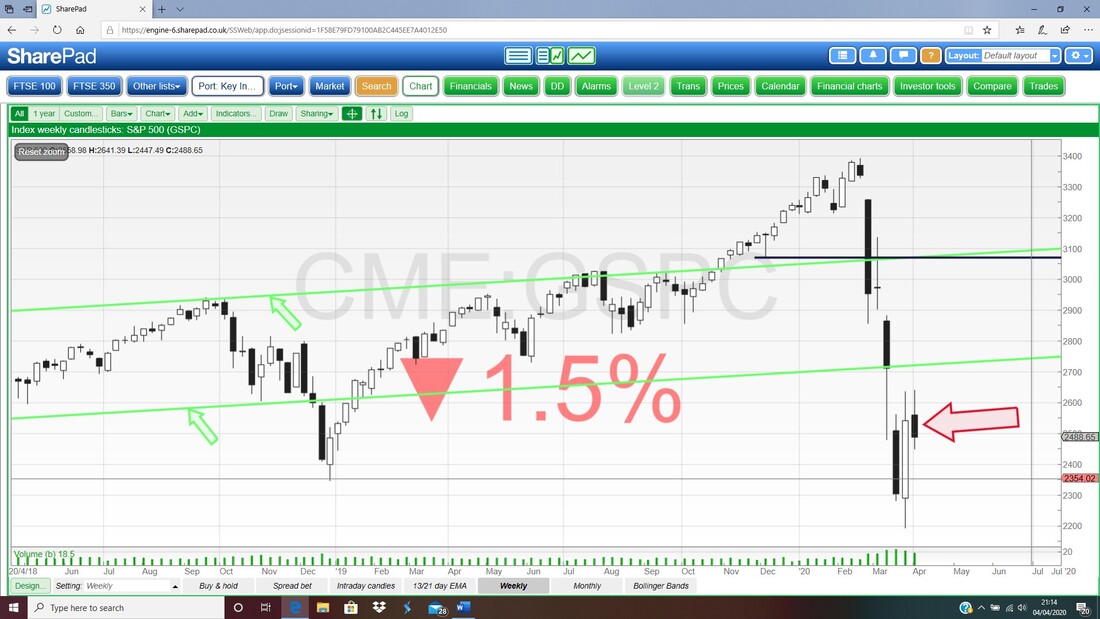
Next is something I talked about on Twitter a few days ago. I mentioned recently in a blog I think that the Candlestick for March was a bit “Hammery”. The next Chart shows the Monthly Candles for the S&P500 and my Blue Arrow is pointing at that March Candle which I said was a bit like a Hammer because it had Closed so much up off the Low – but as things have played out, the idea that this could be a Bullish Hammer have been totally smashed.
If the Candle for March had been a proper Bullish Hammer, then when the Candle for April opened, it would start where my Red Arrow is at the Top of the ‘Body’ of the Candle for March. Such a higher Open would be a ‘Bullish Confirmation’. As you can see where my Green Ellipse is, the Candle for April has actually opened BELOW even the Body of the March Candle and this doesn’t in any way look Bullish. Of course things can miraculously turn around and we could still get a big Bullish Candle for April but based on the information so far, this is about a 5% probability I would guess !!! As an aside, while I think of it, what we need to do on the Monthly Candles from here on in is to look for a Bullish Reversal Pattern – that could be a single Month like a proper nice Hammer Reversal or it could be a 2 Month Pattern with a Bullish Harami. Don’t worry, I will be on the case but I would argue that buying this Market before we see such a Bullish Reversal is likely to be quite expensive. I don’t expect one for many Months yet. 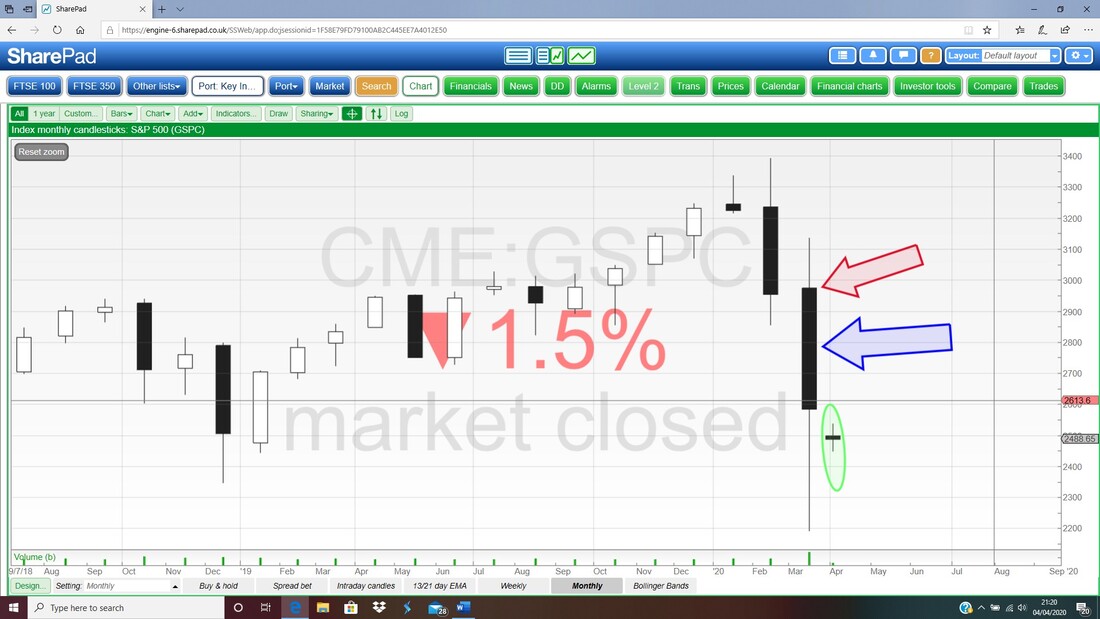
As you know, I love the next Indicator so much (I am thinking of marrying it but that is a bit weird !!) and where my Black Arrow is we had a ‘Bear Cross’ between the Black 13 Day EMA Line and the Red 21 Day EMA Line (Exponential Moving Average) and this is still very much in force. Until we get the opposite, a ‘Bull Cross’, then this is a falling Market.
Where my Red Arrow is points to where we are now and note how a few days ago the Lines were starting to narrow and move together which was the first bit of hope the Bulls had. However, in recent days the Lines have started to widen apart again – making a Bull Cross less likely for a bit. 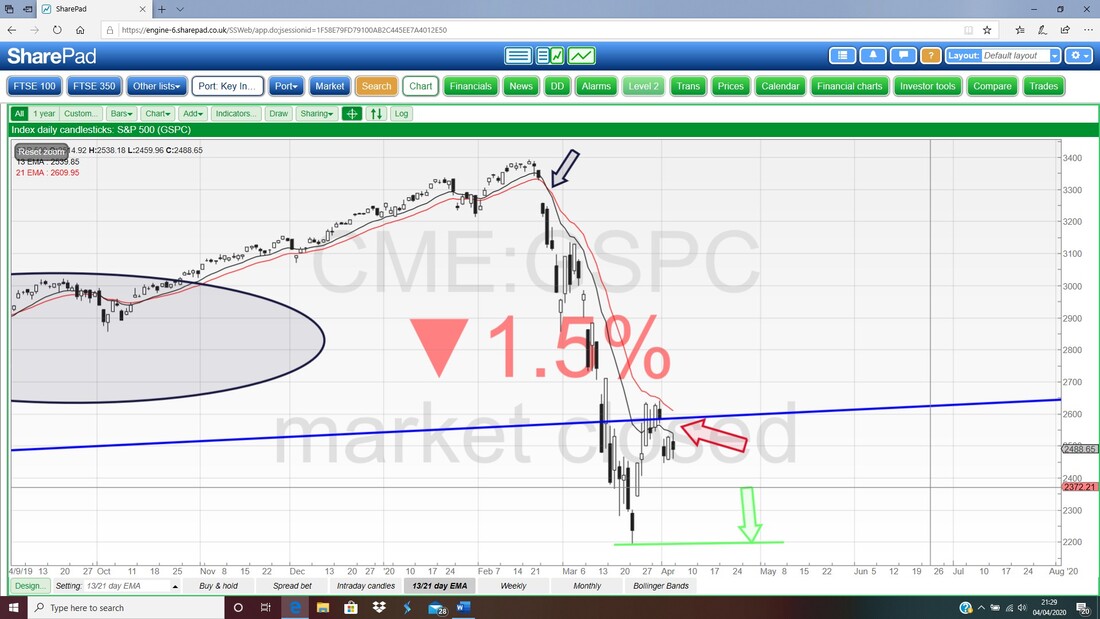
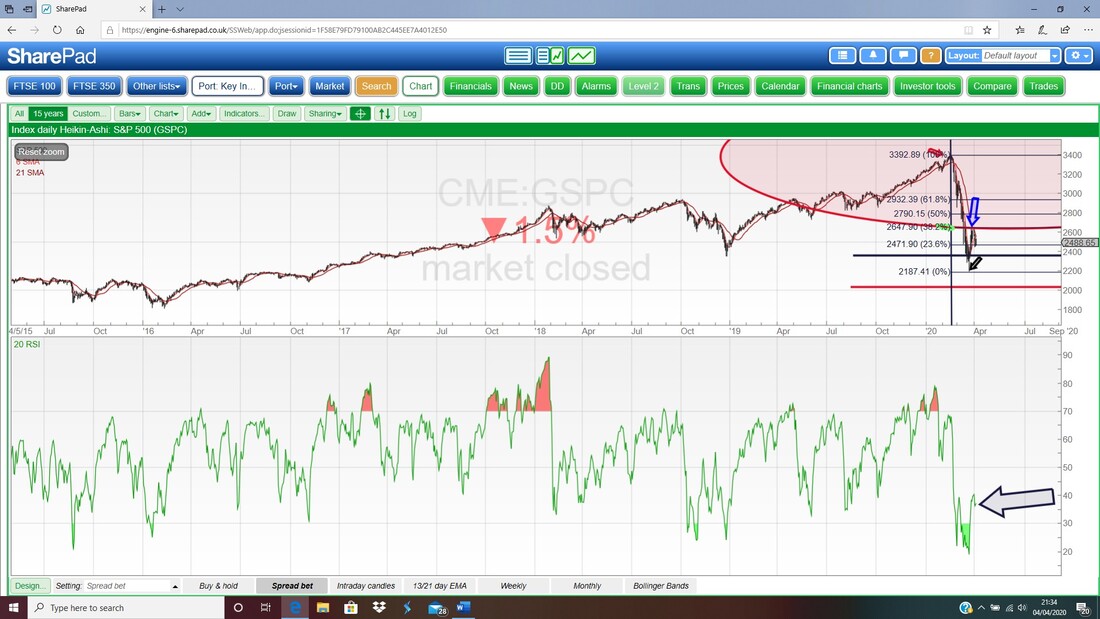
In the bottom window on the Screen below we have the RSI for the S&P500 Daily (Relative Strength Index). Where my Black Arrow is we are on a Reading of RSI 37 which is a very low level and in more normal times would suggest more of a Rally could happen. However, with the current weakness it would not surprise me if the Markets were to fall even with the RSI so low. Just recently exactly this kind of thing happened as you can see on the Chart.
Finally for the S&P500 we have the Daily Candles and the Pink Zone marks the Upper and Lower Bollinger Bands. My Red Arrow is pointing to a small Doji Candle from Friday and note how on Thursday there was a Bullish Engulfing Candle, and like we discussed earlier on the Monthly, the Bulls have failed to build on this Bullish Setup and this is a poor show.
To the upside, there is Resistance from where my Black Arrow is at 2641 and down where my Blue Arrow is there is Support from the Bottom Bollinger Band at 2285 and below that there is Support at 2191. On the evidence I have seen in these Charts, I am happy to stay Short on the S&P500. 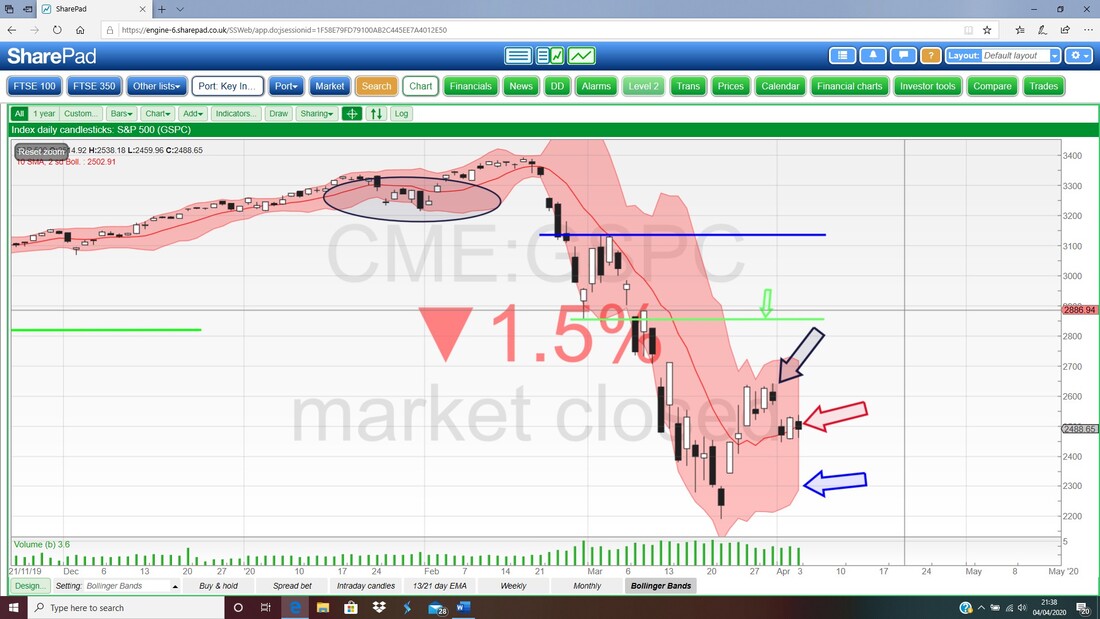
FTSE100
I won’t dwell on this but as you would expect (because all the Major Global Indexes are pretty closely correlated) my Blue Arrow is pointing to the start of the Candle for April and it has failed to build on the Candle for March. 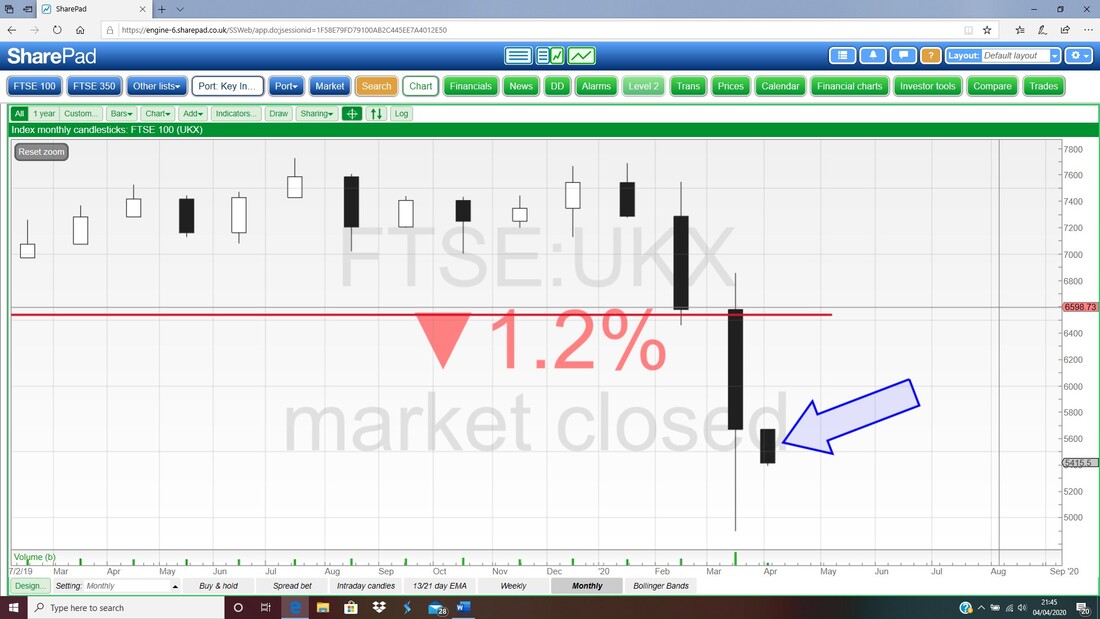
Next we have the Weekly Candles for the FTSE100. My Blue Arrow is pointing to the Candle from last week and this is most clearly a Bearish ‘Shooting Star’ sort of thing. The context is not perfect for that but it is most certainly Bearish.
On top of that, the Candle from the week before is a Bullish Engulfing Candle and the FTSE100 has failed to build on this Bullish Setup. Not good. To the downside there is Support at 4898 – if that fails, then expect a lot lower. 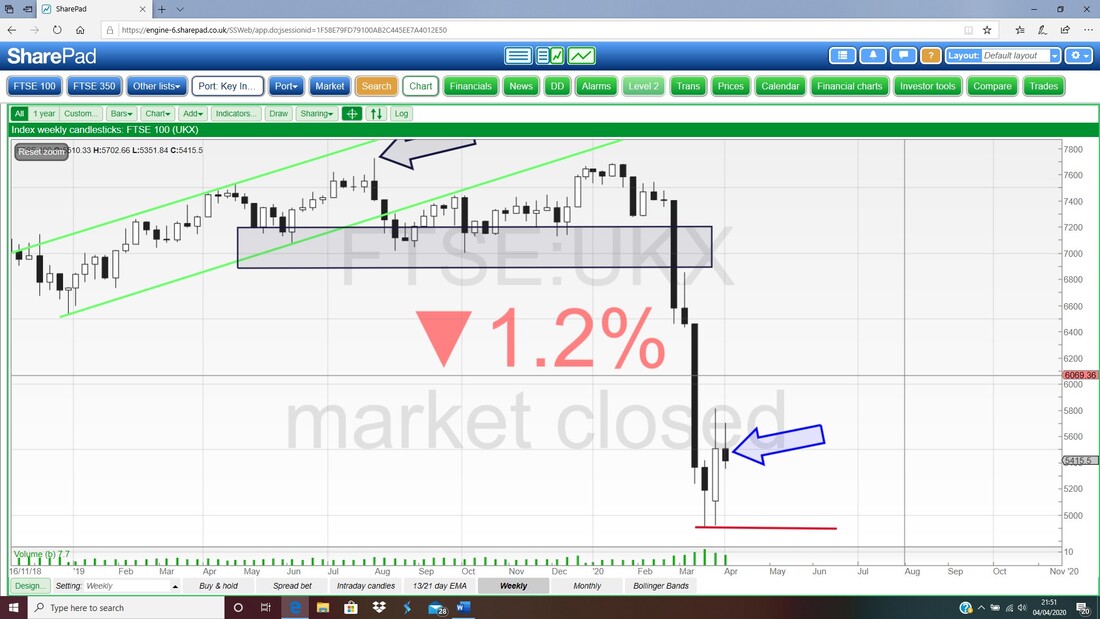
Next is the same story as the S&P500 on the 13/21 Day EMA Lines for the FTSE100. Where my Green Arrow is we had a ‘Bear Cross’ and there is little sign of a Bull Cross here.
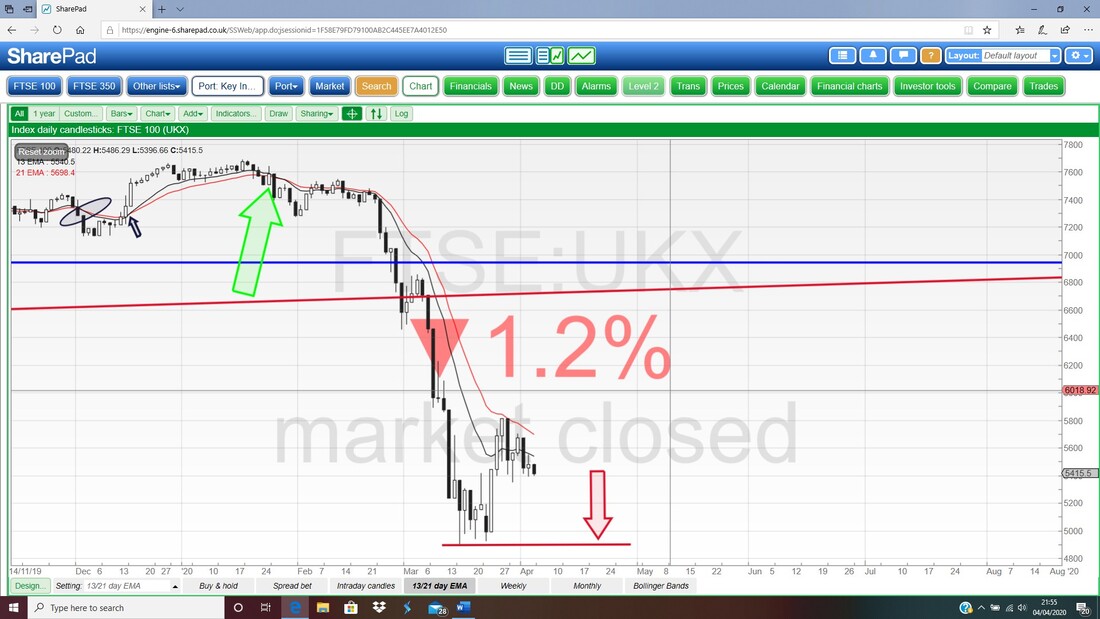
And last up tonight we have the Daily Candles for the FTSE100 with the Bollinger Bands. As was the case on the S&P500, we got a small Doji Candle on Friday but what is more interesting here is where my Red Arrow is – that is pointing to a Hammer Candle from 30th March and the Low there is 5351 and if that level fails, then we will head down towards the bottom Bollinger Band at 5090 and then the Support where my Green Line is at 4898. Failure of the Green Line would be really bad and a Signal to Short the Market. On this evidence, I will be staying Short on the FTSE100.
OK, that’s it for this week, be careful out there and don’t go trying to be ‘Billy Big Balls’ and crazily buying Stocks. There might be the odd decent buy out there but it is much more likely that almost everything is going to be lower in coming months. I would suspect the only good buys now are for short-term Trades rather than something to keep holding. Regards, WD. 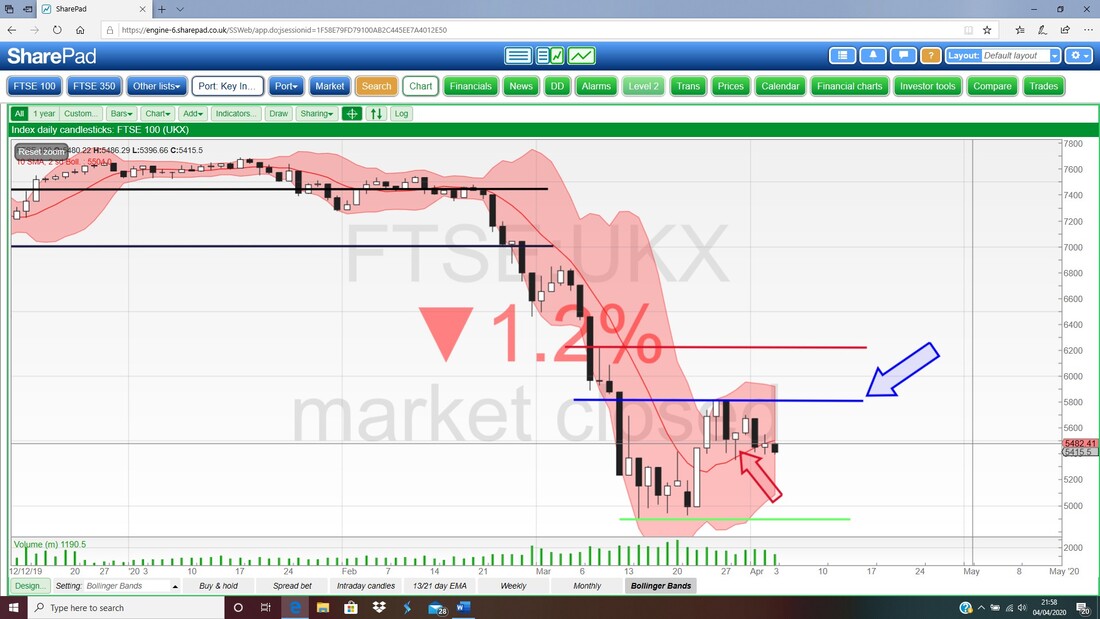
0 Comments
Leave a Reply. |

Stocks & Markets WheelieBlogsThese tend to be more Markets and Stocks related and timely - the Blog Page on the Main WheelieDealer Website has the 'Educational' stuff (well that's the theory anyway !!). Archives
October 2021
Categories
All
|
