

|
stocks & Markets blog |
|
I am sure you will recognise that phrase and it sort of sums up how I am feeling about the Markets. I talked a lot about this in last Weekend’s Charts Blog and I won’t repeat that, but in the week just gone the FTSE100 has been pretty soggy and the US has pumped up even more. I might be wrong but it just seems highly unlikely that we will avoid some sort of significant Pullback in coming weeks – and the Charts bit later will no doubt look at the reasons for this in terms of the Technicals.
I’ve really been trying to take advantage of this ‘Phoney War’ by getting out and about and making the most of what remains of Summer after the disruption that the C19 Fiasco has caused. I have lots on socially which is great and I am meeting up with loads of highly talented Investing and Trading mates which is very good fun as well as being useful for my own Investing efforts. So it suits me really to have pretty quiet Markets and not a lot of news about so I can crack on with the fun !!
I suspect Markets will start to think more about the US Presidential Election soon and the uncertainly going into this could help trigger at least a pause in the immense run-up that the US Markets (especially the Nasdaq Tech Index) have had. The UK Media seems totally convinced that the Democrats are going to win but if anything, it seems to me that the result is going to be extremely close and with Trump involved, the actual Campaigns are going to be a new level of ugliness. If he thinks he could lose he will go full on crazy and there will be no limits to the outrageous behaviour he is likely to demonstrate. I think the TV Debates are going to be truly nuts.
And of course with the C19 nonsense continuing we have loads of reasons for Markets to take a wobble (sorry, I mean ‘excuses’ rather than ‘reasons’). Last Week Really not a lot happening and Markets seem pretty choppy and you can see volumes are low which drives this lack of excitement. It’s one of those Markets where you get some nice Gainers but then your Losers offset it and not a lot of progress is made. I am not too stressed about this and I totally accept that flat and dull Markets are all part & parcel of the game we are participating in and when we next get big falls, we will be wishing we had the dull flat times again !! Or maybe not. To be honest, I think nasty down Markets are hugely more ‘enjoyable’ and certainly more entertaining and challenging than when we have these turgid sideways grinds. Of course my favourite is those sadly rare periods of rampant Bull enthusiasm !! (on the assumption that I am fully invested beforehand – they are not so much fun if you still have a lot of Cash sat on the side……) Anyway, my Portfolio was literally flat on the Week and for the Year to Date since January 1st my Portfolio is down 1.6%. It is taunting me big time to be so near to Breakeven again, but I am resigned to thinking it might be a little while before I get back there. I am pretty sure a Pullback of some size is coming and I am really just sitting on my hands and tracking the Indexes to see if I need to add to my Hedge via more FTSE100 Short or whatever I decide to do. It strikes me the US Markets are hugely pumped up now and seriously need a healthy Correction and they could make excellent Shorts if the timing is done well. I am in no mood to buy any Stocks and I am happy to let things play out whilst we head towards September which is notoriously the Worst Month of the Year. WheelieBash 2020 An extremely pleasant recent visit to the White Hart at Winkfield involved a chat with Phil the Landlord about what we could do for the WheelieBash this year, in light of all the Lockdown Rules etc. Fortunately, we will be able to do something but numbers have to be restricted to 30 in case the weather is unusually dodgy and we are all forced inside where of course ‘Social Distancing’ is harder to do. At the time of typing this we have a few places remaining so if you want to come then make sure you grab your slot – the best way is to DM me on Twitter or to send me an email at [email protected]. Oh, I am sure it would help if you knew the date and we are going for Saturday 5th September. You can see more about the White Hart here: https://www.thewhitehartwinkfield.co.uk/ As usual attendance is FREE and you just need to rock up when you like (I will probably get there about 12 noon ish) and you can stay as long as you fancy. We tend to get a great crowd with a total mixture of ages and skill levels and Newbies in particular will feel right at home and no one judges anybody or anything like that - it is a superb atmosphere of like-minded people who are all trying to do their best to take on the Markets and extract some dosh out of them. It is very much a shared endeavour and an almost unique opportunity to meet up with many outstanding Investors and Traders who are more than willing to share their knowledge and experience. The White Hart is not far around the corner from Legoland and not far from the centre of Windsor and there are Hotels in many nearby locations even in good old Slough, and in previous years several people have travelled from far-flung places and made a weekend of it. There is a Car Park at the back of the Pub but it is pretty small really and has a horribly tight passageway to get to it. You might be able to park across the road in front of the Church and I am sure you can park further into Winkfield village. If you go to the ‘Events’ page which is somewhere on my websites (I think it is on WD2 so you should be able to find it from the Dropdown Menu up above this Blog you are reading) you can see pics from WheelieBashes of previous years and I am sure that even with the limitations that we must follow, it will still be a very worthwhile and fun event. From the Depths of Time As always you can find the full list of Blogs I have bashed out on the ‘Blog Index List’ which sits on WD2 and there are Links to all the Educational ones. The Link below should take you to a 3-parter on psychology and how it impacts our Portfolios and you can find Links to the first 2 parts at the top of this one: https://wheeliedealer.weebly.com/educational-blogs/maybe-were-not-in-control-after-all-part-3-of-3 I tend to find that psychology is often the last thing that Investors move onto as their skills and experience develop up the learning curve. It is well worth the effort to get better understanding though because it can have such a huge impact upon how successful we are. Getting some sort of mastery of the subject, and in particular our own emotions, can help us ‘enjoy’ the Markets a lot more and leads to far less nasty surprises as the Markets catch us out. Blog Slate A few days ago I published an ‘Educational Blog’ on WD1 which looks at the general principles and the specifics behind how I time my Buy Trades when picking up a new Share or adding to a Share Position I already hold. I am sure Readers will find this very useful, especially if you are quite new to the whole enterprise of trying to create wealth from the Markets. During the last Podcast we put out I remember bringing up the concept of our ‘Opportunity Set’ and I wrote the early stages of a blog about this many years ago but never really moved it forwards. From a quick look before I started work on the blog I am typing now, I noticed that it is in a pretty good state so hopefully if I put some focus onto it I can make that the next Educational Blog that I put out. If you haven’t heard the latest Podcast, TPI 29, then if you go to the ‘Twin Petes Investing Podcasts’ page on WD2 you should find a Widget to play it directly from the webpage. After that one I have no idea what I will work on next but I am sure something will enter into my mind. I also noticed whilst trawling through what I had in my Blog Drafts and Ideas document that I have loads of Ideas written down so I should be able to find something I want to write about. I really am rubbish at writing stuff when I have no enthusiasm for it !! Time for the Charts then……. S&P500 As per usual, all the Charts I show are taken from SharePad as screengrabs and if you click on them (and if I have loaded them to the website correctly !!) then they should get larger on your Screen for better viewing of the details. As always I am starting with ‘bigger picture’ stuff and my Chart below has the Weekly Candlesticks for the S&P500. First up of course we must note that a new All Time High (ATH) was made on Friday and we can say that 3400 is now the Key Resistance Level that needs to be broken through. If the Price can Breakout over 3400 cleanly, this would be a very Bullish event and suggest yet more gains to come – but that would fly in the face of the Relative Strength Index (RSI) Levels which I will show in a minute. I often notice that these sorts of psychological and focusing Chart Levels are often ‘tagged’ before the Market then turns in the other direction. My Blue Arrow is pointing to the Candle created last week and it could be construed as a ‘Bearish Hanging Man’ but we need to be careful because there have been others on the way up. However, on the flipslide, we are now much higher and the run up from the Market Lows back in March have been utterly astonishing – I doubt this is sustainable much longer without some sort of Consolidation – be it a Price Pullback or at least a prolonged Sideways move. My Black Line marked by the Black Arrow is Support at about 3233 and my Red Line (Red Arrow) is Support at about 2965 – these are important Levels if we do get a Pullback. Thinking about the Big Picture, the Monthly situation is at a key juncture – so far for August we have a Big Up Candle and that makes the remaining Trading Days of August very important. To get a Bullish Candle for August on the 31st, we need a decent week next week. If there is a drop we might get a bit of a ‘Bearish Shooting Star’ but that would need quite a fall. We shall see but it is something to be aware of (I won’t show the Monthly Candles this week but no doubt I will be covering them soon !!). 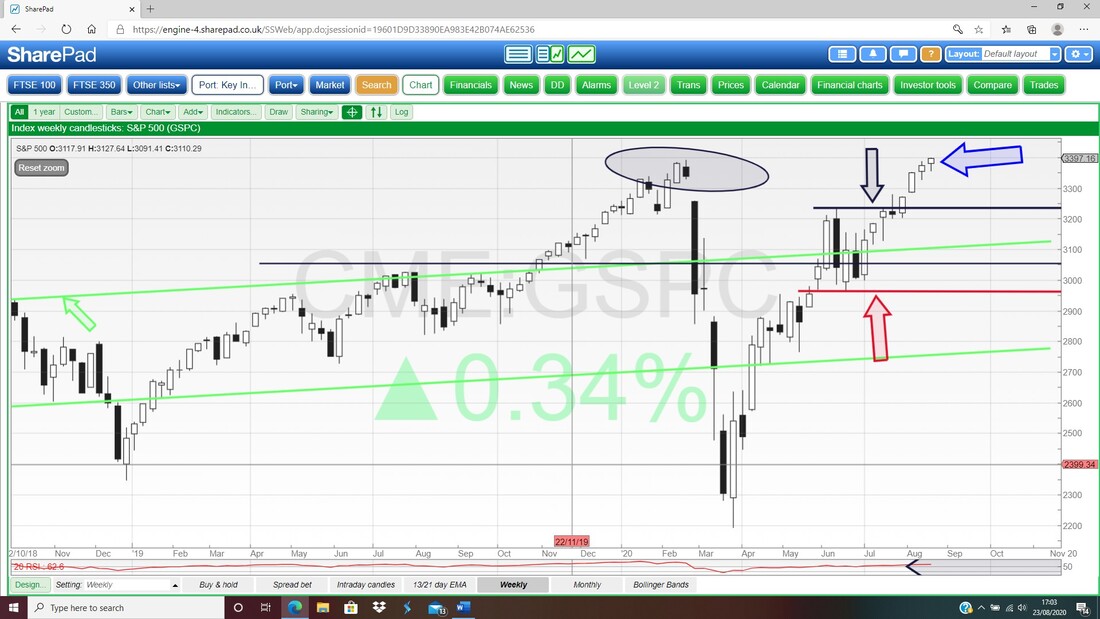
In the bottom window on my Screen below we have the RSI for the S&P500 Weekly and where my Black Arrow is we have a Reading of RSI 61 which is not all that high. However, we can sometimes be overbought on the Daily RSI and get a Pullback but that then just adds fuel for the Rally to continue and does not necessarily contradict the RSI on the Weekly – we will look at the Daily in a bit.
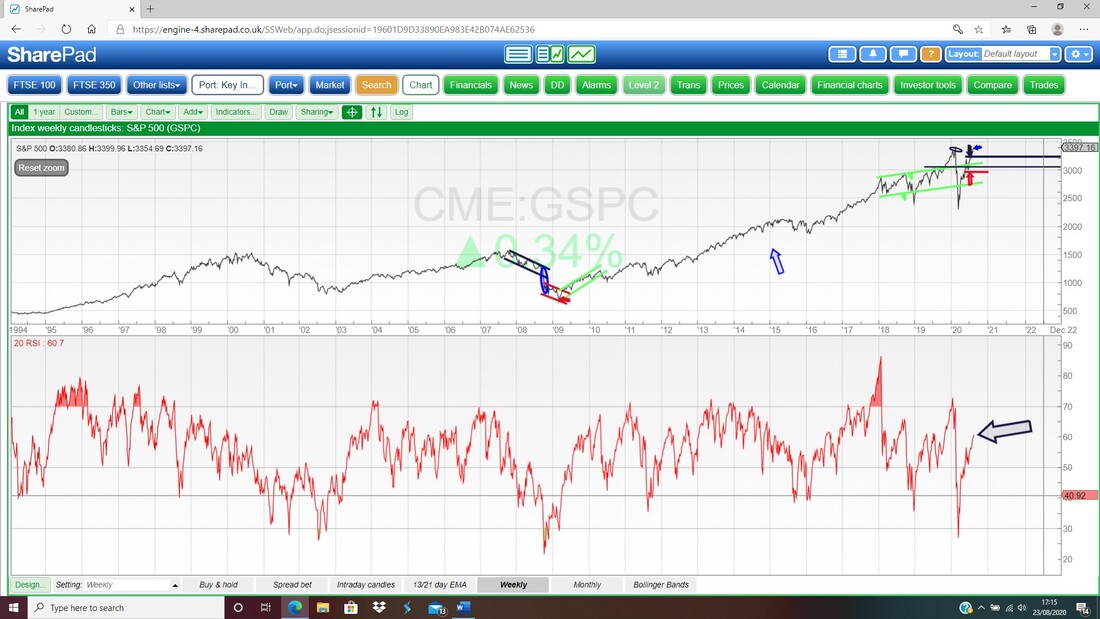
OK, next up is the Daily RSI for the S&P500 in the bottom window. Where my Black Arrow is we have a Reading of RSI 71 which is overbought and suggests that immediate upside is limited. Note also that there is a bit of ‘Bearish RSI Divergence’ as with the Nasdaq Composite Index if you go back a few Months – see my Blog from last Weekend for more details on this.
Next up what I see as probably the most important Technical Indicator I use. My Blue Arrow is pointing to where we are very much in ‘Bull Mode’ on the 13 and 21 Day EMA Lines (Exponential Moving Averages – where the Black Line is the 13 Day EMA and the Red Line is the 21 Day EMA) after we had a ‘Bull Cross’ back where my Red Arrow is. Just look at how if you had put on a Long Trade on the S&P500 soon after that Bull Cross, then you would have made a lot of Money ‘simply’ by staying in the Trade according to the Signals the 13 and 21 Day EMAs gave you………
Note also that where my Blue Arrow is the Lines are actually quite far apart – this alone suggests we might need to see them come together a bit just to take some ‘heat’ out of the Market. That wouldn’t need anything dramatic and just a bit of Sideways for a week or so would unwind this unnatural situation. However, everything changes if we see a ‘Bear Cross’ which is like what happened where my Black Arrow is – and look how predictive that was !! 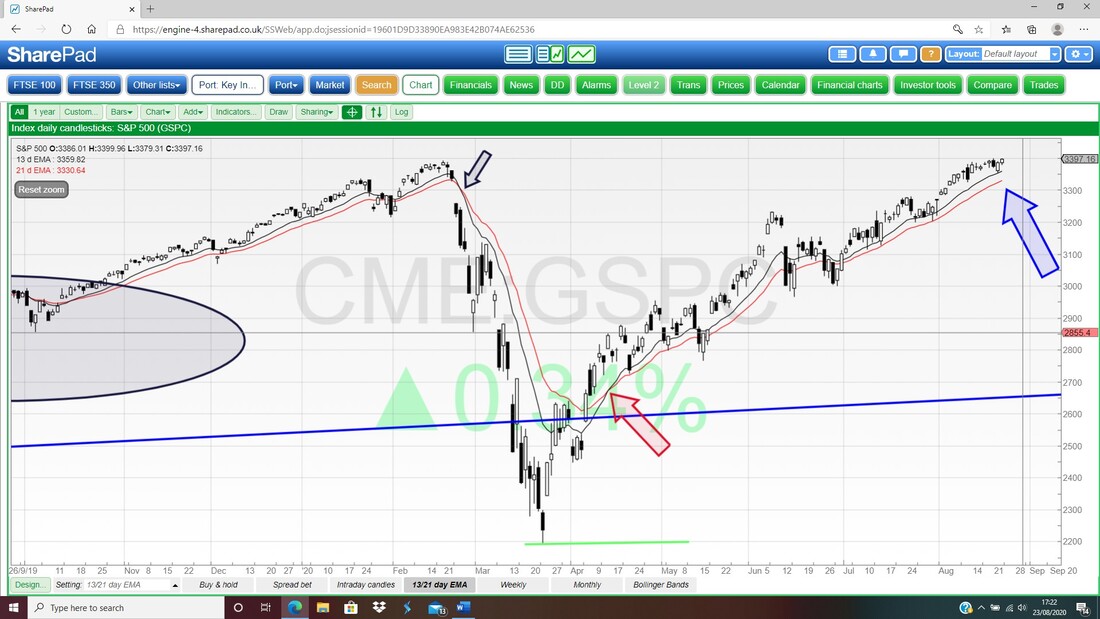
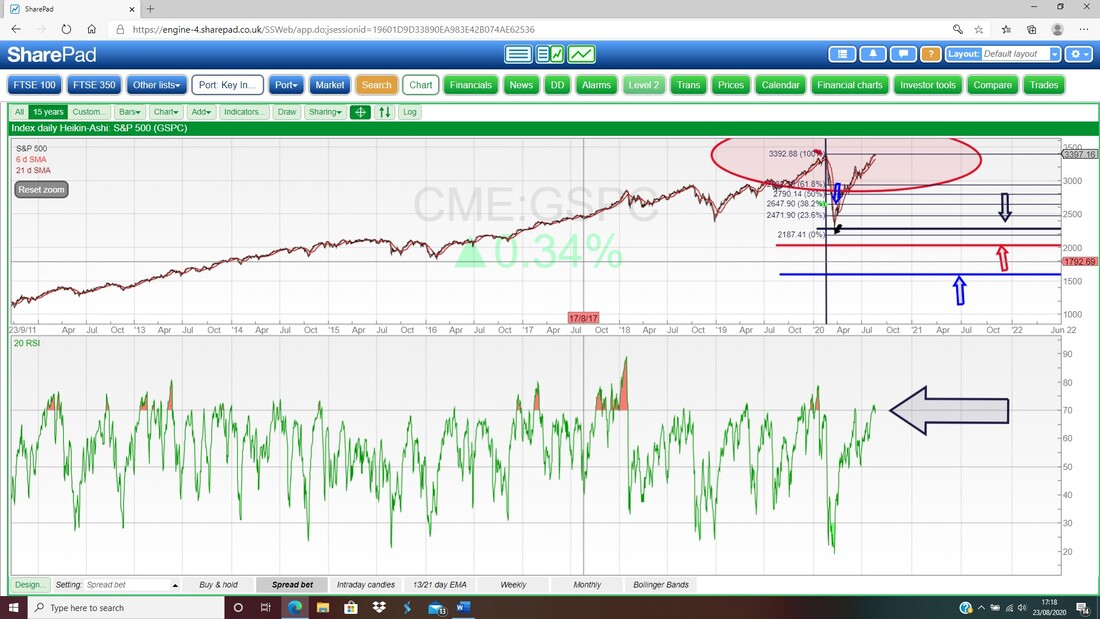
The next Chart is interesting. This has the Daily Candles for the S&P500 and the Pink Zone marks the Upper and Lower Bollinger Bands. Where my Black Arrow is I am trying to point out that if you look at the Bands, they are tightening and moving closer together – this tends to mean a ‘Sausage Squeeze’ (you won’t find that in a textbook unless you are reading about Meat Products Factories) and that usually resolves in an Explosive move – but it can be Up or Down !!
I won’t show the Charts but I note the Nasdaq Comp is not squeezing its Bands in the same way but the Dow Jones Industrial Index (DOW) is. 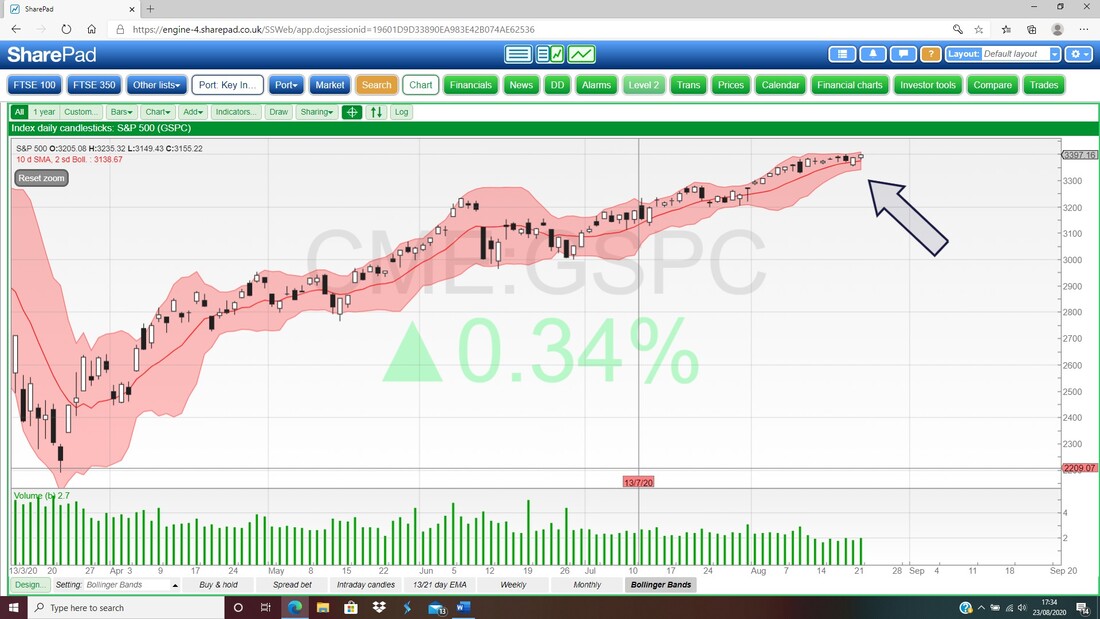
FTSE100
I tend to find that the FTSE100 is impacted quite a lot by the Oil Price, but I won’t show Oil this weekend. However, I see there was a big Down Candle on Friday for Brent Oil Composite but it has been in a Sideways Range for quite a while. As always we need to keep an eye on the Oil Chart and the Weekly does have some hints that we might get a Pullback soon – it is not convincing though yet. If you go back to last Weekend’s blog then I cover Oil there and it has not really changed a whole lot. My Chart below has the Weekly Candles for the FTSE100 and my Blue Arrow is pointing to a sort of Doji Candle for Last Week but note it has turned down off of a ‘Bearish Shooting Star’ shaped Candle from the week before. If that is a Turning Point, then the ‘Pivot’ is at 6297 and that is Resistance to the upside. Mind you, the context for a ‘Bearish Shooting Star’ is not great there so all we need to do is focus on the Support and Resistance Levels. In terms of Support, 6000 is clearly an important psychological level and below this we are looking at 5857. If we see a Daily Close below 5857 in a convincing manner, then I will likely Short the FTSE100 a bit more to Hedge my Portfolio to an extent (I already have a Small Short on the FTSE100 – see my ‘Trades’ page for details). 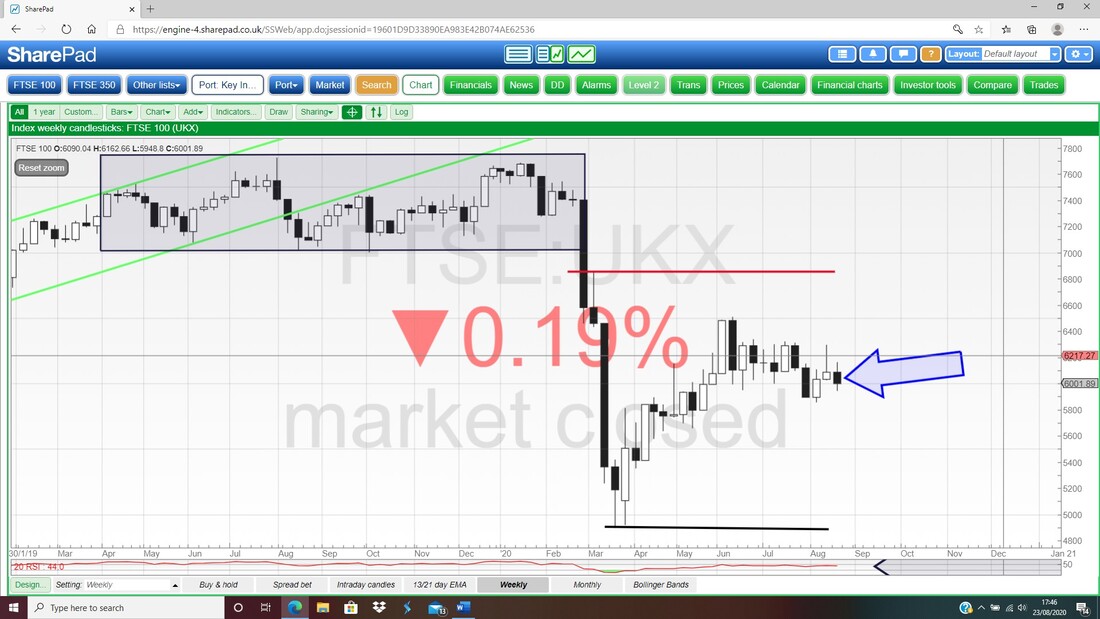
More interesting stuff on the next Chart. This is the Monthly Candles for the FTSE100 and my Red Arrow is pointing to the forming up Candle for August. Note, this is not yet valid because it needs to be a full Month but the way it is shaping up (with one week to go) is not looking too good and suggests another ‘Bearish Shooting Star’ kind of pattern.
Note the Candle for July was big and Bearish and this turned down off a ‘Bearish Shooting Star’ for June – that is not a pretty looking set-up if August turns out ugly. And as things stand, even if the FTSE100 goes nowhere for a week, this will form a Bearish Candle – the only way to avoid it would be a good Rally in the coming week. 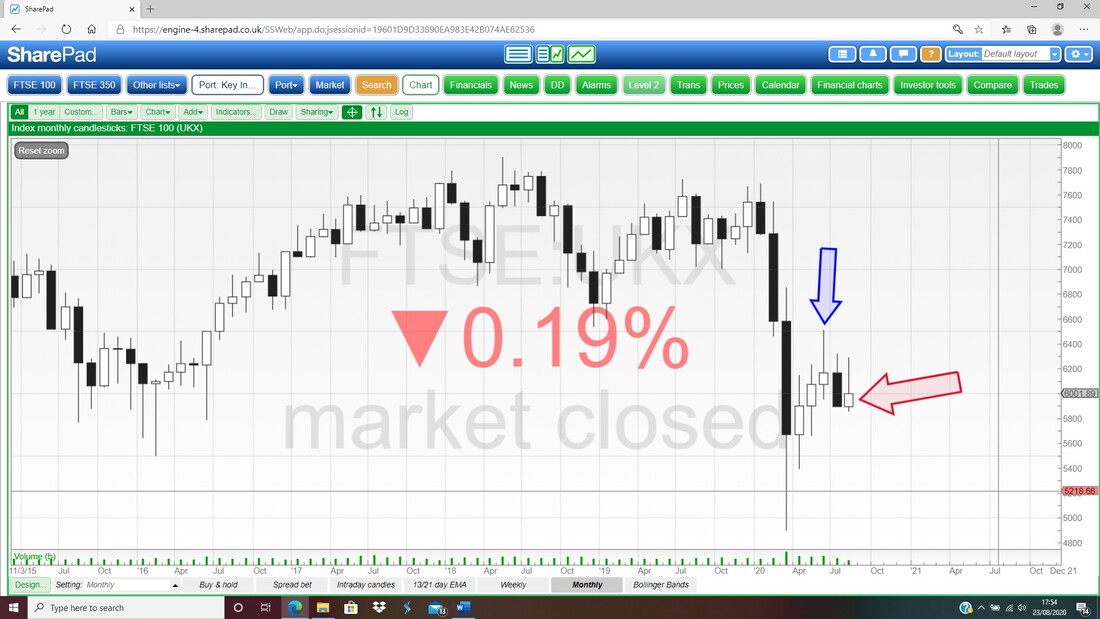
My next Chart has the Daily Candles but really I am more focused on the 13 and 21 Day EMAs. Where my Black Arrow is we had a ‘Bear Cross’ and where my Green Arrow is you should be able to see that this is still ‘in force’ and despite an effort by the FTSE100 to move towards a ‘Bull Cross’ about a week ago, it has failed, and the 13 and 21 Day EMAs are moving apart.
My Blue Ellipse is trying to point out a possible Bullish Hammer sort of Candle from Friday and this suggests the FTSE100 can move up but my hunch is that it will rally a bit then drop again. For me to turn Bullish, I would need a significant Breakout over Resistance at 6162 firstly and then 6300 – that may be a big ask. Whilst the 13/21 Day EMAs are in Bear Mode, I am much happier being Short. Support from the Candle on Friday is at about 5948 and this is important near term now. 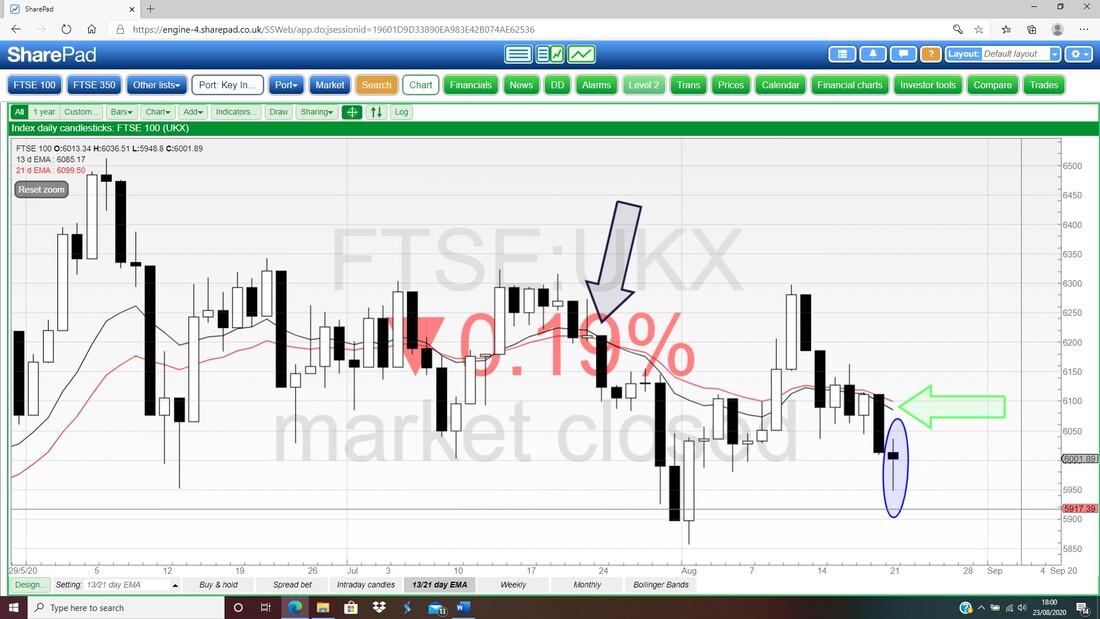
Next up this is technically sweet because my Blue Arrow is showing how the Daily Candle for the FTSE100 on Friday ‘tagged’ the Bottom Bollinger Band before moving up again. Something to watch now is the Bollinger Bands Midpoint Line (Red Line) which is at about 6110 – this is likely to be Resistance.
I haven’t shown this all that clearly but look in the bottom window at how the Volumes have just been falling away as the Green Bars get smaller. 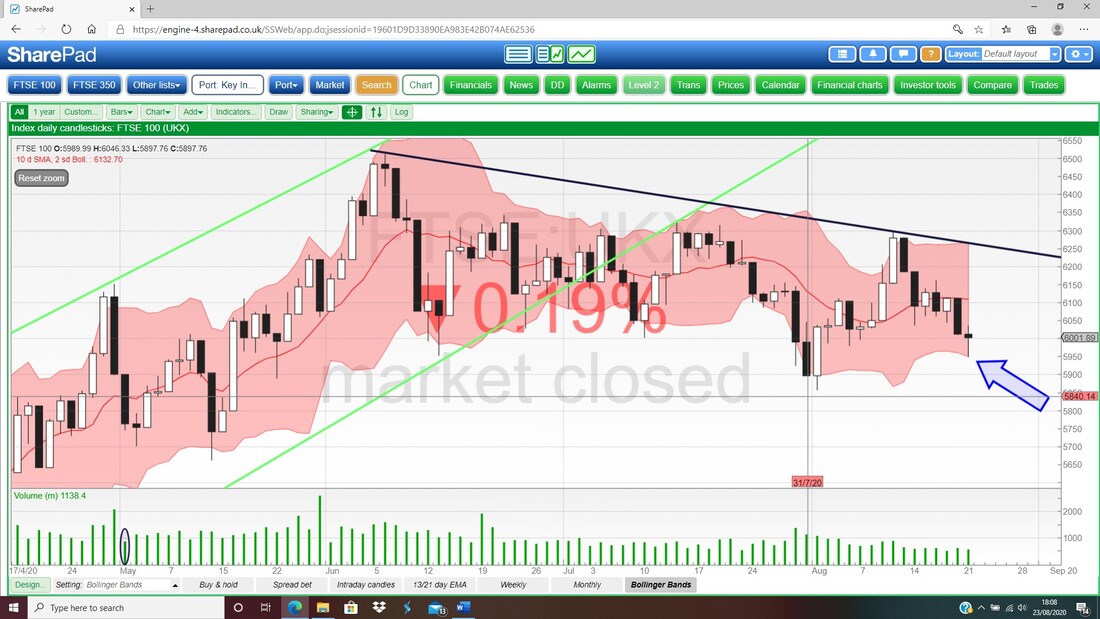
I won’t show it but the RSI Readings for the FTSE100 Daily are at about 43 which is a bit below the Neutral 50 Level but a long way from the ‘Oversold’ RSI 30 Level. This suggests if we do see weakness then there is a fair way to drop.
De La Rue DLAR I have seen quite a lot of chatter about this one on Twitter and I note that Michael Taylor @ShiftingShares covered it in his ‘The Trader’ column in this week’s ‘Investors Chronicle’ on page 20. Fundamentally it is not a business I am at all interested in and I have obvious doubts about the future of a physical cash company and if anything I am much more eager on ePayments plays and hold both Paypal $PYPL and Bango BGO to get involved with this theme. I am not all that close to the story on DLAR and perhaps there is a bit of short-term bounce to be had but it strikes me a huge fundamental rethink of the business model is needed. I do find the Big Picture for DLAR interesting though and my Chart below goes back 8 years or so and where my Black Line and Black Arrow are there is clearly very strong Resistance. 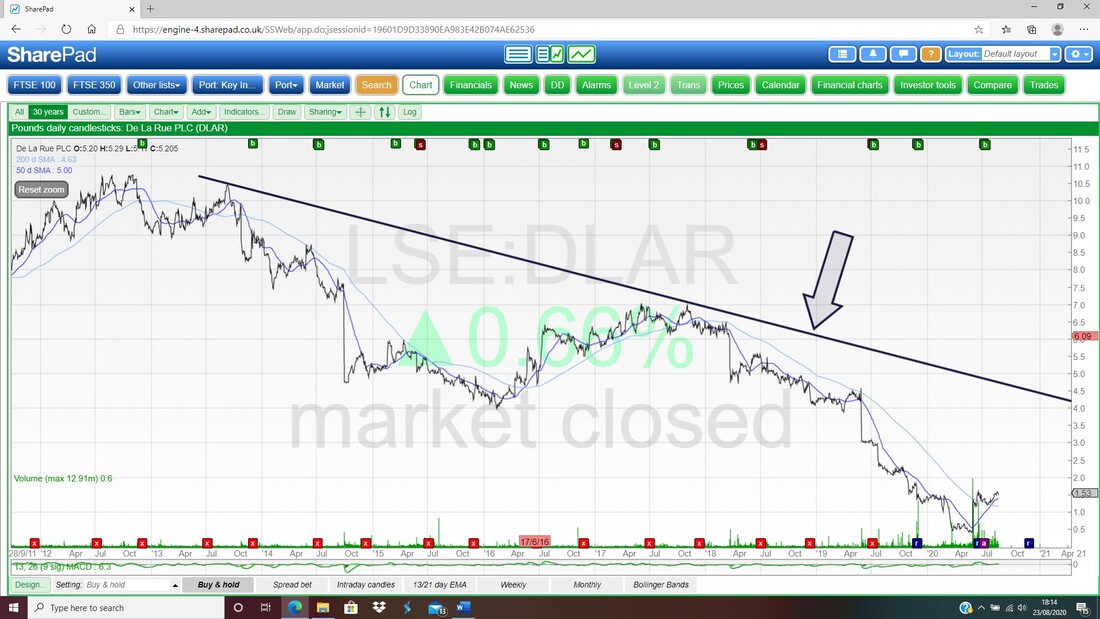
My next Chart has zoomed in a bit and we now go back about 3 years or so. The Black Line is exactly the same as from the Chart I just showed and now my Red Line (marked by the Red Arrow) is important Resistance to watch for. This suggests Resistance at about 225p but before that it looks to me like the much more recent High at about 180p needs to be Broken Out above – that might be difficult. The current Price is 153p.
Note also there is a Bullish ‘Golden Cross’ between the Darker Blue 50 Day Moving Average and the Lighter Blue 200 Day Moving Average Lines (where my Blue Arrow is). However, this is not the most reliable Indicator as it is a bit ‘slow’. OK, that’s it for this blog – good luck in the coming week and get out and enjoy the arse end of Summer !! Cheers, WD. 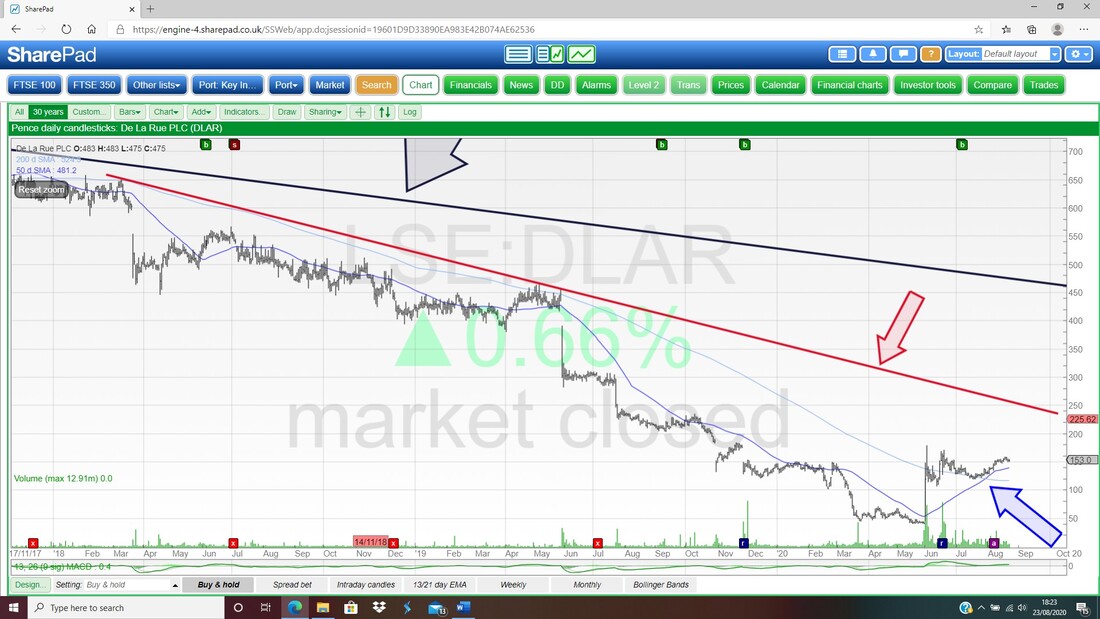
2 Comments
Lee
8/25/2020 11:28:08 am
Thanks Pete another good read. I've tried shorting and going long on the FTSE & S&P500 in the past but never had any joy. I've always seemed to get the timing wrong & get stopped out. Since reading some of your blogs & working my way through 'Candlestick Charting for dummies' I certainly feel more equipped to get it right this time (and realise how dumb I’ve been in the past thinking I could make money doing it). I'm watching out for the 13/21 day crosses.
WheelieDealer
8/28/2020 02:18:13 pm
Hi Lee, Leave a Reply. |

Stocks & Markets WheelieBlogsThese tend to be more Markets and Stocks related and timely - the Blog Page on the Main WheelieDealer Website has the 'Educational' stuff (well that's the theory anyway !!). Archives
October 2021
Categories
All
|
