

|
stocks & Markets blog |
|
I’m starting this blog much later than I usually do on a Sunday night simply because I just seem to have been chasing my tail all day and getting nowhere. I guess watching hours and hours of MotoGP from Valencia didn’t help but it was the last race of the season and the final race for the legend Jorge Lorenzo who is retiring at the ripe old age of 32 after 5 world championships. I have several subjects etc. I want to cover and I also want to shove some Stock Charts in so I need to attack it with much gusto.
Last Tuesday I went up to Chiswick for the Mello Event and had a really fun and useful day out. I ended up leaving after 10pm and totally lost track of time although of course the big advantage was that traffic was very light on my way home to Windsor. It was great to meet up with loads of people that I have met over the last 5 years of doing the WD thing and these Events are increasingly a big social occasion where loads of us meet up from all over the country – the Company Presentations and stuff are much appreciated from what I can tell but the social side is also a huge attraction and a good reason to take advantage of these opportunities to meet up with like minded people and to bounce ideas off them and suchlike.
On a more lamentable note, the downside is that I never seem to manage to talk to all the people I would like to. A particular case occurred just before Peter @Conkers3 and myself were due to a do a ‘TPI Live’ session in one of the rooms and I had nipped quickly to the loo and got distracted and started chatting to a group of people I knew and would have loved to have spent more time with. Of course I forgot totally about the imminent TPI gig and next thing I know Peter is grabbing me and we rushed to the room only for me to get a huge shock with the room being totally rammed and the heat literally hit me as I entered.
We had some trouble getting me through (good job my Wheelchair is not particularly wide !!) with lots of people having to move chairs and stuff and then finally we got to the front of the room and it dawned on me that I had left the notes I had scribbled down on a piece of paper in my jacket and that was nowhere to be seen. So I felt a bit exposed but luckily Peter did his usual brilliant job of doing the compering type role and quickly kicked things off and somehow I managed to pick up the thread and run with some discussions about Vodafone VOD and Ixico IXI but I did feel like we were just getting into our stride and warming up when the session had to end because the next bunch of Presenters were due in the room. So I came away feeling that it had not gone all that well but the feedback we got afterwards from lots of people who were in the audience was that they really enjoyed it and they thought Peter and myself were ‘bouncing off’ one-another really well – which is weird because I thought we were barely in sync and it was only towards the end where we were starting to click and flow more naturally. We got some great feedback on Twitter as well and that is highly encouraging and a big motivation for us to keep the Podcasts coming and to try to improve everything about them as much as we can. As I was wheeling out of the room feeling a bit perturbed that the session had not gone all that well, several people were asking me where they could hear the Podcasts – that was really wonderful to hear and again a big boost to our inspiration to push on with future TPI episodes. Anyway, a big THANK YOU to everyone who attended the TPI Session and also for all the feedback you have given and for continuing to encourage us – it is much appreciated. If you are wondering what on earth I am going on about, you can find the TPI Podcasts on Apple and Audioboom platforms under the ‘Conkers Corner’ channel and on Soundcloud you can find ‘Twin Petes Investing’ here: https://soundcloud.com/user-479955511 In addition, on WD2 there is a page entitled ‘Podcasts’ where you can find links to the new ones we produce as they come out. Last Week A welcome change for me with my Portfolio gaining 0.6%. There was some drag from the S&P500 Short Hedge I have on and I was hoping to close this last week but I didn’t get it done. I will look at the Charts in due course on this blog and my current thinking is that even if I don’t close all of the Short I will halve it or something. I expect to get that done in the first few days in the coming week. I think my Stocks did quite well on the Week especially on Friday where a lot more Stocks seemed to be up than down. For now I am thinking of keeping my FTSE100 Short running especially with the drag of the General Election but again I am keeping a close eye on the Charts. I noticed a story just now that the Tories have a massive lead in the latest polls – that is surprising but I guess the Public aren’t easily conned by Labour’s utterly lavish splashing of the cash and ‘Free’ Broadband. There are a few things I am considering regarding my Portfolio. Firstly it looks like the Entertainment One ETO bid is a ‘done deal’ and I might as well sell in the market. I was hoping for another Bidder to emerge but it has been quite a while now and there is no sign of it. I would be annoyed if another Bid does appear after I sell but I think that is quite unlikely now and I would like to get the Cash and avoid the small risk that the existing deal may come to nothing. Something else I have been mulling over is the idea of buying Gateley GTLY for my Income Portfolio. You may have seen that I did a detailed Blog on GTLY and I quite like it but with a Dividend Yield around 4.7% and a fairly defensive nature, it might actually be a good fit for my Income Portfolio rather than something for my ‘Normal’ Portfolio. Having said that, one obvious drawback to this theory is that I like to buy larger Stocks in my Income Portfolio and GTLY is really a relative tiddler – so that is a bit of a catch. I am not sure – I will think about it more but I do want to buy some GTLY at some point soon. In addition to this I keep thinking about the Computer Gaming sector and it irks me that I don’t have any exposure. I might put a bit of focus into looking at the Stocks available and seeing if any take my fancy – I am sure there must be more value in some of them and it’s clear the sector is red hot. Blog Slate Back on Thursday night I managed to release the blog about IFRS16 Lease Accounting and you should be able to find that on the ‘Educational Blogs’ page which sits on the WD1 website. My intention was to write something quite simple and hopefully I have managed that. I also published a ‘Non-Finance Book’ Review blog about the Russian Tsar Nicholas 2nd which was a very good read – I have several more of these to issue but sadly the blogs are only part written so they need some work. I have also read a few books that I won’t do a full review on because they are more of an entertaining read and a short paragraph or so on the ‘Non-Finance Books’ page should give a good summary of what they are about etc. On Friday night I wrote a Plan for a blog about a particular subject area and I might make a start on that in the coming days in terms of writing the blog although I have another blog in mind related to specific Stocks which I might prioritise – as ever it depends on what I feel excited about doing. I also need to update the ‘Weekly Performance’ page for October but I might leave this for now and do another double-header with the Numbers for November in it as well – let’s see how it plays out. I am off to see Freya Ridings in Hammersmith on Thursday night so that takes away some key time when I am usually working on a blog. Strangely I find myself tending to work on Blogs more in the evenings than during the day – although with Winter grabbing us by the throat I might be less inclined to do other things during the day. Historical Wheelieblogs I still contend that these are some of the most important Blogs I have written and the subject of understanding valuations is something any Investor who intends to be successful needs to master. This is a Link to Part 4 and if you go to the bottom of that one there are Links to the earlier Parts: https://wheeliedealer.weebly.com/educational-blogs/valuation-valuation-valuation-bursting-for-a-pe-part-4-of-4 Now for the Charts then……. S&P500 As per usual, the Charts I show are taken as ScreenGrabs from the brilliant SharePad software I subscribe to and if you click on the images they should grow larger so you can see more details. I don’t think I need to spend too long on the S&P500 because the picture is fairly clear-cut and this is a Bullish chart. The essence is that on Friday it made a new All Time High (ATH) and that can only realistically be seen as Bullish, especially because it doesn’t look over-bought. First up we have the Weekly Candlestick Chart and where my Blue Arrow is I am pointing to a big White Up Candle from last week and this is where it made the new ATH. This is why I want to close my Short because with such Bullishness it is pointless fighting such a trend. 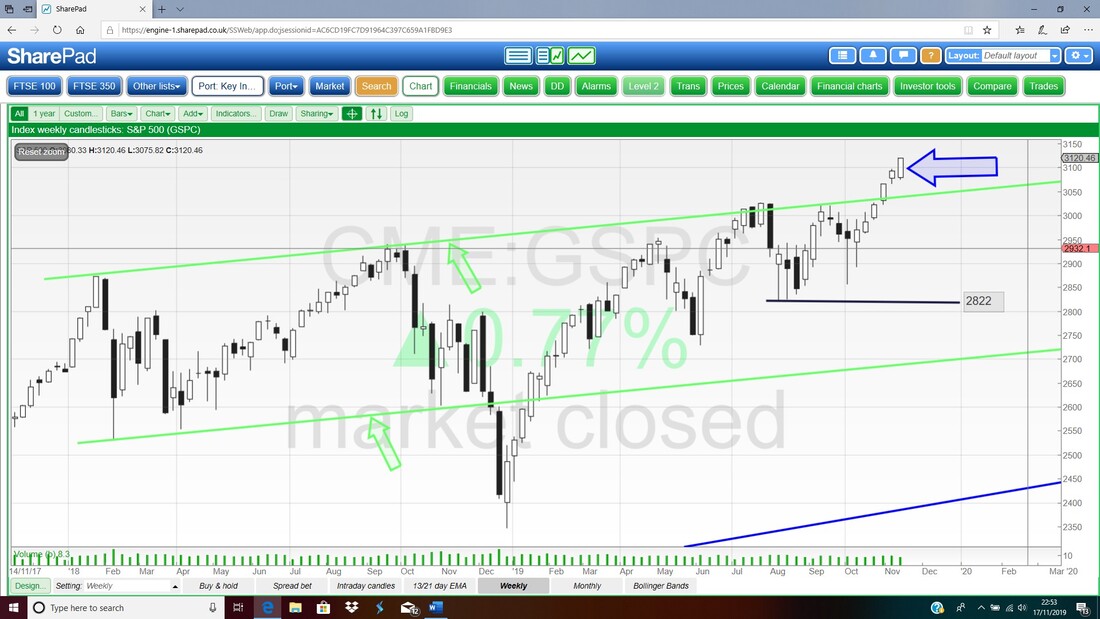
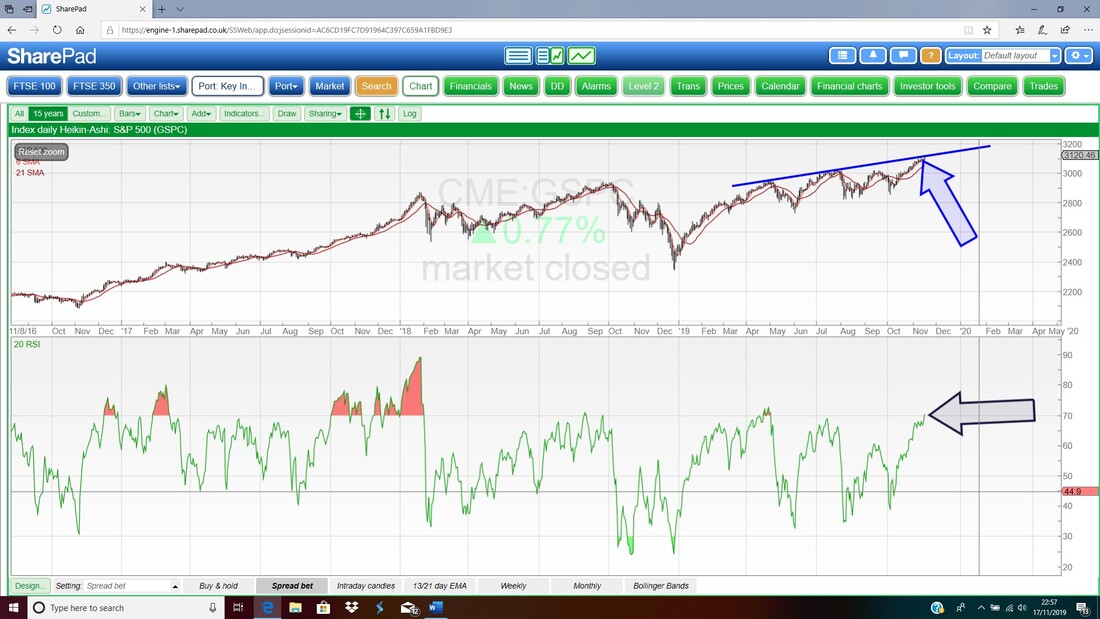
I am now going to contradict myself !! The Chart next up in the bottom window has the RSI (Relative Strength Index) for the S&P500 Daily and where my Black Arrow is we have a Reading of RSI 70 which is actually very high. If you look to the left you can see where it exceeded 70 but it is rare. As a result I will look at the Charts on Monday night and make a decision about whether or not to close my Short at that time – if it is over-bought, we might get a bit of a small pullback soon which would be helpful for closing my Short and reducing any Loss I incur.
Next we have another suggestion that it is a bit over-bought. Here we have the S&P500 Daily Candles and the Pink Zone is marking the Upper and Lower Bollinger Bands (which are basically calculated using Standard Deviations). My Black Arrow is pointing to where the White Up Candle from Friday actually went above the Top Bollinger Band which is an unstable situation and we usually find it drops back or goes sideways.
The DOW and the Nasdaq Composite are quite similar but I won’t show them this week. 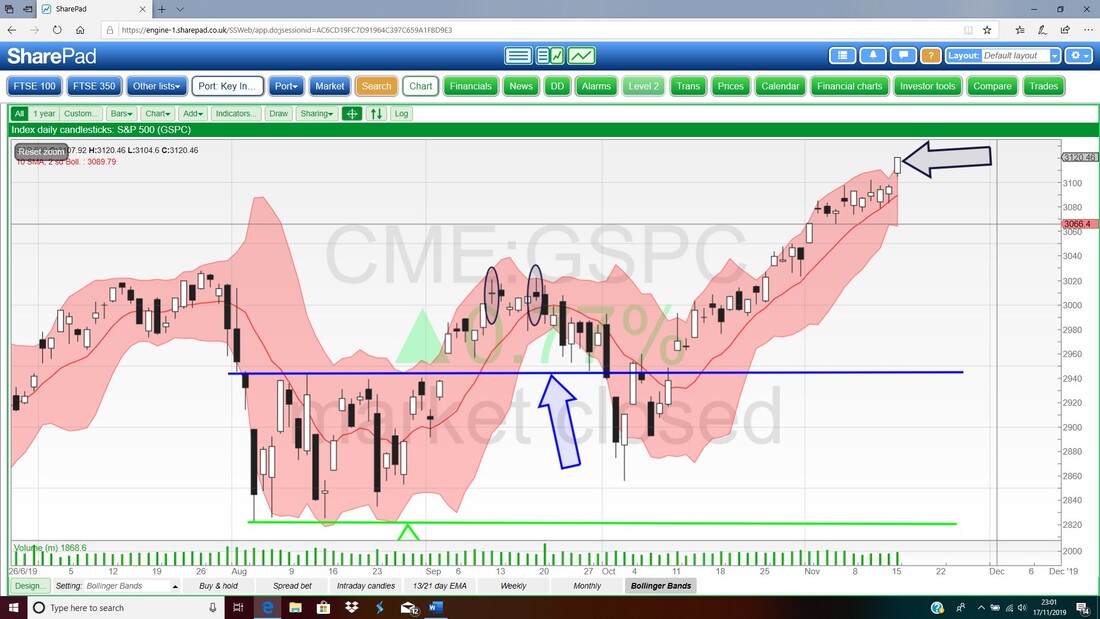
FTSE100
Starting with the ‘Big Picture’, here are the Weekly Candlesticks for the FTSE100 and my Blue Arrow is pointing to a Black Down Candle from last week and clearly this explains part of the gain I made on my Portfolio last week with the FTSE100 Short going my way. Note the fairly long ‘Tail’ on the Candle from last week and this looks to me to be in a Range still which I will cover in a bit. Higher up the Red Curve marked by my Red Arrow is something I have been showing for a few weeks with a possible Bearish ‘Rounded Top’ Charting Pattern which seems to be playing out. 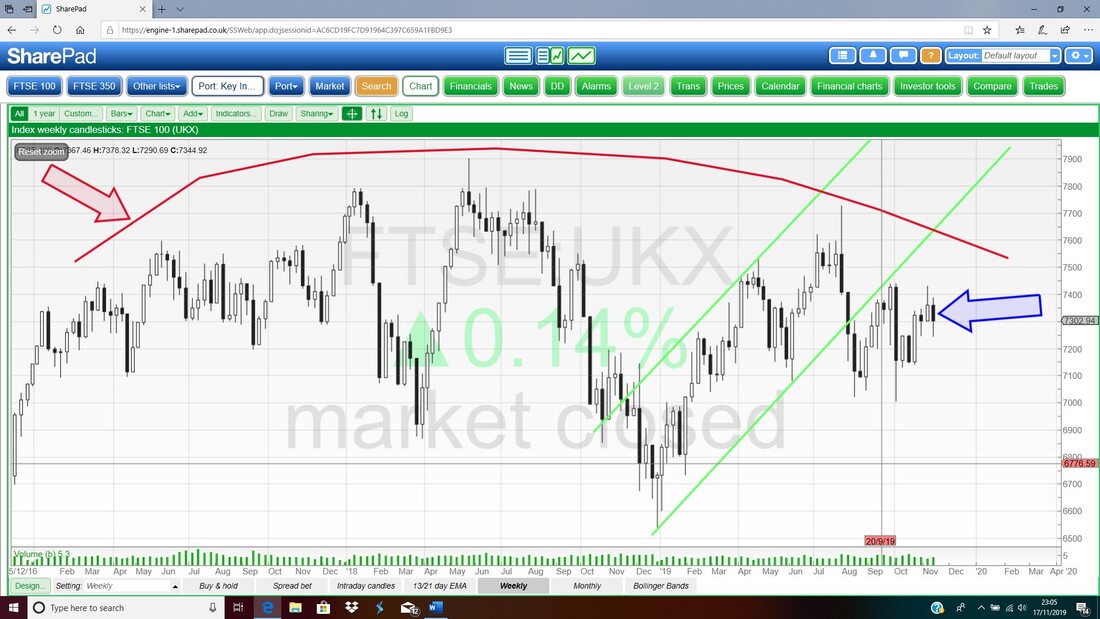
Next we have the Daily Candles for the FTSE100 and this is interesting because the Candle being pointed at with my Blue Arrow is a ‘Long Tails Doji’ kind of shape and note how it is sitting down at the lower Bollinger Band which suggests it might move up soon or go sideways.
On Friday the Low was 7243 so this is immediate Support and my Green Line (Green Arrow) and Black Line (Black Arrow) are marking a possible wide Range between about 7450 at the top and 7000 at the bottom. My Black Ellipse is pointing out a wide Zone of Resistance just up above which might be difficult to get through. 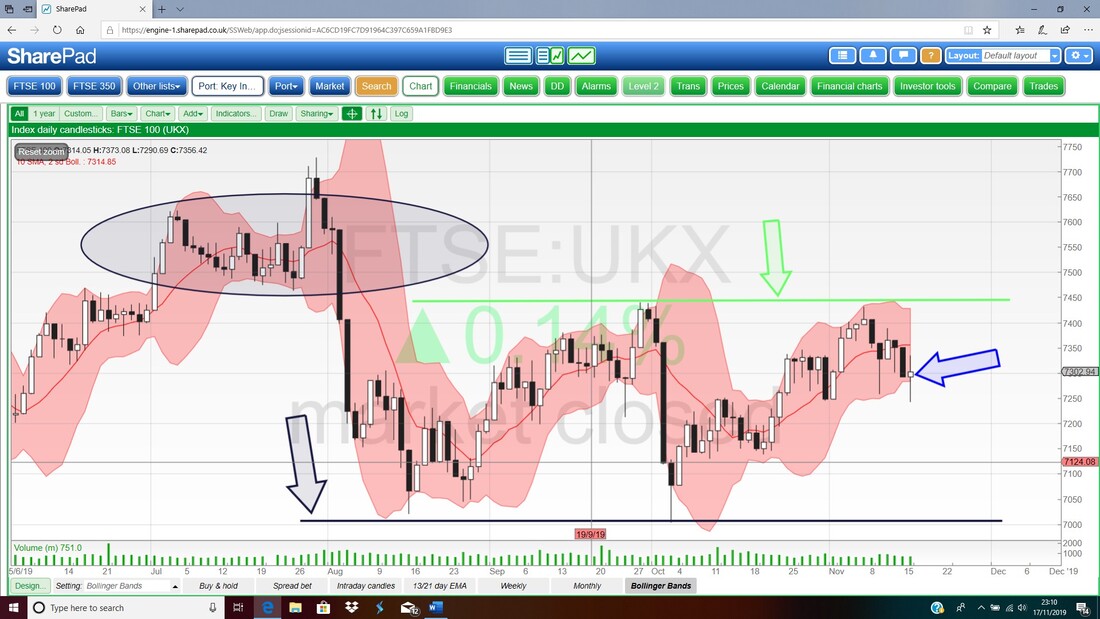
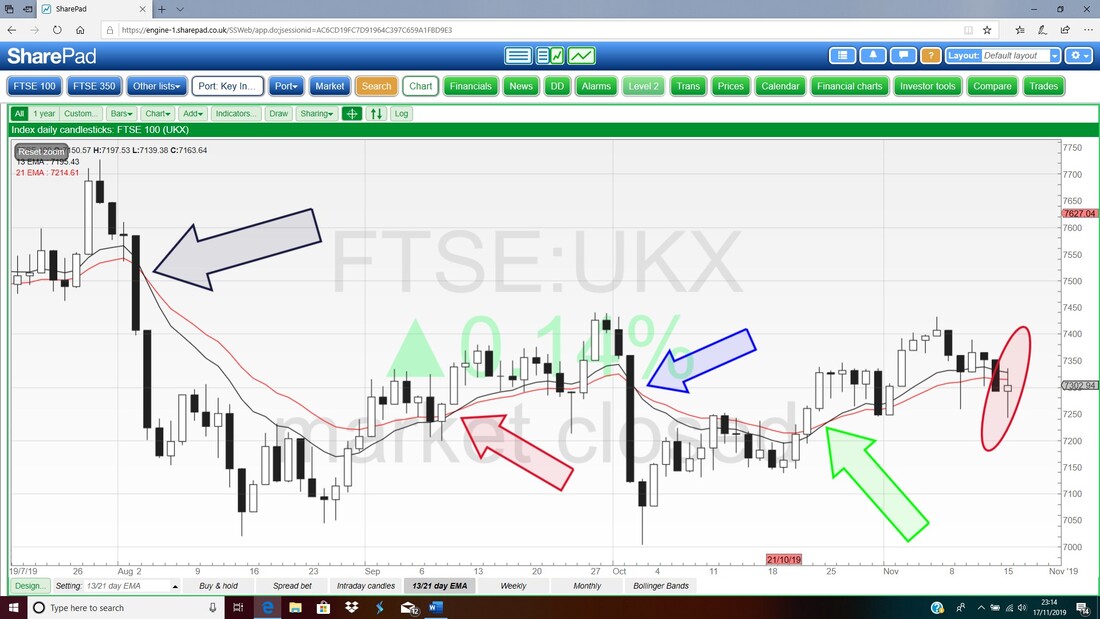
There is something to watch here. My Chart has the Daily Candles for the FTSE100 and what I am really interested in here are the Red Wavy Line which is the 21 Day EMA (Exponential Moving Average) and the Black Line which is the 13 Day EMA. I find how these cross is highly predictive and where my Red Ellipse is we are seeing a situation where the ‘faster’ Black 13 Day EMA is turning down towards the Red 21 Day EMA. We need to watch this because if they Cross soon it would be Bearish.
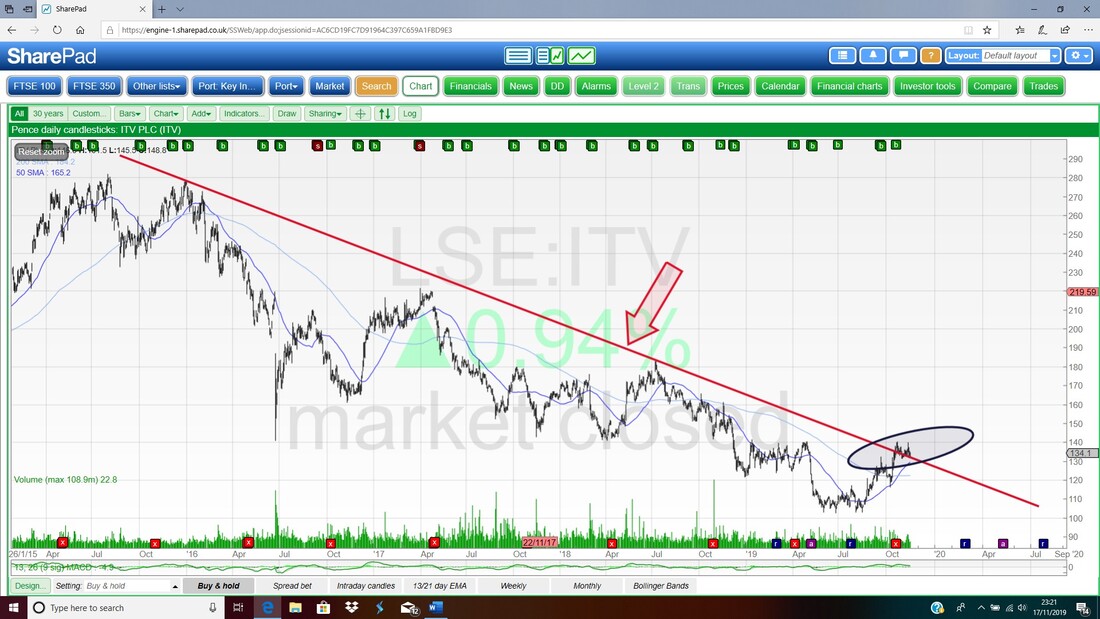
I don’t hold ITV myself but I know a lot of Readers do and I think it is an interesting Chart. My Chart below goes back about 4 years or so and it is easy to see ITV has been in a Long-Term Downtrend. I have marked this with my Red Resistance Line (Red Arrow) and my Black Ellipse is trying to show where it looks like the Price is trying to sneak out of this Downtrend.
On the next Chart I have zoomed in to a much shorter time period and the Red Line here is the one on the previous Chart and my Black Ellipse now is trying to highlight the Sideways move that has taken place over the last 3 or 4 weeks. My Black Arrow inside the Ellipse is pointing to the Resistance which has been hit 3 times at 140p – a Break above this level would suggest more upside and I think if we see 150p properly cracked then the Trend here is really changing. It might be that we go Sideways in a Range for many months but the picture is definitely changing. The only caveat to that is if the Price drops back now and goes below Support at about 130p.
Note also that my Ellipse here could be marking the ‘Flag’ shape of a Bull Flag which is where the Price moves up fast (as happened here) and then we go sideways in a range for a bit before another Jump up. That could be playing out here. My Blue Arrow is pointing to a Bullish ‘Golden Cross’ between the Darker Blue Wavy Line which is the 50 Day Moving Average and the Lighter Blue Wavy Line which is the 200 Day MA – another promising sign. 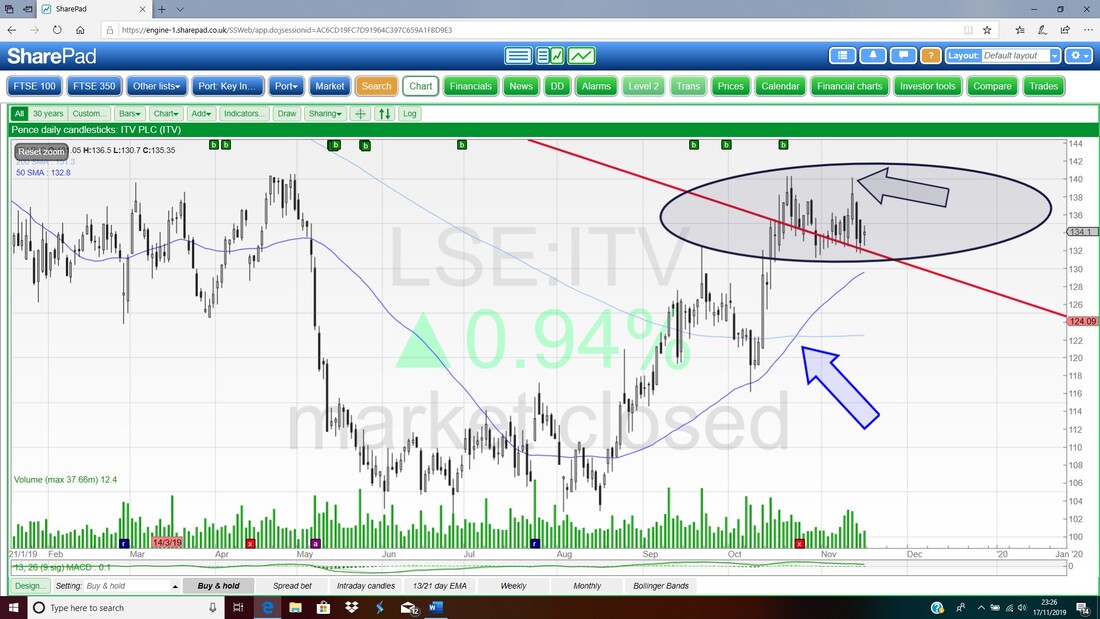
Telecom Plus TEP
I do hold TEP and have some in my Income Portfolio as well for the Dividend which is expected to be 4.4% next year and 4.8% two years out. On my Chart below we had the Downtrend marked by my Red Resistance Line (Red Arrow) and then the Price walked out of this Downtrend and it looks like we now are in a shallow Uptrend Channel as marked by my Green Line and Green Arrow. The bottom Support Line I have drawn looks quite valid but the upper Green Line I have drawn is mostly a parallel line and I have done a bit of ‘line fitting’ here which is guesswork really. Anyway, it looks promising and I am very happy holding TEP. 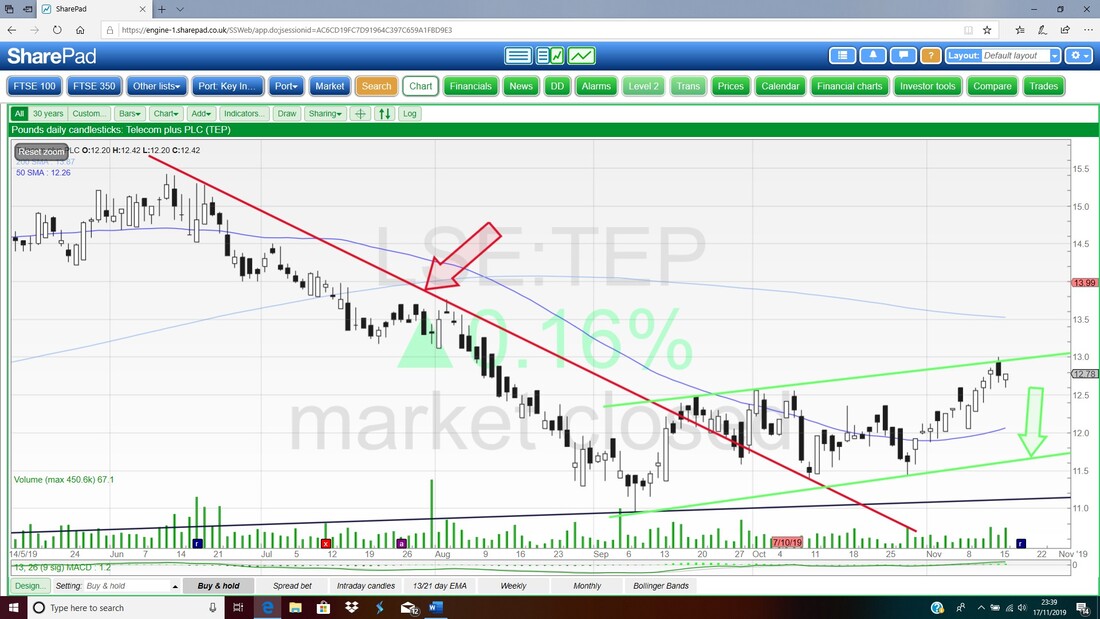
Tristel TSTL
I hold TSTL and I am liking the look of the Chart. It is always useful to look out for Triangle Patterns as they are highly predictive and can result in big moves when they ‘resolve’. On TSTL we have a ‘Flat Top Triangle’ and these are really the best you can get. In this case the Black Line which is at about 342p is Resistance and forms the Flat Top Line (Black Arrow) and my Red Line (Red Arrow) is the Support Line which is the hypotenuse of the Triangle and note how this is ‘squeezing’ the Price and I hope we will see it pop out of the top and the Buy Signal here would be a Close over 342p. If it happens I would expect 400p to come up soon after. OK, that’s it for this week – best wishes for the days ahead !! Cheers, WD. 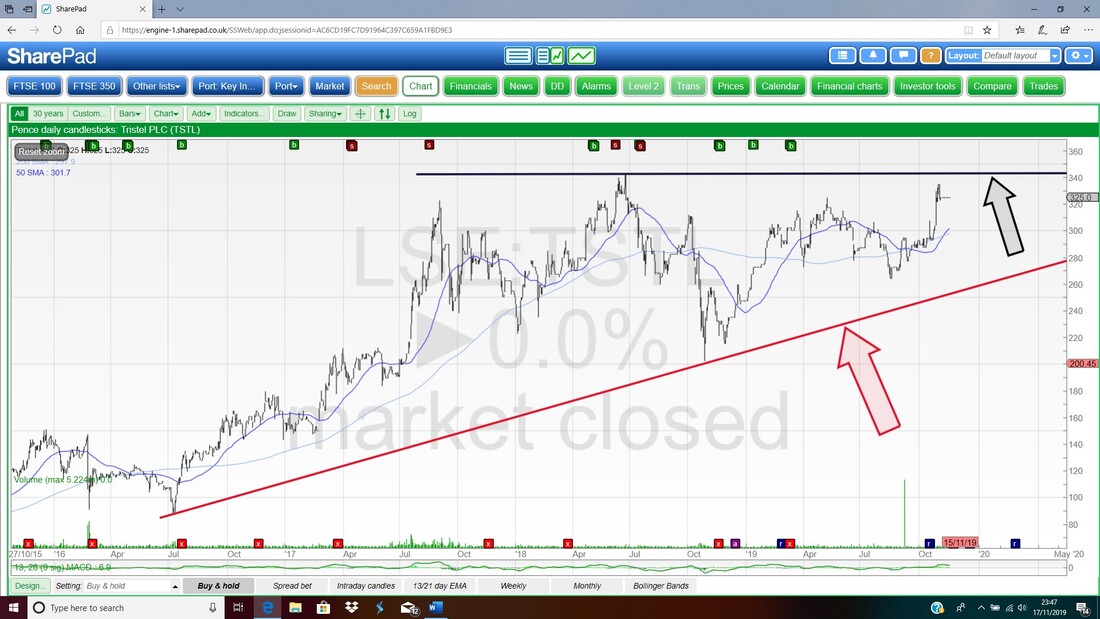
2 Comments
Jean black
11/19/2019 07:07:00 am
As usual very helpful, keep up the good work, Jean
WheelieDealer
11/21/2019 01:28:30 pm
Hi Jean, Leave a Reply. |

Stocks & Markets WheelieBlogsThese tend to be more Markets and Stocks related and timely - the Blog Page on the Main WheelieDealer Website has the 'Educational' stuff (well that's the theory anyway !!). Archives
October 2021
Categories
All
|
