

|
stocks & Markets blog |
|
**SINCE WRITING MUCH OF THE TEXT BELOW ON SATURDAY NIGHT, I HAVE BEEN THINKING THINGS OVER AND WILL MOST LIKELY CLOSE THE LONG POSITION I HAVE ON THE FTSE100 AND DO A SMALL SHORT ON THE S&P500 VIA SPREADBETS AND I MIGHT DO THIS ON SUNDAY NIGHT IF I CAN ONCE IGINDEX REVERTS TO ‘NORMAL’ BETS RATHER THAN THOSE WEEKEND THINGS. OF COURSE PEOPLE WITHOUT SPREADBET ACCOUNTS CAN SHORT THE S&P500 USING THE XPSP ETF AND THE FTSE100 USING XUKS. I AM NOT RECOMMENDING ANYTHING AND IT IS UP TO READERS TO MAKE UP THEIR OWN MINDS WHAT THEY DO.**
The Markets certainly seem a bit moody at the moment – last week was tough going and not hugely much fun. As you will see in a bit, my Portfolio was down a tad and we had quite a drop in the US Markets on Friday and there is certainly a sense that a bit of a pullback is coming. The US seems to be getting a lot more Virus Cases by the day and clearly the chaotic approach to Lockdown and any kind of Social Distancing doesn’t give anyone an impression that the US Authorities, at any level of governance, are in control. If this gets worse and we start getting panics over hospital capacity etc., then it is highly likely it becomes a big issue and it could impact on Markets.
The big uncertainty is how Markets get affected. I tweeted about this on Saturday morning because the usual pattern is that all Global Indexes are highly correlated and they all drop or rise together; but in big sell-offs it is normal for the US Indexes to hold up better and for the UK and Europe to suffer. This was certainly the case in the sell-off of a couple of months ago, but of course at that stage Europe was having big problems in Italy and Spain whereas the US seemed to be suffering terribly in New York but not so bad across many of the States. And the US came out of the strictest level of Lockdowns they had pretty quick and this suggested that the hit to the Economy might be more limited than in Europe where Lockdowns were really draconian.
Now things could be quite different with Europe and the UK perhaps being in a better place with regards to the slow easing of Lockdowns and with the US seemingly having little control and the Virus spreading fast; perhaps this will be reflected in the Indexes and the UK and Europe won’t move as much. Oil is a potential driver and this is likely to be affected by a struggling US Economy if the Lockdowns get stricter again and of course a falling Oil Price is probably going to hit the FTSE100 because of its big exposure to Big Oil stocks. So things do look potentially a bit messy but as always I will be driven largely by the Technicals on the Charts and what they are telling me – and I will look at loads of Charts no doubt later in this Blog. It is important for perspective to realise we are just coming off new All Time Highs on the Nasdaq and there has been a strong bounce since the Lows so it might not be anything like as bad as many fear. There are lots of important Support Levels which must hold and I will point these out when we do the Charts. It is not unusual for the Summer months to be a bit soggy but the typical yearly pattern is for big drops in the Autumn which usually takes the form of big drops starting in mid to late August and then for September to be the worst month and it can happen in October. Following that pattern suggests the immediate weeks ahead might be sideways but quite volatile but as we get to August we need to be super vigilant. There are a couple of specific events this coming week which could move the Markets with the first being an announcement by Boris on Tuesday I believe, which is likely to be some sort of Economic Statement all about boosting the Economy and I would guess that Housing will be a key part of it. Obviously, that could be good for House Builders and Brick Companies etc. and there could be other measures to help specific Sectors with Travel and Hospitality the obvious ones that are desperate for help. Perhaps Autos will get a boost with a Car Scrappage Scheme or something along those lines. Then on Friday we have the US Non-Farm Payroll Numbers which usually come out at 1.30pm UK time and these can shift the Markets in a big way if there are surprises. Last Month it was hugely positive when everyone was expecting very bad news so goodness knows how it will play out this time. We usually get a clue on Thursday with the ADP Jobs numbers I think but it is not something I pay all that much attention to really. Then a week away is the 4th of July Public Holiday in the US and this can have the effect of reducing volumes and activity and it’s yet another reason to be cautious. Last Week My Portfolio seemed to struggle all week and it wasn’t particularly fun. The hit was 2.2% and this means my Portfolio is down 2.9% since January 1st 2020 which I guess is not bad in the circumstances but of course I would much prefer it was positive !! It is important to focus on the big picture and it is how my Portfolio stands on December 31st 2020 that I must work towards and the modus operandi must be to just keep sticking to the process and trying to work as effectively as I can to squeeze out every possible drop of upside whilst at the same time not exposing myself to too much risk or having to do much ‘work’. In light of the sense of some difficulties ahead, I don’t expect to be doing many Trades in coming days and my main place for attention will be on the small Long FTSE100 Position I have and it is pretty likely I will close that Spreadbet very soon. Whether or not I will do an Index Short of some sort is unclear at the moment but if the signs are very clear on the Charts I will be mulling it over. It is likely I won’t Short in big size though if I do decide to Short as I am not expecting a big fall as this is probably more likely nearer to the Autumn. I will judge the situation largely dependent upon what Support Levels on the Indexes get breached and the ugliness of the Candlesticks and things like the 13/21 Day EMAs (Exponential Moving Averages). I am sure I mentioned that I fancied buying more Gately GTLY as a Long Spreadbet to add to my normal Shares position but with the current mood of the overall Markets I am not in a rush and I will be patiently waiting to make a move. Blog Slate A few days ago I issued an ‘Educational Blog’ on WD1 which took a load of Tweets I had sent out very early one Friday morning about my Approach, and I added lots of additional text to flesh out what I was going on about and to give a lot more detail. It is probably well worth reading this if you have not seen it already, and I am pretty sure you will not have seen anything like this anywhere else. I also updated the ‘Little Black Book’ on WD2 on Friday night and this contains loads of ideas for Stocks that I had jotted down in my notebook and you can use these as a starting point for further in-depth research. Also there is the most recent Podcast which is TPI 25 which you can find on the ‘Twin Petes Investing Podcasts’ page on WD2 and it has that amazing embedded Soundcloud file thing which plays directly from the website. I seem to have loads of Blogs partly written although as always I am not sure how many are actually anywhere near completion !! The one that needs a huge amount of work but which is probably getting most focus from me is a ‘Buy Rationale’ Blog on Bango BGO and I have done a fair bit on this but it is probably a couple of weeks away from actually getting published and it is likely to come out in 2 parts. It is a complete mystery to me where all my time goes but I never seem to have spare hours to crack on with much of this stuff and I feel like I am always picking something up and then putting it down again not long after – it is quite frustrating really. Maybe it is Lockdown Fever and lack of Pub Gardens and Beer that is the nub of the problem !! Not only do I have several Draft Blogs in progress, I also have loads of ideas for Blogs which I haven’t even started on yet and it is probably that which grates with me most because there are some cracking ideas there that I really want to get on with but I need to clear the decks first. On top of that we are nearly through June so I will need to be updating the recently revised ‘Monthly Performance’ page very soon but at least with the change of tack that shouldn’t take too long to do. And there is at lease one Guest Blog to get sorted out and issued. Digging through the Blog Archive Of course there are hundreds of Blogs from the past nearly 7 years that you can find using the ‘Blog Index List’ on WD2 and for a flavour here is a fairly recent one from July 2018. There is a link to the first part right at the top of this one: https://wheeliedealer.weebly.com/educational-blogs/the-power-of-patience-the-importance-of-being-idle-part-2-of-2 Time for the Charts, and as usual I will start with Oil. Brent Oil Composite As is typically the case, all the Charts are taken from the quality SharePad software that I use and if you click on the images they should get a bit bigger on your screen so you can see more detail. I am actually a bit surprised by what I am seeing on this Chart of the Daily Candlesticks for Brent Oil Composite - and I will explain my shock in a mo. First up I am interested in the Black 13 Day EMA Line and the Red 21 Day EMA Line and where my Green Arrow is we had a ‘Bull Cross’ and at the moment this is very much in force. The time to get really worried is when we see a Bear Cross. My surprise is that with the weakness in the US on Friday I just assumed that Oil would have got hit as well and this is not the case with my Black Arrow pointing to a small Down Candle from Friday and with good Support at $40 and then $37 down to $34. To the upside, we have Resistance at $44 and then from my Red Arrow we have Resistance at $45/$46 and if we can push above this then $50 comes into view. With all this in mind, this still looks pretty Bullish at this point in time. 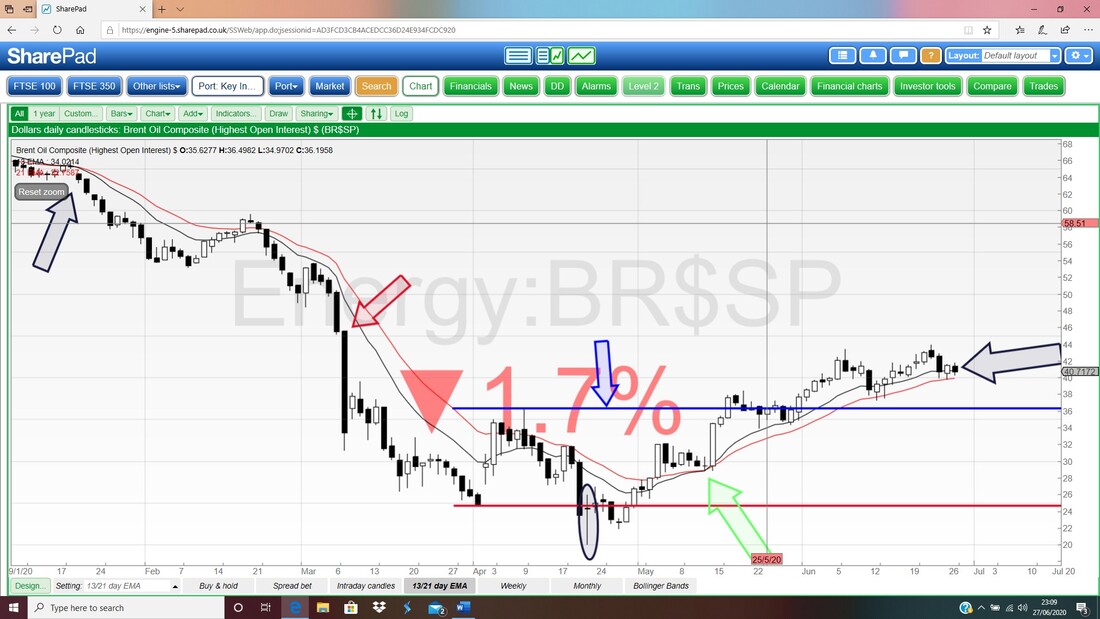
Next we have the Weekly Candles for Brent Oil Comp. My Blue Arrow is pointing to a moderately Bearish ‘Shooting Star’ Candle and this could be a Turning Point down but it is certainly not a big Candle and as such it might not be that big a deal.
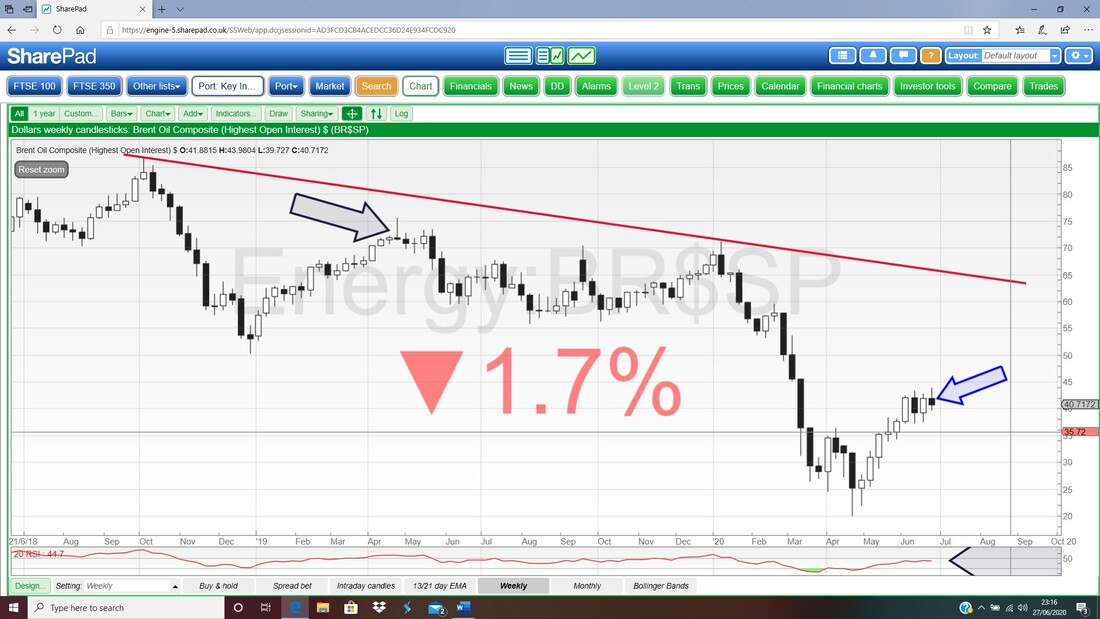
In the bottom window on the Screen below we have the RSI (Relative Strength Index) for the Weekly on Brent Oil Comp and where my Black Arrow is we are on a Reading of RSI 45 and that is not far off Neutral and neither overbought nor oversold.
I would be a lot more concerned about that slightly Bearish looking Weekly Candle I mentioned above if the Weekly RSI was up high and overbought. 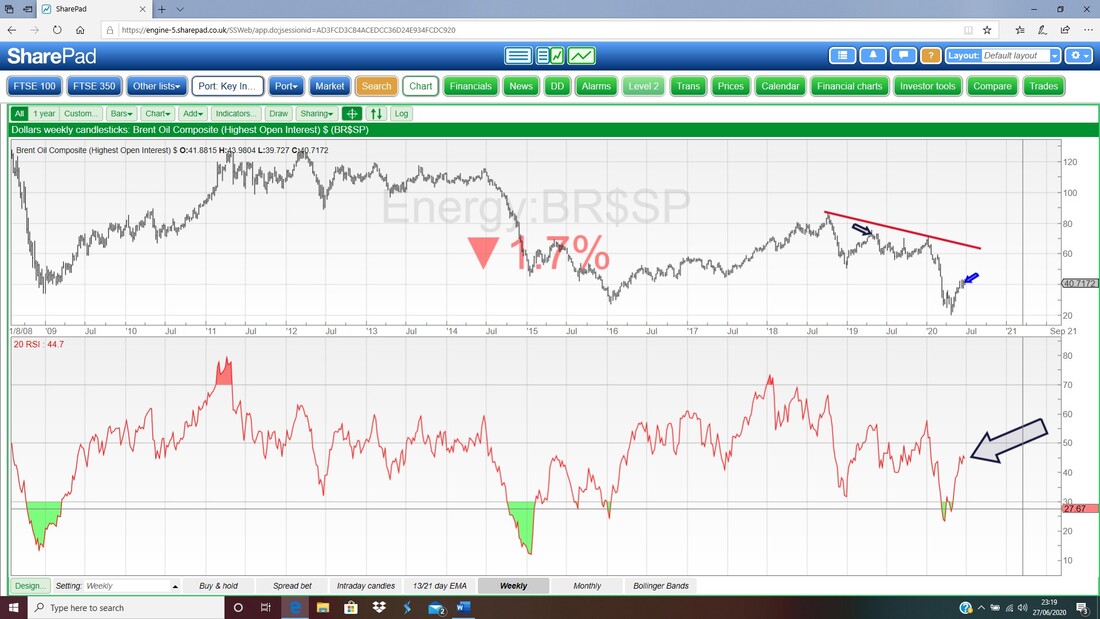
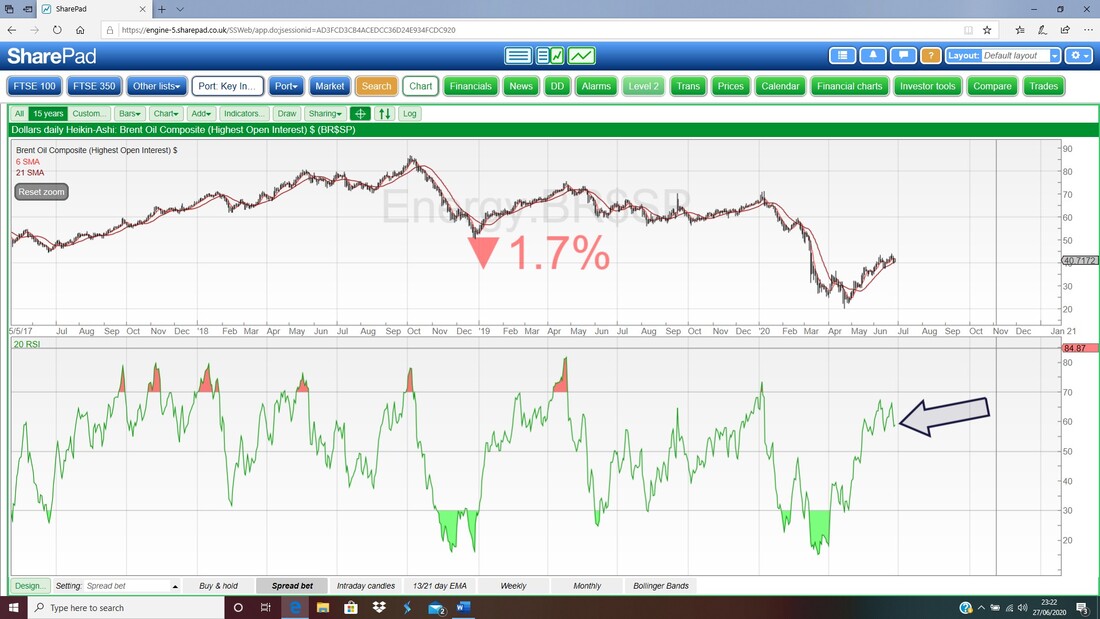
In the bottom window on the next screen we have the RSI for the Daily on Brent Oil Comp. On a Reading of RSI 59 this is high although not crazy overbought and perhaps we can see more weakness in the very short term but it is not a hugely problematic RSI level.
My next screen has the Daily Candles for Brent Oil Comp and the Pink Zone marks the Upper and Lower Bollinger Bands. Where my Black Arrow is we are pretty much at the Bollinger Band Midpoint and down below the Bottom Band is at about $39.4 and this could be decent Support.
Bearing in mind what I have said earlier about the impact of the Oil Price on the FTSE100, at the moment the Oil Price is not looking hugely concerning. 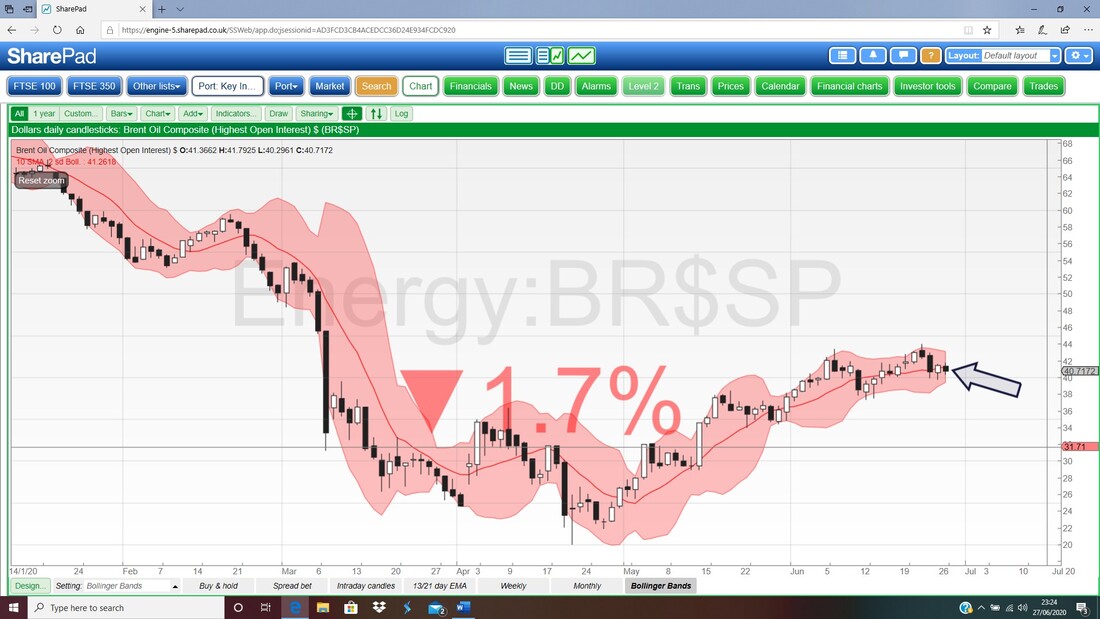
S&P500
I am eager to look at the FTSE100 because I have a Long Spreadbet on it but because of the events on Friday in the US I feel a need to look at the S&P500 first. On my first S&P500 Chart below I have shown the Daily Candles but my focus is on the Blue Arrow which is pointing out that we are very near a ‘Bear Cross’ between the Black 13 Day EMA and the Red 21 Day EMA. I get a sense this could happen and if it does and is quite clear, then I might be tempted to put a small Short at least on the S&P500. I will monitor the situation Monday Night no doubt and see how things are developing and I will most likely be Tweeting about it around 10pm or so. These particular EMA Crosses tend to highly predictive of coming weeks ahead and if they give a Signal it is often wise to go with it. 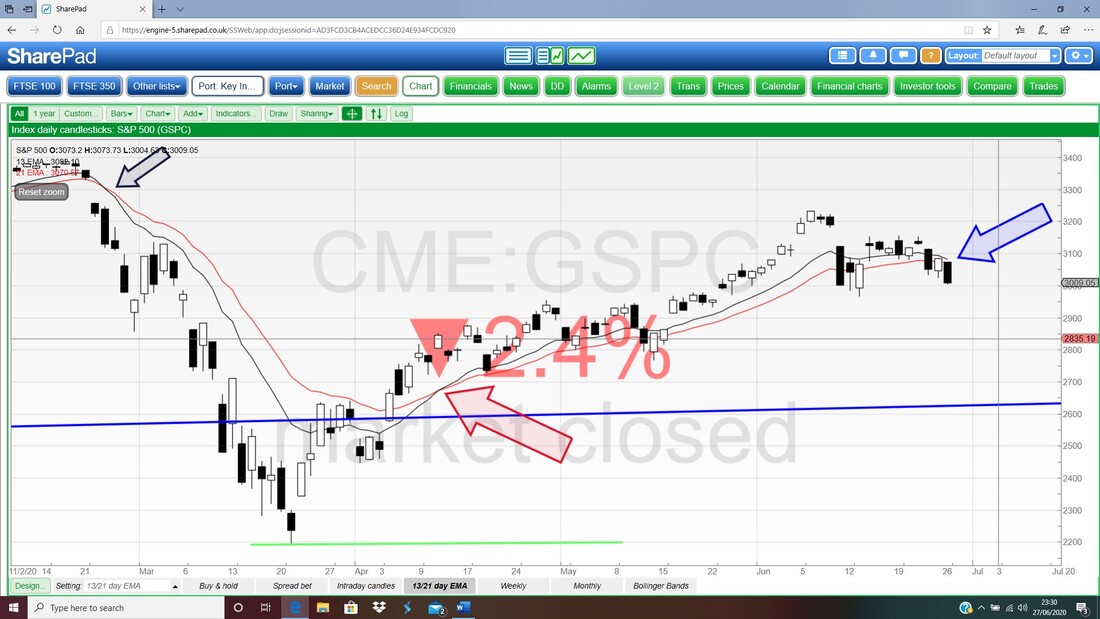
Next we have the Weekly Candles for the S&P500 and my Blue Arrow is pointing to a Black Down Candle from last week and note it fell from the High where the ‘Wick’ is up above and this is Resistance at about 3155. It is not a great looking Candle for Bulls.
There is Support from my Red Line with the Red Arrow at about 2965 and down below that there is good Support at 2800 and 2700. To the upside, there is Resistance from my Black Line marked by the Black Arrow at 3233. 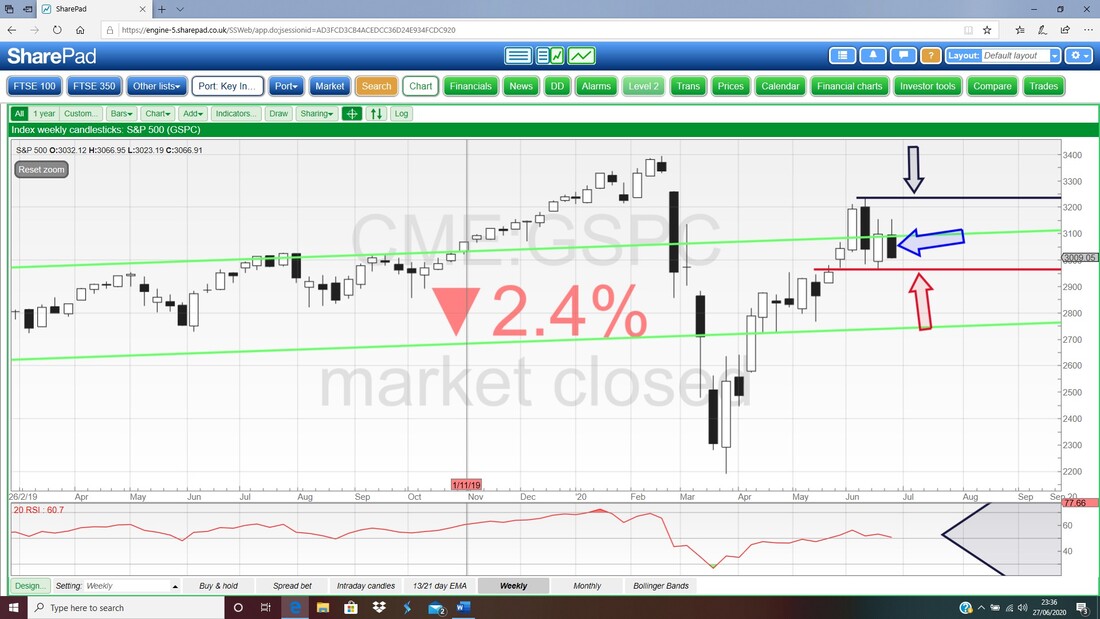
In the bottom window on the next screen we have the RSI for the S&P500 Weekly and on a Reading of RSI 51 this is pretty much Neutral and is neither hugely overbought nor oversold. This suggests that we are not in an extreme situation even if we do get a bit of a drop.
I won’t show the Daily RSI but that is on a Reading of RSI 51 so a similar situation persists. Of course the danger is that if the Markets do go really grumpy there is a lot of room to fall because they don’t tend to turn up in such circumstances until the Daily RSI gets really low like down at RSI 25 or something. 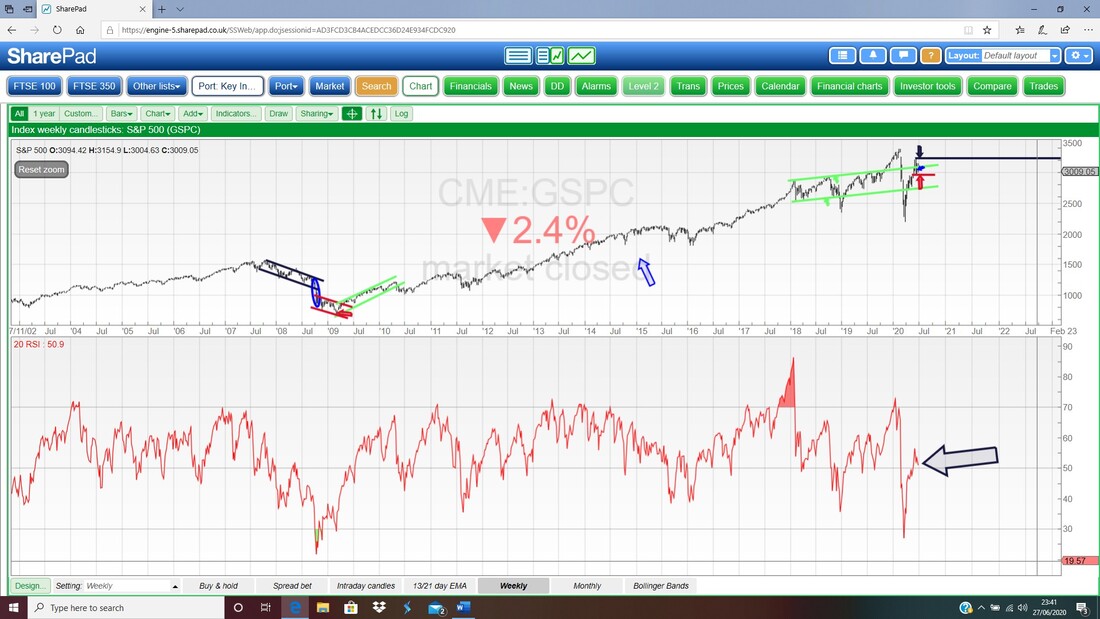
We mustn’t get too ahead of ourselves regarding the next Chart but there is potentially a problem to monitor. Where my Red Circle is I am highlighting the forming up Monthly Candle for June for the S&P500 but this is not valid yet because we still have 2 Trading Days to go to complete the Candle and make it valid.
Trouble is that is not a lot of time and if we don’t get a big move up then it looks like the Candle for June will be a Bearish looking ‘Shooting Star’ and this would suggest problems in coming Months. 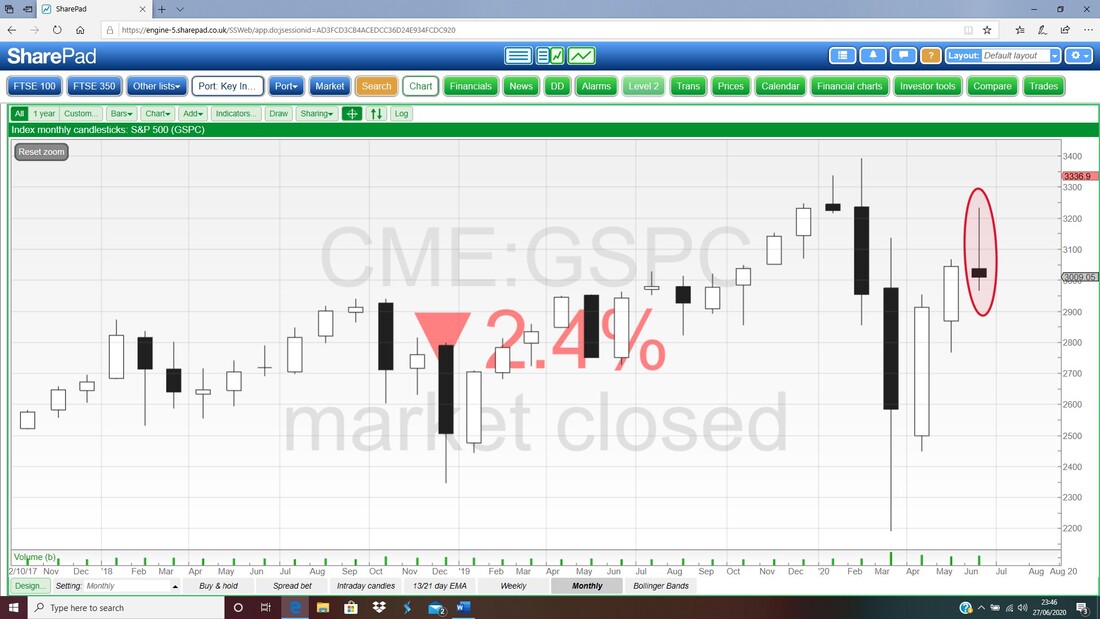
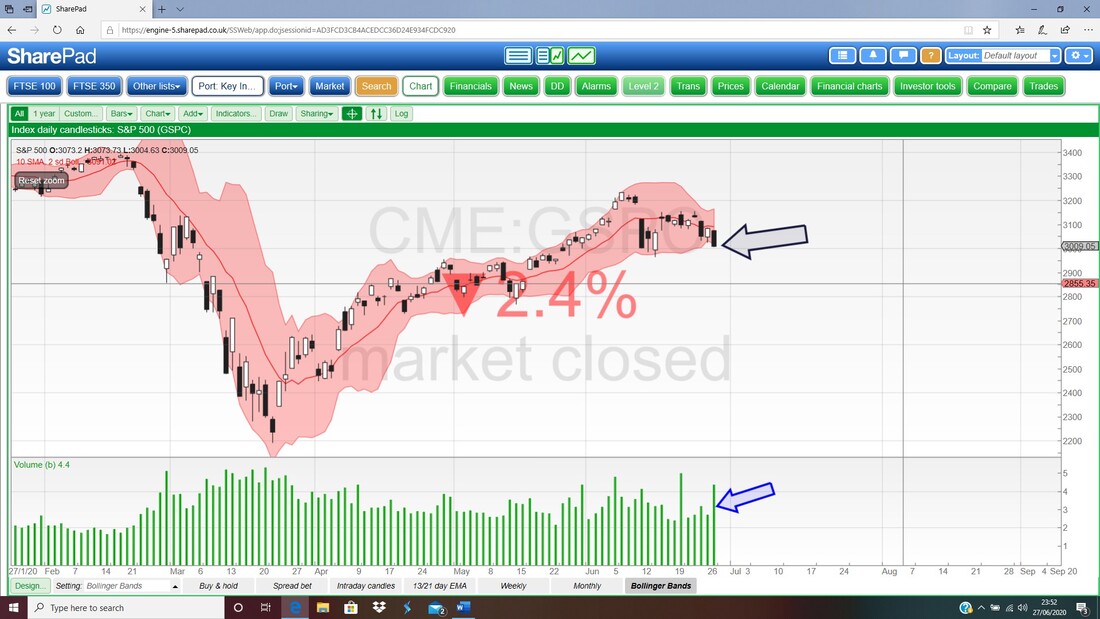
Next up the Daily Candle with the Bollinger Bands for the S&P500 and where my Black Arrow is we are down at the Bottom Band so perhaps the S&P500 will try to move up. I have my doubts though particularly because if you look in the bottom window where my Blue Arrow is we had pretty high Volume on Friday on a big Down Day. Not a great sign.
Nasdaq Composite
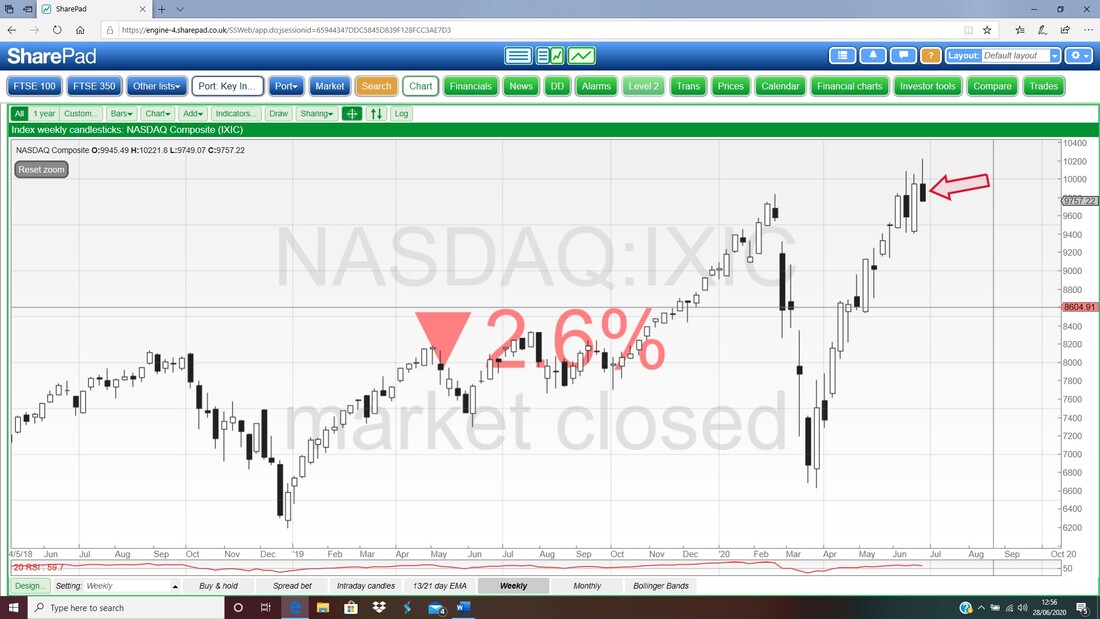
I won’t show loads on this because I don’t want this Blog to go on forever, but I will pick a few things out. The Chart below has the Daily Candles and my Black Arrow is pointing to a Big Down Candle from Friday and of course this shows how the Nasdaq Comp turned down off the Bearish Shooting Star Candle from Tuesday which I have pointed at with my Red Arrow. Note my Blue Arrow down the bottom showing a huge Spike in Volume – that is not a great sign to have big volume with a big down day. There is Support at 9400 and then at 9144. 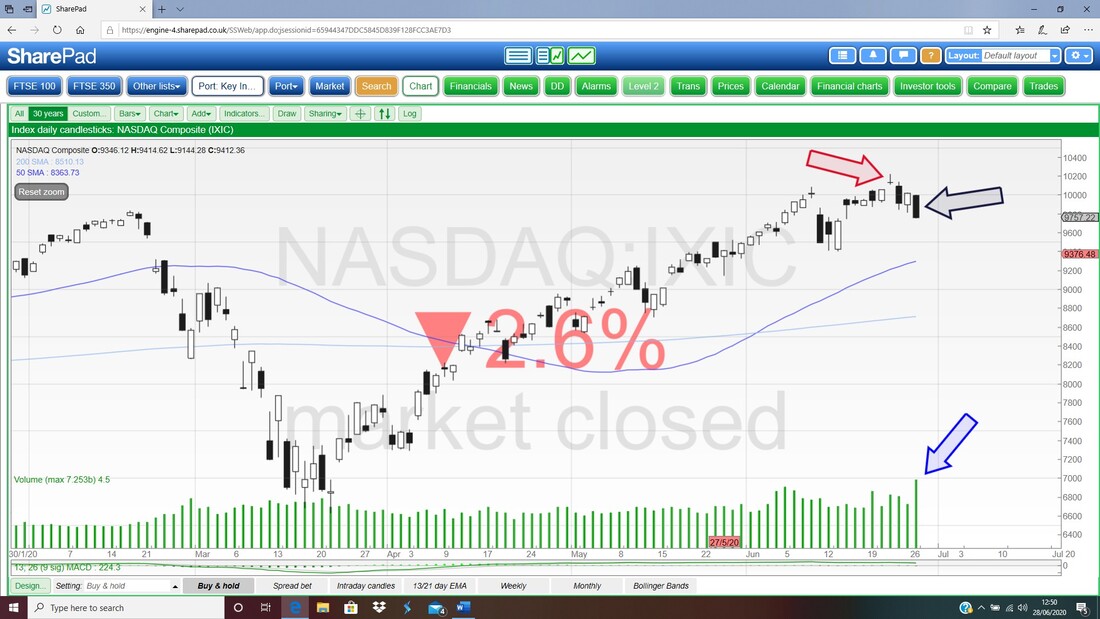
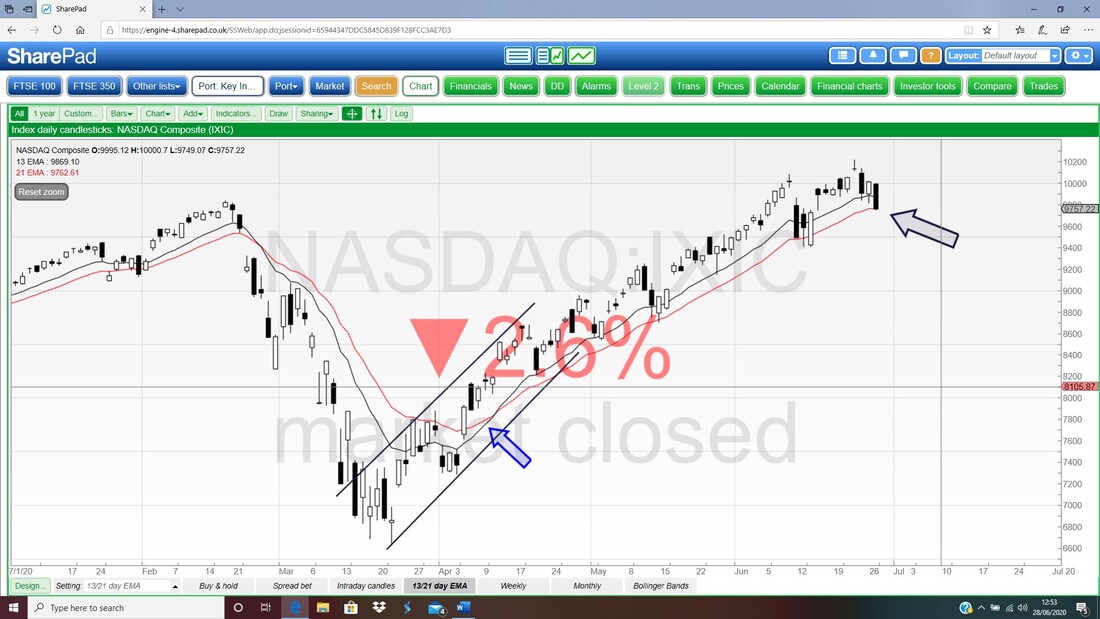
On the Chart below we have the Daily Candles for the Nasdaq Comp but I am not really looking at those here but where my Black Arrow is we have the Black 13 Day EMA Line and the Red 21 Day EMA Line and at the moment they are still in Bull Mode. However, we need to watch this, and if we get a Bear Cross where the 13 Day EMA falls through the 21 Day EMA, then that would be a problem.
My next Chart has the Weekly Candles for the Nasdaq Comp and my Red Arrow is pointing out a Bearish Shooting Star and the context is ‘good’ here for this to be a reliable signal because there was a good run up first.
FTSE100
First up the Daily Candles but I am focused on the 13 and 21 Day EMAs. Where my Blue Arrow is we are still just in Bull Mode after the ‘Bull Cross’ where my Red Arrow is but the Lines are very close together and it wouldn’t take much of a nudge to trigger a Bear Cross. 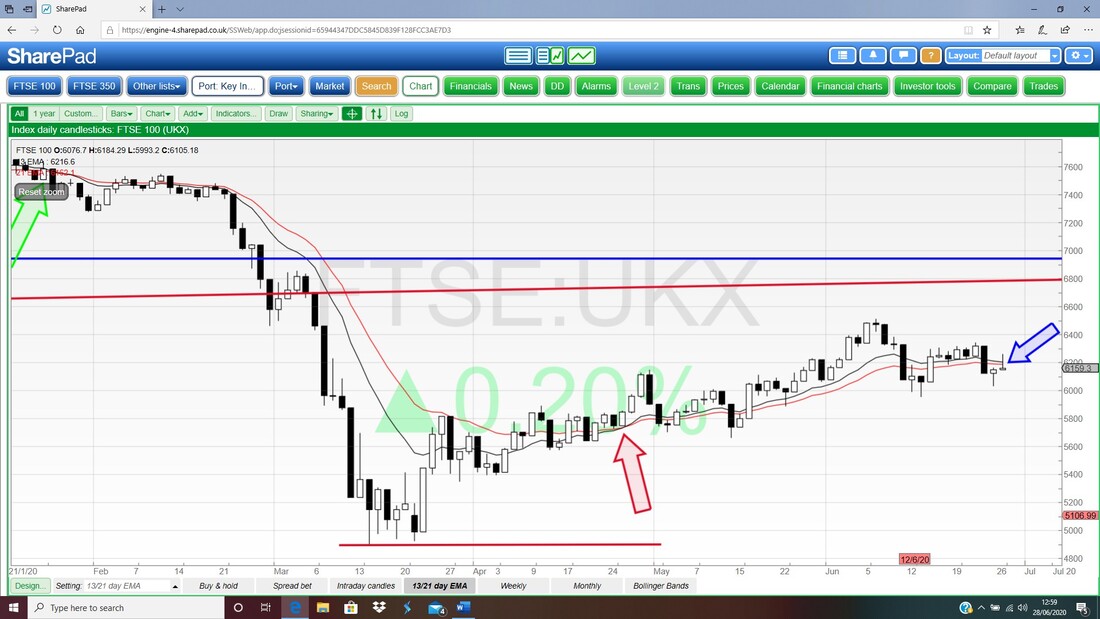
Next the Weekly Candles and my Blue Arrow is pointing to a Down Candle last week which isn’t really disastrous in itself but the fact that the FTSE100 couldn’t build on a possible (but weak) Bullish Setup from the 2 Weeks before is in itself a Bearish thing. The important factor now is Support which means 6000 and then 5952 and if that fails then we could see 5800 to 5600 come into view.
It certainly looks like the FTSE100 is Turning down from where my Black Arrow is and 6500 will be tough Resistance going forwards if we get back to a more Bullish market. 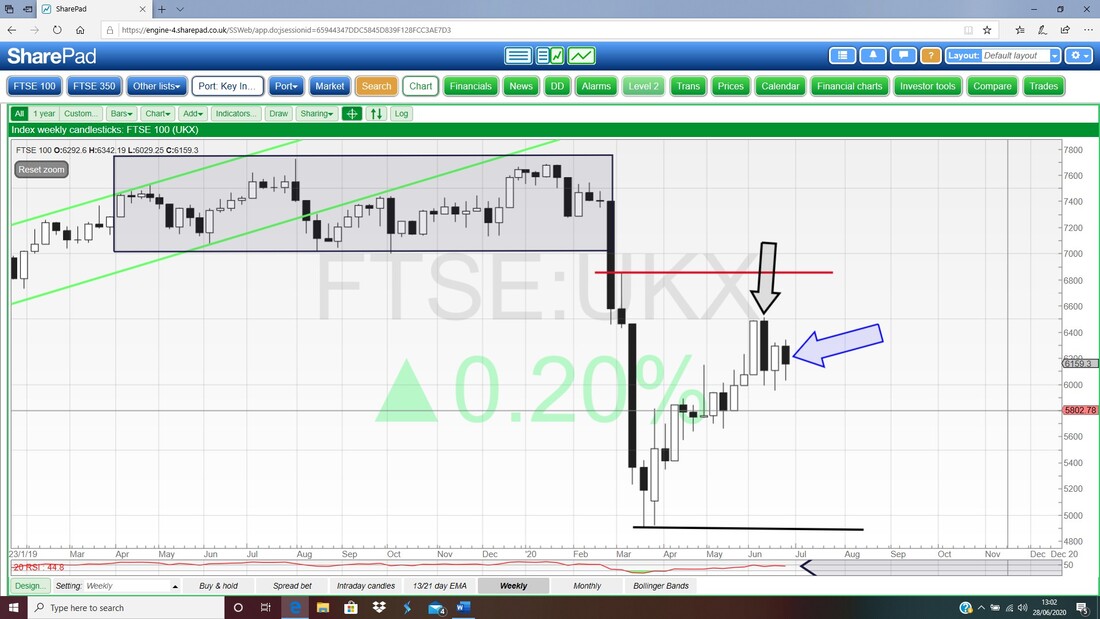
Again this is not truly valid until we get a full Candle which will be on Tuesday Night, but my Blue Arrow is pointing at the state of the forming up Candle for June and it is looking like a Bearish Shooting Star which is clearly not good.
OK, I will leave it there because I have probably scared you enough !! Good Luck in the coming week and try not to do anything rash and silly and keep away from the screen if it is just causing your blood pressure to shoot up. Go and do something relaxing and don’t worry about the Markets as it doesn’t help. Cheers, WD. 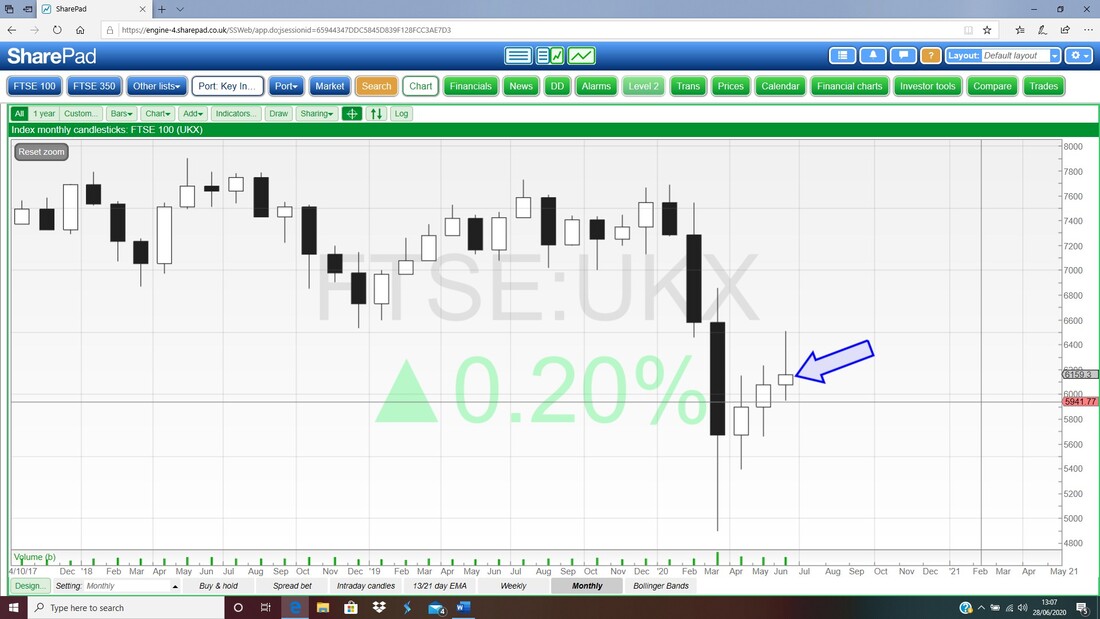
0 Comments
Leave a Reply. |

Stocks & Markets WheelieBlogsThese tend to be more Markets and Stocks related and timely - the Blog Page on the Main WheelieDealer Website has the 'Educational' stuff (well that's the theory anyway !!). Archives
October 2021
Categories
All
|
