

|
stocks & Markets blog |
|
Earlier in the week we had the Prime Grimister telling us about more C19 Restrictions and this was followed up by the Chancellor announcing a plan to give some sort of support to Workers whose jobs are under threat; although from what I am picking up it has not been particularly well received and it looks like further measures and more tinkering is needed.
And I hear the NHS App has gone wrong already but let’s not go there because my sides cannot take any more !! It’s hard to see how the further Restrictions cannot impact negatively on the Economy and of course this makes it harder for many Companies to trade profitably (if they can trade at all) and it looks like this situation won’t be going away fast. Boris was talking about 6 months which takes us to April next year and in today’s ‘Investors Chronicle’ the Editorial was suggesting that a year might not be out of the question. Clearly Markets are going to be lacking direction and prone to sudden rises on hopes of a better future and plunges on fears of the challenges dragging on.
Anyway, to a large extent none of this is a great shock and weakness in the Markets for Autumn should surprise nobody and it is a typical seasonal pattern anyway. As a general principle it is clear that Long Term Investors need to think even more carefully than normal about which if any Stocks they are going to buy and in particular there are obvious Sectors that are going to struggle for some time such as Airlines, Travel, Retail (excect Online maybe), Construction, Housebuilders, Banks, Mortgage Companies, Recruitment, Car Dealers and Makers, Aerospace Engineers, and no doubt many more. Just be really selective and try to look for more defensive and less cyclical stuff like Healthcare, Grocers, Tech (although be careful of elevated valuations), Military, Utilities, Green stuff etc.
On Friday we released the latest Twin Petes Investing Podcast number 32 which you can find here and this probably outlines more of the stuff above and also has some interesting Stocks mentioned in it: https://soundcloud.com/user-479955511/conkers3-wheeliedealer-32-micropayments-loop-dplm-dddd-song-wtb-fpo-biln-aa-call-ipf This is the Soundcloud Link but you can find it under the ‘Conkers Corner’ Channel on other Apps like Audioboom, Apple, Overcast, Spotify etc. (to be honest it keeps appearing on Podcast Platforms that we don’t even put it on ourselves; but that is all very pleasant as far as I’m concerned !!) Last Week Somewhat incredibly with all the gloom and doom and with me having a 50% Hedge now, my Portfolio gained 1% for the Week which was really pleasing, and even better, it has finally gone positive since January 1st 2020 again and is now up a mere 0.5%; but with luck I can build on that although it might be challenging with a whiff of weakness still pervading the Markets. The main reason for the strength in my Portfolio was because I got lucky on Pets at Home PETS on Thursday with strong Results and an “ahead of expectations” Outlook and then on Friday this was boosted by Boohoo BOO releasing the Independent Report on their Leicester Suppliers and that was very well received by the Market. Both are big positions for me so they had a very sweet impact on my Portfolio. Sorry to be ultra-boring but this means my Strategy is pretty much as it has been for much of 2020. I am as good as 100% Invested in my Shares and Long Spreadbet Positions and really my focus is on turning the Hedging Switch on and off as appropriate. At the moment I am 50% Hedged via mostly the FTSE100 with Short Spreadbets and I have a relatively small S&P500 Short via a Spreadbet (see my ‘Trades’ page for full details on my Trades as always, and of course with 100% transparency). Unfortunately Investing is not about excitement and if you want that you are in the wrong game. There are times when the most likely course of action that is going to succeed is to not do very much and to just let things take their course. That is very much the mode I am in at the moment and unless you are a Short Term Trader I just don’t see much point in rushing to Buy Stocks and considerable thought and care needs to be taken over any Trading Decisions to be undertaken. Blog Slate I’ve got a few things in the fire and last night (Friday night actually) I bashed out a Blog to about 80% completion which talks about which Numbers matter in a Spreadbet Account and it explains how the ‘Cash Available’ and ‘Margin/Deposit’ Numbers move around as your Positions increase and decrease in value. It amazes me how often I get asked about this and it makes sense for me to create a Blog which a wider audience can learn from. Fingers crossed that should be released later this coming week on the ‘Educational Blogs’ page on WD1. Once that is done I have a plan to create another Blog that might not appear on my Website straight away but Readers will be able to read it elsewhere for free and eventually I will add it to my Blog Archive. That one I suspect will be very well liked and it is an interesting topic but I won’t let the cat out of the sack just yet !! Sorry, I can be a bit mean and nasty like that……. I’ve then got another Blog which is half written and I can’t even remember what it was about !! But I am sure once my brain has to focus on that one I can pick up the threads again and make something just about readable from it. I also have loads more ideas that I really want to crack on with but of course time is not something I have unlimited supplies of. I am sort of hoping that with Summer out of the way, and me going into Winter Hibernation mode, I will have a bit more time to focus on writing stuff and I won’t be out and about or in the White Hart as much (shame). I need to update the ‘Little Black Book’ as well and I also realise that September is nearly over so the ‘Monthly Performance’ page will need revisiting as well before long. Reminds me of the words ‘peace’ and ‘wicked’…….. Stuff that got Squashed on the Road before This weekend’s roadkill is something I scraped up about 5 Years ago on the topic of how I ‘organise’ my day and hopefully you will enjoy reading it again or for the first time. It is a bit out of date in the sense that my routine has probably changed a little, but it should give a good outline of what I get up to. A mate in the Pub asked about it the other day and he probably got the more up to date version as I vocalised what I tend to do nowadays. As always the full Archive of Blogs I have flattened with a steamroller can be found on the ‘Blog Index List’ page on WD2 and most of them have Links so you can find them pronto. https://wheeliedealer.weebly.com/educational-blogs/wheelies-daily-roll Let’s see how them Charts are shaping up. S&P500 As always the Charts I show are screenshots grabbed from the superb SharePad Software I use and if you click on them they should get bigger so you can see more detail on your screen. By the way, if you fancy using SharePad or ShareScope yourself, then there is a Deal whereby you can get a month off your Subscription if you click the links from one of the Adverts you’ll see dotted around my Websites. I am sure the Homepages of both WD1 and WD2 have this ad. I’m starting with this one because there was quite a strong Rally on Friday and I want to see how this has impacted the technical picture when I stand back and see the bigger trends. The particular jobbie I am thinking of is those 13 and 21 Day EMA Lines (Exponential Moving Average) and what they are signalling. As I expected, on the Chart below you should be able to see the Big Up Candle from Friday pointed at by my Red Arrow, and this turned up off a Doji from Thursday which is as it should be. But the key thing here is that we had a Bear Cross between the Black 13 Day EMA Line and the Red 21 Day EMA Line where my Blue Arrow is and this is still ‘in force’ and barely impacted by the strength from Friday. Until we get a Bull Cross on this Signal (like back where my Black Arrow is) it is unwise to go Long on this Index unless you are a very short term Trader. Taking this further, if you buy Stocks in this Index then you run a very high risk that they will be dragged down in a general Market malaise. I see no signs that this Market is bottoming yet. 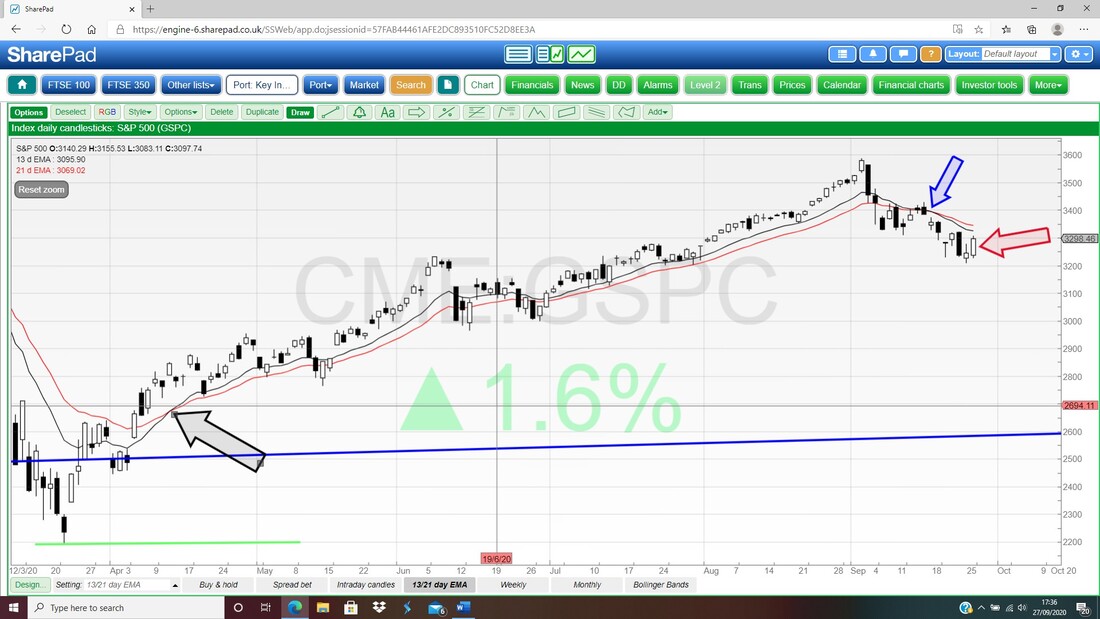
Keeping with the Bigger Picture still, my Chart below has the Weekly Candles for the S&P500 and there is a bit of hope here for Bulls – although it is not yet conclusive.
My Blue Arrow is pointing to a nice Reversal Candle from last week in the shape of a Hammer. This could be a Turning Point for the S&P500 to move up from but we will need to let things play out a bit before we can be sure. As always I am bound to be Tweeting about Indexes every night around 10pm and I will report if I see anything that suggests the mood is changing. The Hammer from last week hit a Low of about 3200 and this should be reasonable Support if the Market does get grumpy. However, if the S&P500 goes down and tests that level then the paradox is that this would show a failure by the Bulls to build on a nice Reversal Hammer and that is a Bearish sign in itself. As a minimum the Bulls must Open the S&P500 higher next week and continue to create a nice Up Candle – with the US Non-Farm Payrolls due on Friday that might prove challenging. I am Short on the S&P500 and I have a Stoploss so if things do turn Bullish then I will be looking to Close my Short and take any hit. Bulls need the S&P500 to push up and Breakout above the Highs from the last few Weeks at about 3429 and then they can charge on to attack that All Time High (ATH) at 3600. A Breakout over the ATH would be hugely Bullish behaviour but my hunch is that we won’t see that for a while. If the S&P500 keeps dropping back then Support from my Red Line (Red Arrow) at about 2965 must hold. I dunno what happened just now but I nearly lost everything I have written in this Blog so far because I must have hit the wrong key whilst typing and everything was highlighted and then disappeared !! Fortunately, I stayed calm and hunted out the ‘Undo’ Button and it all came back. Strewth, that was a close one (although I do keep lots of regular backups by saving with a different number on the file so if I do lose a chunk of work it hopefully won’t be too much and I have a quite up to date copy to go back to). 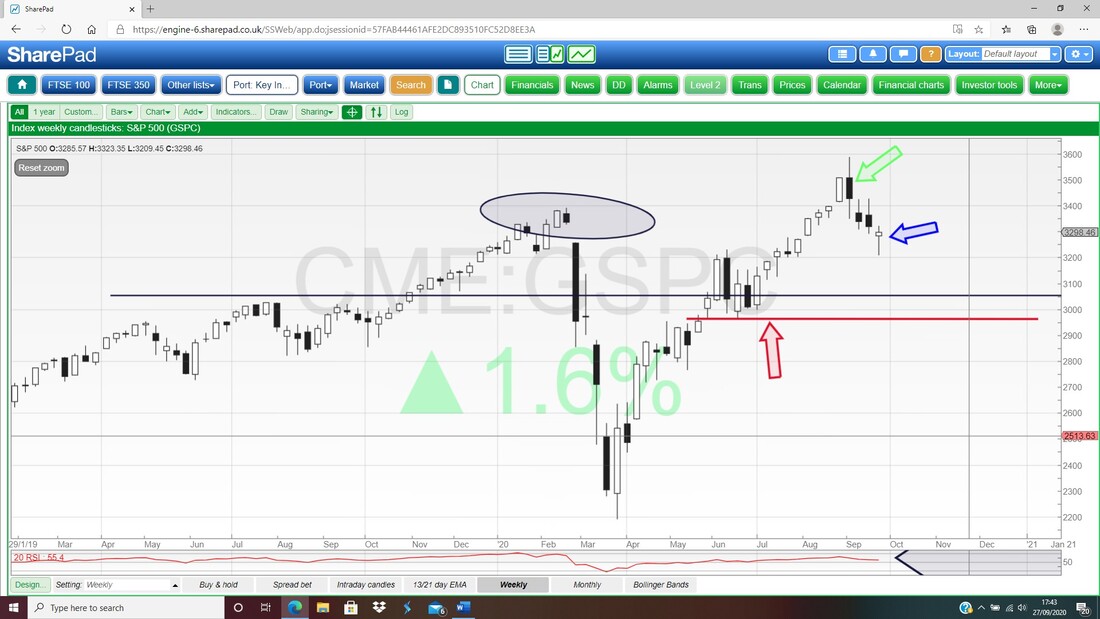
I am breaking all the Rules on my next Chart because this is the Monthly Candles for the S&P500 and the Candle for September is shown by my Blue Arrow but it is not yet valid as it needs to be complete to have full predictive power.
However, you should be able to see that September so far is a Big Black Bearish Engulfing Candle (the Black ‘Body’ of the Candle engulfs the White Up Candle from August) and unless something changes in the remaining days of the month, then this will not be a good sign. I will watch how this develops through the next few days. There are just 3 days of September left now so we will need something quite spectacular by the Bulls to convert this Bearish picture…….. 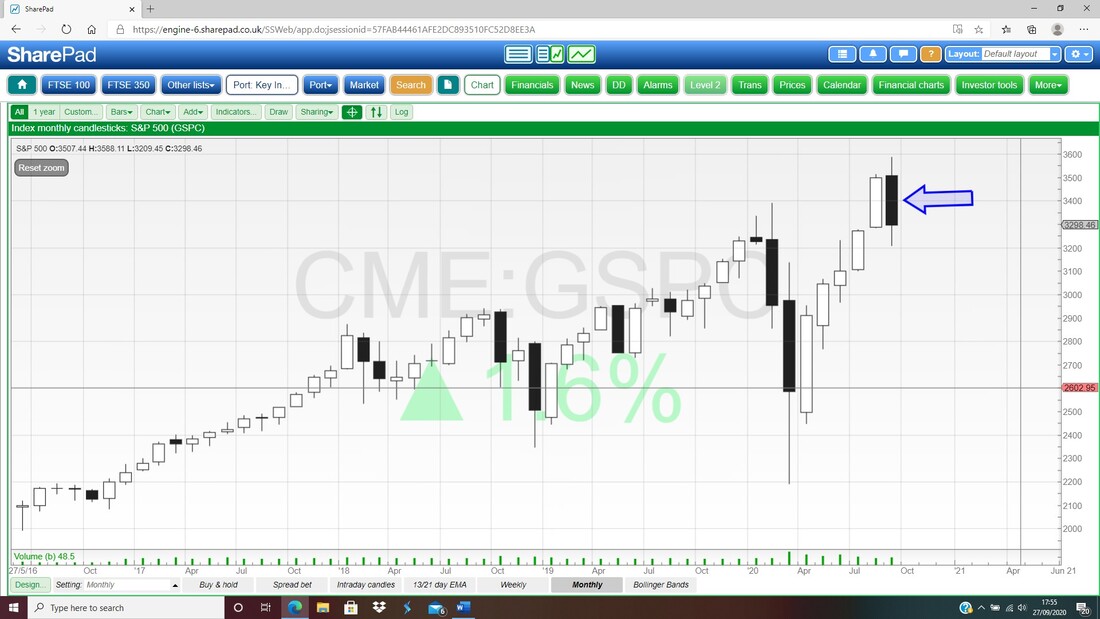
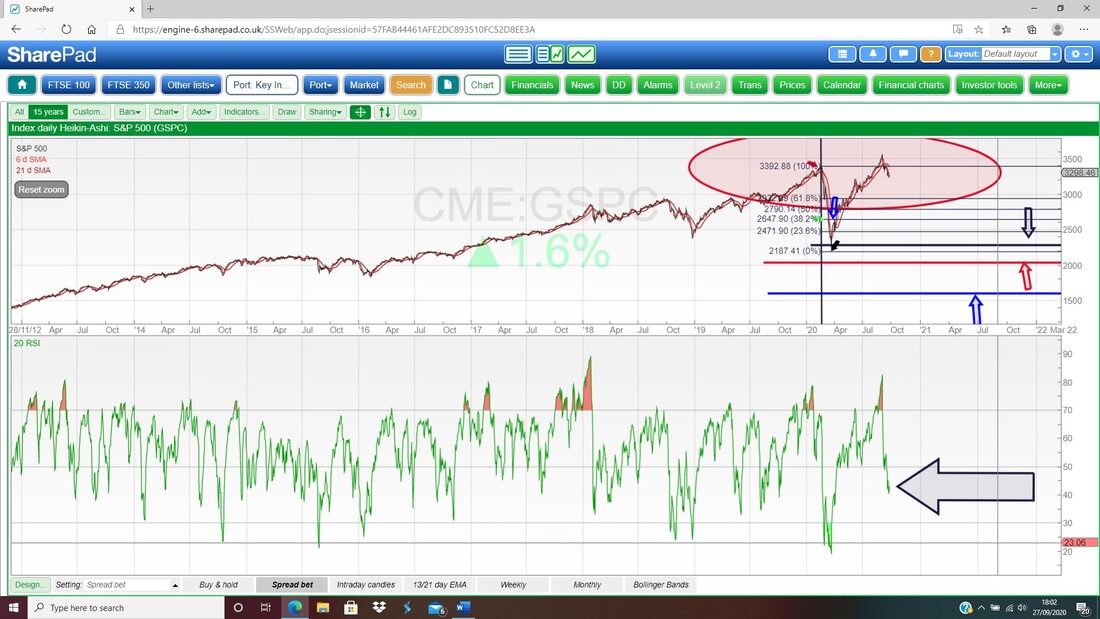
In the bottom window below we have the Daily RSI (Relative Strength Index) for the S&P500 and on a Reading of RSI 43 where my Black Arrow is this is not all that low. If you look to the left we have often had the RSI down below RSI 30 and as low as RSI 19 not that long ago. This suggests more downside to me before the Market ‘clears’ and we have a proper Capitulation by the Bulls.
In the bottom window on my next screen we have the Weekly RSI for the S&P500 and this time we have a Reading of RSI 55 where my Black Arrow is. This is near the Neutral RSI 50 level and really says that if the Market wants to fall then there is plenty of room to drop and if the Market wants to rise then there is plenty of room to go up !!
I find the RSIs most useful when they are at extremes – i.e. above RSI 70 or below RSI 30 when they are getting Overbought or Oversold. 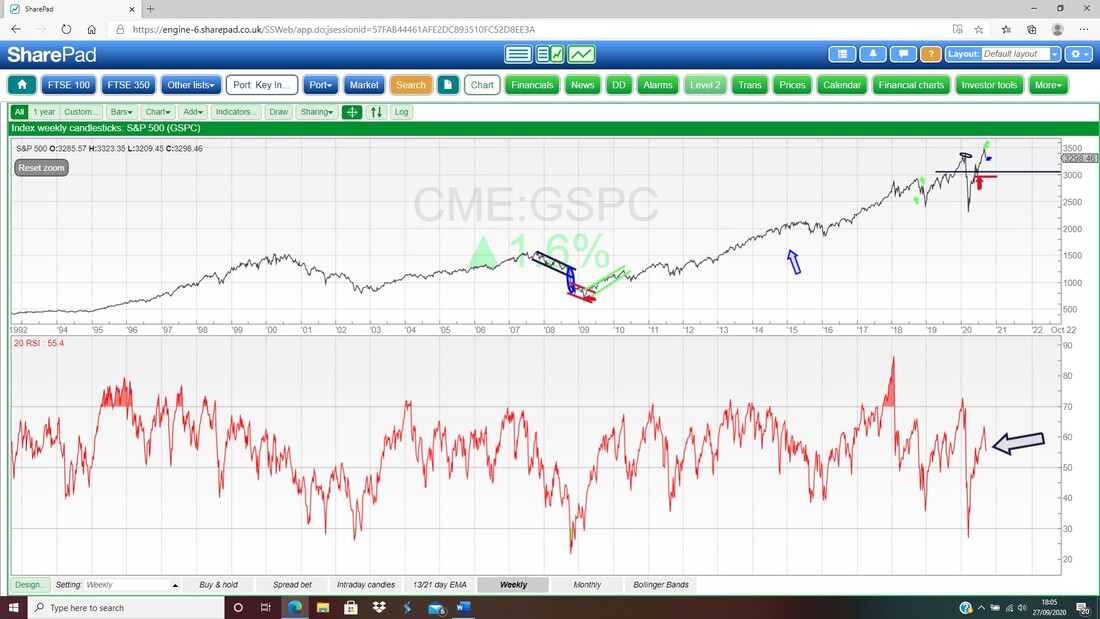
More interesting stuff here. This is the Daily Candles for the S&P500 with the Pink Zone marking the Upper and Lower Bollinger Bands. My Black Arrow is pointing to the Big White Up Candle from Friday but note how it has not yet reached the Bollinger Midpoint Line which is the Red Line pointed at by my Red Arrow and is at about 3325 – this could be Resistance.
The interesting bit is that despite a strong Up Day on Friday where Bulls seemed well in command, note that down below where the Green Volume Bars are, my Blue Ellipse is highlighting how the Volume was pretty low and this suggests not much commitment by the Bulls. 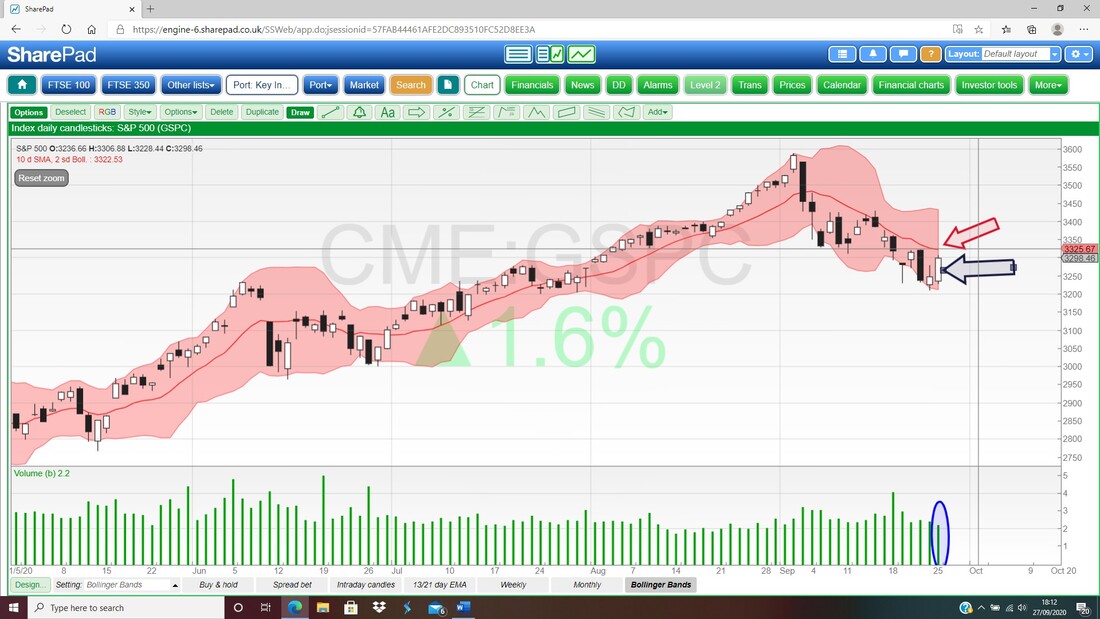
Brent Oil Composite
I always look at this because it can impact the FTSE100 and I have a Short on the latter. On my Chart below of the Daily Candles, the first thing is that my Blue Arrow is pointing to a 13/21 Day EMA Bear Cross and this is still in force and suggests more weakness. My Black Arrow is pointing to a Long Tails Doji Candle from Friday and this chopped about between $42.8 and $42 which are the Resistance and Support in the very short timeframe. Above that there is Resistance at $43 then $44 and my Green Ellipse is highlighting how Resistance at $44.31 was created and this is key Resistance for Oil Bulls to get the Price up through. To the downside there is Support at $41.5 then $41 and my Red Line (Red Arrow) is Support at $39.3. 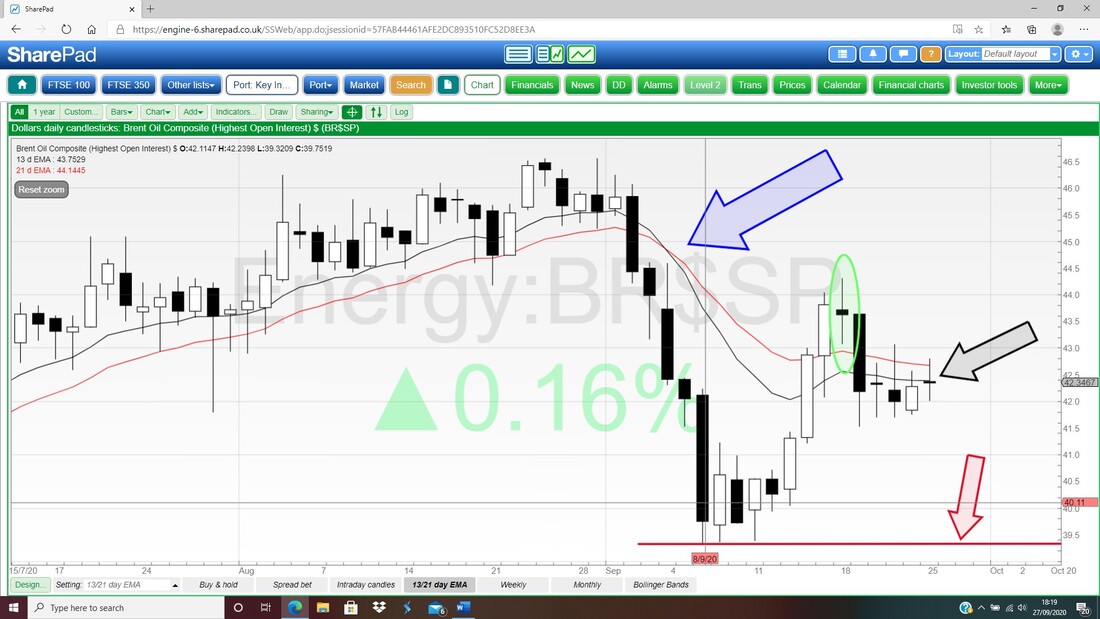
In the bottom window on my Screen below we have the RSI for the Brent Oil Comp Daily. My Arrow is pointing to a Reading of RSI 47 which is pretty much Neutral. This makes sense logically, when a Market is just going sideways then it is obviously not Overbought or Oversold and so you won’t be having extreme Readings.
Overbought happens when people are exuberant and over Bullish and Oversold happens when everyone is shi* scared and terrified and overly Bearish. 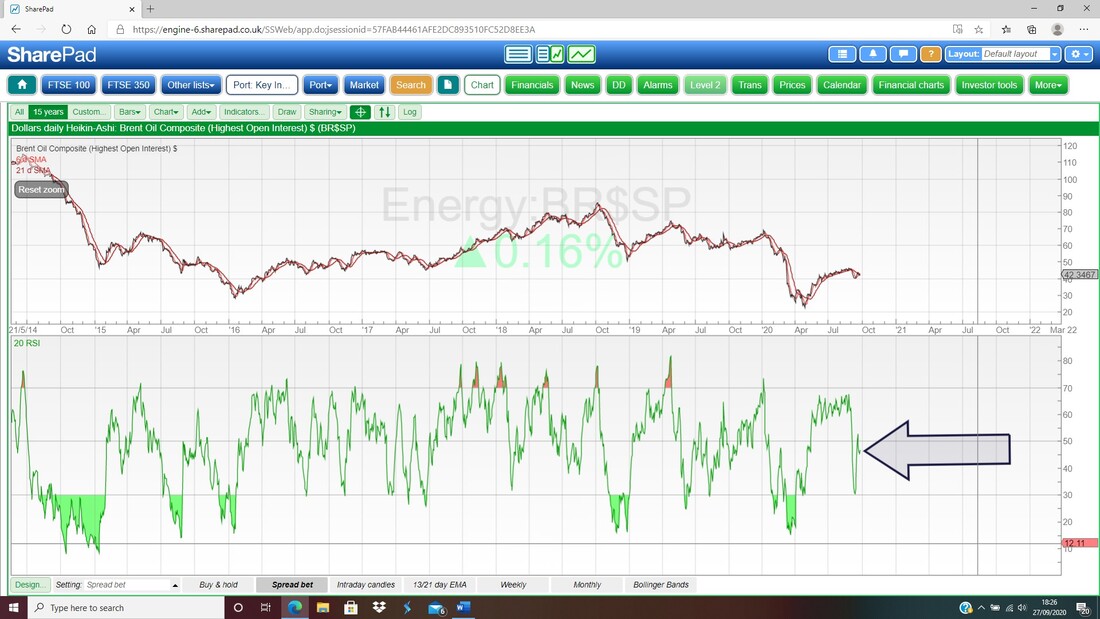
FTSE100
First off, the Daily Candles with my focus on the 13/21 Day EMA Lines and my Black Arrow is pointing to a Bear Cross and this is still in force – suggesting more downside for the FTSE100. Now look at my Red Arrow. This is actually very important. I haven’t looked back but I suspect I wrote about this last weekend as the 2 EMA Lines were converging together and nearing a Bull Cross. But, if you look how it played out, we did not get the Bull Cross and instead the Bears were having none of it and they took the FTSE100 down again and caused the 13 and 21 Day EMA Lines to widen out. Such a failure by Bulls to take the reins on a Bullish Setup is a bad sign and shows the Bears are in charge with this Market. My Blue Arrow is pointing to a nice Hammer from Friday with its Low at 5771 which is now important Support. This was a good Reversal by the Bulls but I suspect it will just mean a bit of a move up before falling back again. We shall see. I won’t show it but I looked back at another SharePad Screen I have setup and this shows not much Volume behind the Hammer Reversal on Friday – so that suggests little commitment by the Bulls. 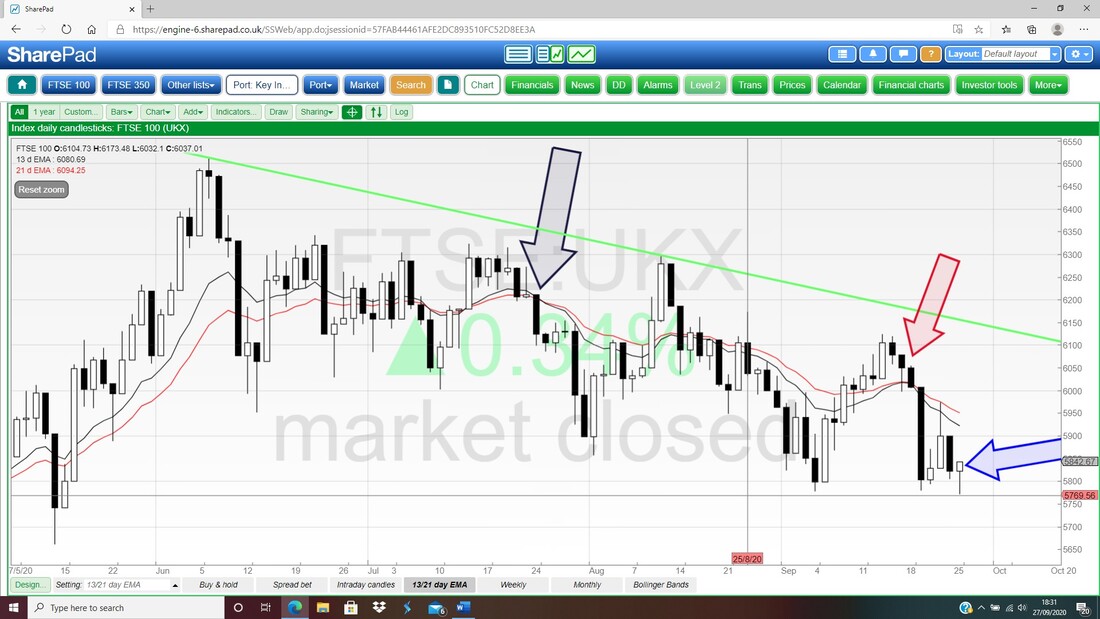
The next Chart speaks for itself. This is the Weekly Candles for the FTSE100 and my Blue Arrow is pointing to a Black Down Candle from last week and this is turning down off a Gravestone Doji shape from the week before.
It’s all about that Support at 5771. If the FTSE100 Closes below it with an appropriate nasty Candlestick, then we are going lower. 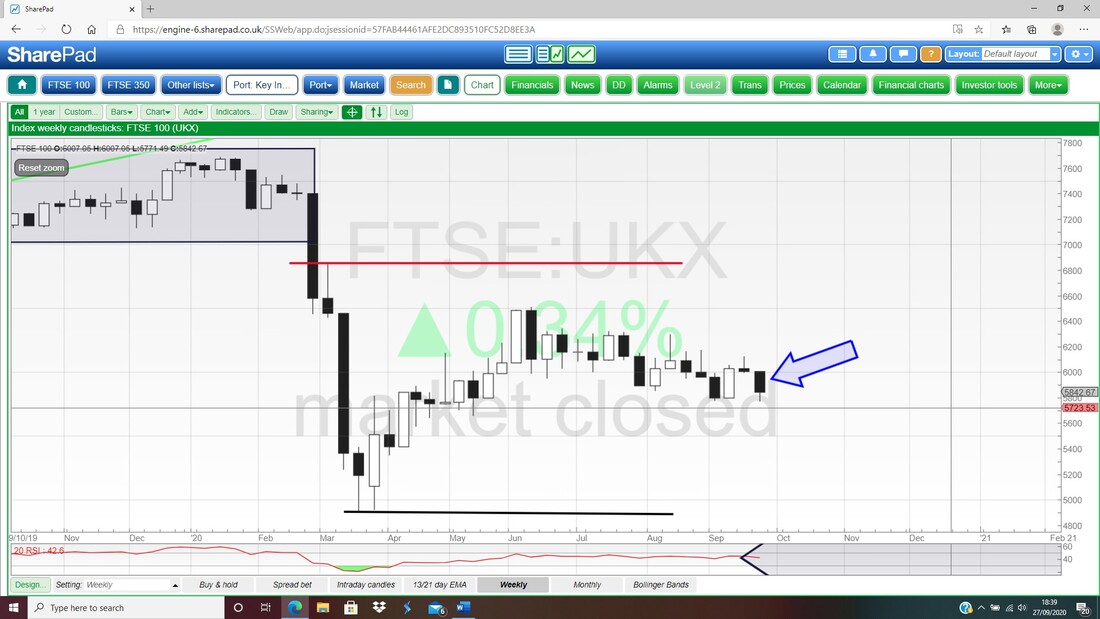
Next the not quite fully formed Candle for September on the Monthly FTSE100 and my Red Arrow is pointing at it. This looks Bearish and to avoid a negative scenario the Bulls have 3 days to do something spectacular.
My Blue Arrow is pointing to what looks like a Turning Point from back in June when the FTSE100 put in a Bearish Shooting Star Candle. This essentially tells us that 6500 is Key Resistance and we need to smash convincingly through this to suggest Bulls are taking the FTSE100 higher. 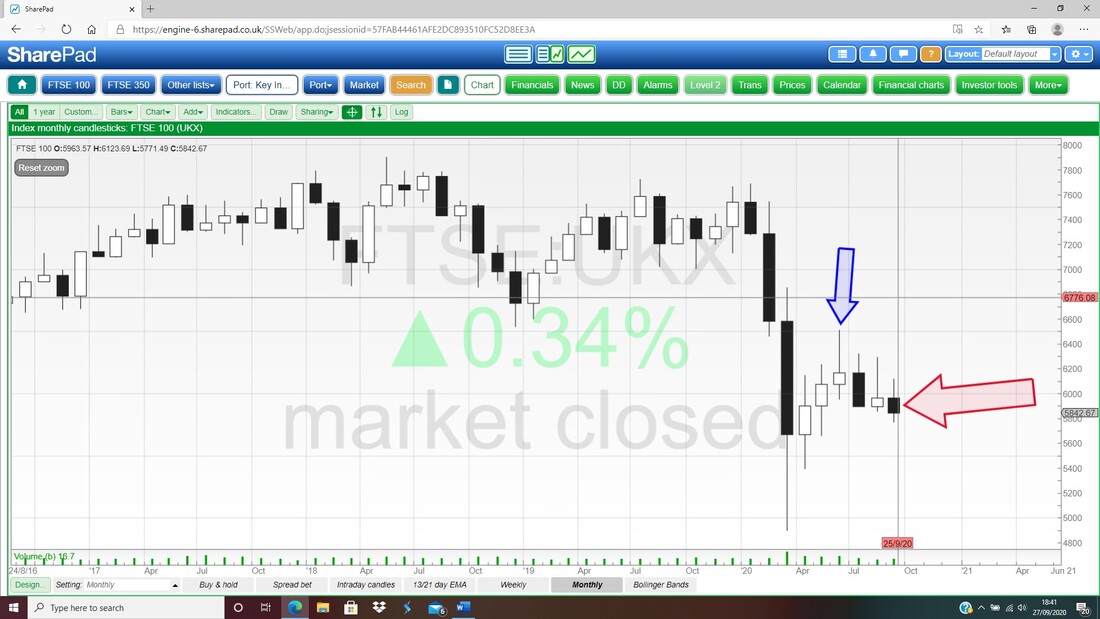
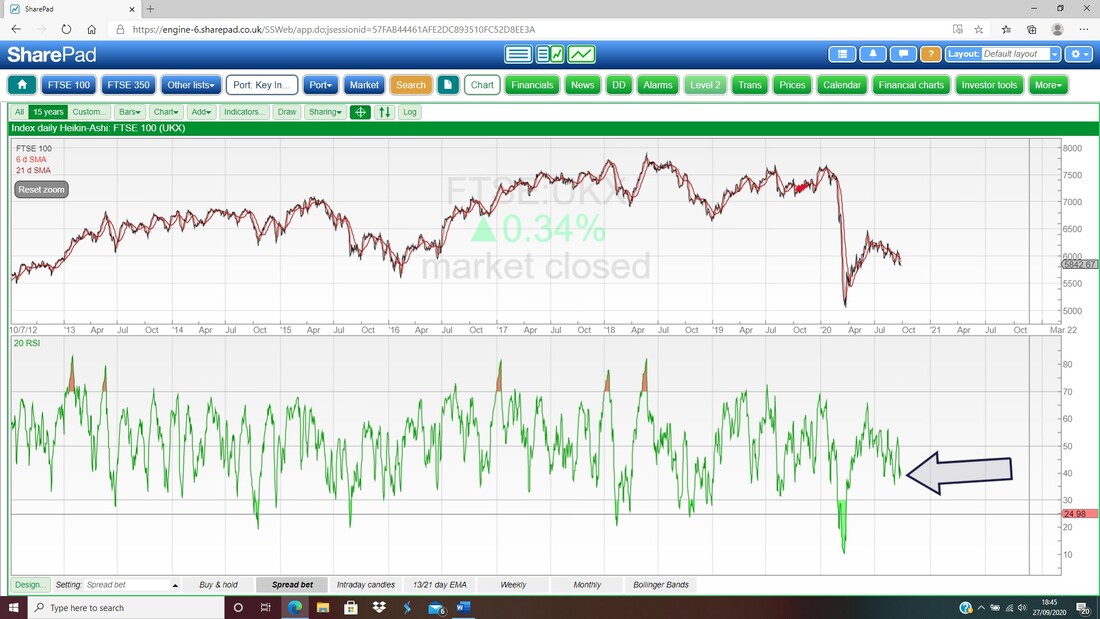
In the bottom window below we have the RSI for the Daily FTSE100 and my Black Arrow is pointing to where we are now at RSI 39. This is low but can go a lot lower.
Finally for the FTSE100 we have the Daily Candles with the Pink Zone showing the Bollingers. My Blue Arrow is pointing to the Midpoint Line at about 5950 which could be Resistance and down below the Bottom Bollinger is at about 5720 which could be Support.
I wasn’t going to show it but I see I have the Volume Bars in the bottom window on this SharePad Screen and my Black Ellipse is making how the Green Volume Bar from Friday was pretty unimpressive. 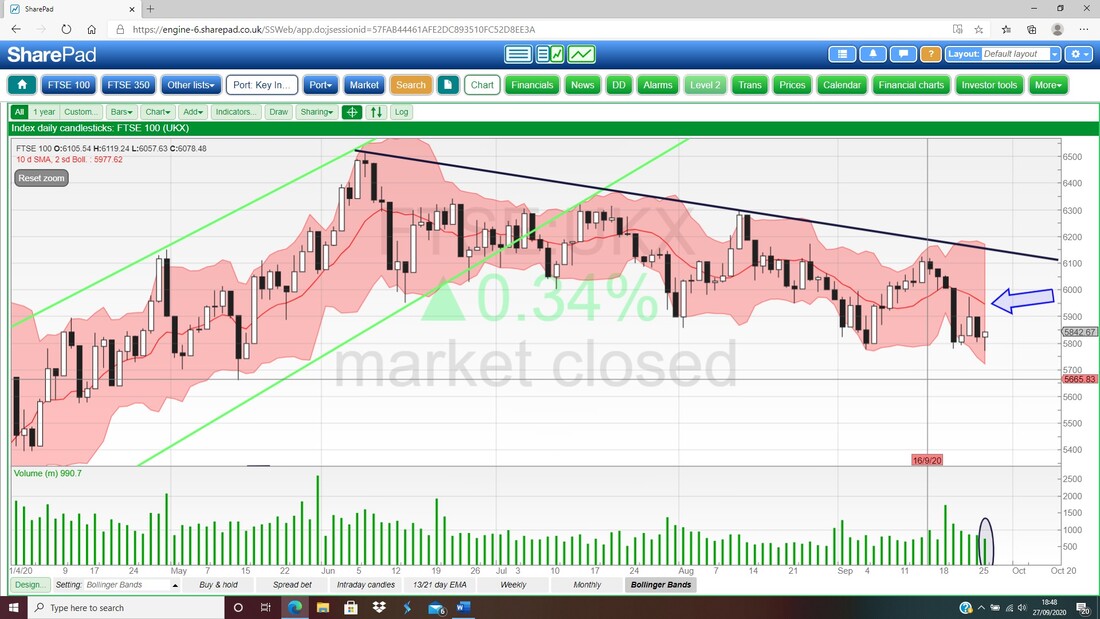
FTSE250
I won’t show loads on the FTSE250 because in reality it will most likely move with the bigger Indexes anyway. What I do want to show though is how the phenomenon of a Bollinger Band Squeeze played out with the “Explosive” move I had suggested would happen. On the Screen below we have the Daily Candles for the FTSE250 and my Blue Ellipse is showing the sort of Sideways Drift that the FTSE250 did for ages and as a consequence the Bollinger Bands moved closer together – they tightened up and did a Squeeze. Then my Red Arrow is pointing to where this Bollinger Band Squeeze resolved with an Explosive big Down Candle. It is lovely how these things play out but the catch is that it is pretty much impossible to be certain which way a Squeeze will resolve although of course we all knew that there were many Bearish signs kicking around so a big move Down was not totally a shock. My Black Ellipse is trying to highlight how recent Days have been quite Sideways. My hunch is that this will turn out to be a Bearish Ledge from which we fall down again. 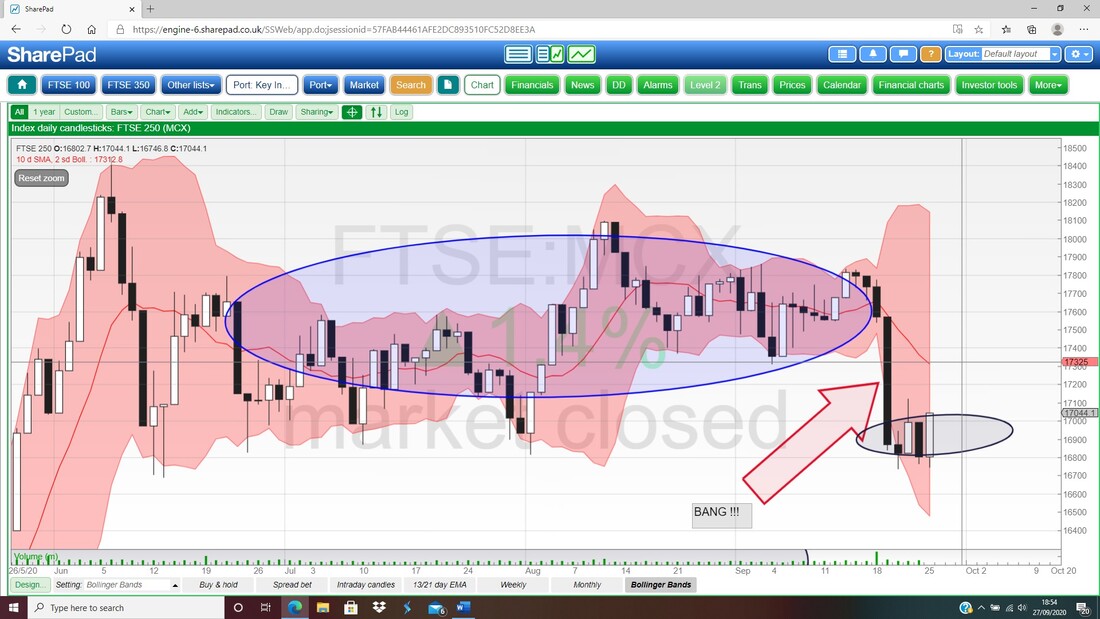
This is the last Chart tonight – here are the Daily Candles for the FTSE250 and my Black Arrow is pointing to a Bear Cross on the 13 and 21 Day EMA Lines. Not good.
OK, that’s it. Good luck in the remaining days of September and remember to keep your wits about you and don’t forget the new Podcast. Cheers, WD. 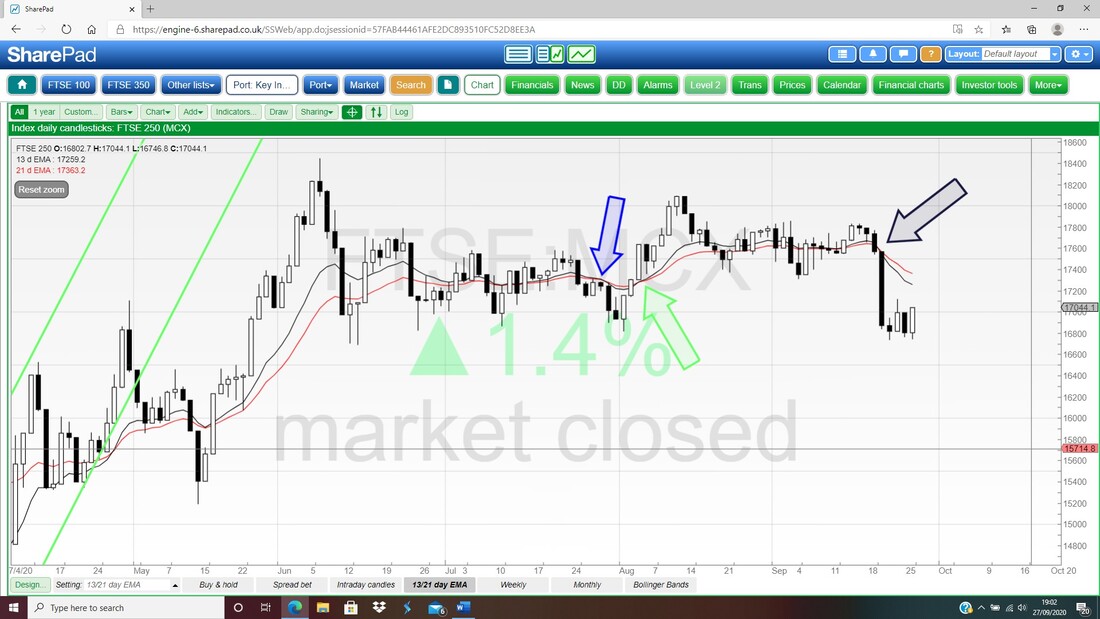
2 Comments
KevinS
9/28/2020 12:04:51 am
I look forward to reading your Sunday night write up on a Monday and am beggining to get interested in the charts - something completely new to me. Your explanations are very simple to understand, although I am sure in reality it comes from a lot of experience and knowledge. Keep up the great work. I hope the White Heart is still doing well.......brings back some old memories having grown up in that neck of the woods.
WheelieDealer
10/7/2020 03:11:50 pm
Hi Kevin, thanks for the comments. Great to hear you are finding the Blogs well worth reading and I am particularly pleased that I am managing to explain the Technical Analysis concepts in a way less familiar people can follow. Leave a Reply. |

Stocks & Markets WheelieBlogsThese tend to be more Markets and Stocks related and timely - the Blog Page on the Main WheelieDealer Website has the 'Educational' stuff (well that's the theory anyway !!). Archives
October 2021
Categories
All
|
