

|
stocks & Markets blog |
|
I’m back !!!
It has been a pretty difficult few weeks with my health playing up big time, and I have not been able to sit at the keyboard and bash out any blogs. Thankfully things are getting better and I am starting to think that the diagnosis (more like pure guess !!) by my Doctors, that it is acid burning my stomach wall, may actually be correct. Fortunately, the pain is much more subdued now and I am very pleased to say that on Tuesday, I actually felt more like my old self and had no pain at all. On the flipside, that didn’t last and today (Saturday night) it is at a low level which is bearable, but not perfect obviously.
WheelieBash 2021
We have determined that The WheelieBash this year will take place on Saturday 4th September 2021 at The White Hart in Winkfield near Windsor as usual. I am allowed 60 peeps and so far over 45 Slots have gone. It is Free to attend and if you want to come then email me or DM me on Twitter or whatever. If you go to the relevant page on my Website (I think it is on WD2) then you can see all about WheelieBashes from previous years. It kicks off at 12.00 Noon and if you want food you need to order by 2pm. They do more food in the evening, so don’t worry, you are unlikely to die of starvation. You might get an aching face from smiling, especially after the grim time we have had in recent months, and your hand might ache from taking notes of all the great ideas you hear about. It is totally informal and everybody is welcome, come and go as suits you. All ages and experiences are always represented and it is an unmissable opportunity to meet other like-minded Investors and Traders. Last Week I am super pleased to report that despite the mess from Thursday, my Portfolio managed to scrape together a fairly reasonable gain of 0.85%. This brings my Portfolio to just a tiny bit away from an All Time High which it hit earlier last week. This was particularly sweet because I had a wonderful day in the garden of the White Hart on Friday and it was divine to come home and find my Stocks had delivered the goods. I updated the ‘Monthly Performance’ page on WD1 a few days ago, and this will shed more light on how my Portfolios are doing for the year since January 1st – thankfully things are going pretty well. My strategy is pretty much as ever; I am not doing much and I am really just staying alert for a need to Hedge my Portfolio if I sense a serious drop is on the way. This often happens around the Autumn, starting in late August, and after what in many ways has been a ‘easy’ market for 2021 so far, we are probably due a wake-up call. I am keeping an eye on a few of my really big Winners and looking for a need to TopChop – I am in no rush and am happy to run them if the Bulls are still eager. I am highly conscious of the dangers of letting any one Position grow too big (I suspect many BOTB holders have been dished out this lesson by the Market Devils) and this is especially the case with MPAC which is a huge overweight for me. Thankfully their Trading Update last week was fine and I am not worried. If you look at my ‘Trades’ page on WD1, you should see at the top that I Closed the Positions I had in TCM after they got the Takeover Bid. It looks to me like the Deal will go through and I do not want to wait for the Cash. This is particularly true because TCM are based in Israel and many years back I had a Takeover of a Stock called Dmatek DTK (remember that Old Timers?) and I made the schoolboy error of waiting for the Cash. It was a nightmare because it took forever and I had to fill out loads of stupid Israeli Government Tax Forms etc. Ugh. No thanks. Latest TPI Podcast This coming week we plan to record TPI 53 Podcast and that one should be out next weekend and, in the meantime, you can find the latest Podcast (TPI 52 obviously !!) by going to the ‘Twin Petes Investing Podcast’ page on WD2 or you can click on these Links for Soundcloud and YouTube: Soundcloud here: https://soundcloud.com/user-479955511/conkers3-wheeliedealer-52-how-to-finding-winning-stocks-pypl-amzn-mrw-gsk-lseg-kct-ai And you can hear it on YouTube here: https://www.youtube.com/watch?v=M7P1b47UDLI Blog Slate With my health seemingly on the way to being ‘fixed’, I am hoping I can start writing ‘Educational’ Blogs again and I have loads I want to create. However, this is unlikely to happen for a few weeks at the earliest, but at least I am committed to making sure Weekend Blogs (like what you are reading) do become their usual regular thing. Last week I updated the ‘Little Black Book’ on WD2 with loads of Stock Ideas that need more research and I updated the ‘Monthly Performance’ page on WD1 with the details for June (thankfully a small positive). I also wrote quite a bit about the Telit TCM sell on the ‘Trades’ page and I amended the ‘Portfolios’ page – both these pages are on WD1. From the Archives If you go to the ‘Blog Index List’ on WD2, you should find all the Blogs I have ever written in the last nearly 7 years, and most of the useful and relevant ones have links. From that List I bring you this one, I hope you like it: https://wheeliedealer.weebly.com/educational-blogs/valuation-valuation-valuation-bursting-for-a-pe-part-4-of-4 In the Podcast TPI 52, we talk a lot about how we value Stocks, and this Blog Series (at the bottom you will find links to the first 3 parts) should help you a lot on learning how to value a Stock. This helps in so many ways, like selecting good Stocks in the first place and setting Targets and helping with when to TopChop etc. A sense of value can help give you the commitment required to hold onto Quality Stocks for the long-term, where you can achieve gains of 200%, 300% and more. On Friday in the pub garden I was chatting with the chaps there about the first blog I ever wrote and how dreadful it was really !! Anyway, here it is: https://wheeliedealer.weebly.com/educational-blogs/wheeliedealers-dos-and-donts Actually, it was not quite the first I did, but it was one I look back on now and think wasn’t that great. Having said that, from a quick scan through, maybe I am being unfair on my writing skills back then !!! S&P500 All the Charts I show are taken from the excellent SharePad software I use and if you click on the images then they should get a bit bigger on your screen (I recommend you read these Blogs on a big screen rather than just a Fone – there is a lot of detail to be seen). I know some Readers actually look at their Charts on SharePad or whatever method they use as they read through my blogs. If you fancy using SharePad or ShareScope yourself, then you can get 1 month’s Free Data if you go to the ‘Subscribe’ page on their website and then select the Product you want, and then you should see a ‘Promo Code’ box and if you type ‘twinpetes’ into that box, then the discount will apply. You can also get this by clicking on the Adverts that are all over my websites. I get a small payment for introducing you, so thank you very much !! (it’s just a shame I can’t spend it on beer much at the moment…..) https://www.sharescope.co.uk/ I noticed also that SharePad/ShareScope have updated the landing page on their website and there is much better detail regarding the capabilities and features of their software now. In fact, Podcast TPI 50 contains a discussion with the Founder of SharePad/ShareScope, Martin Stamp. Highly recommended and of course you can find that one on the ‘Twin Petes Investing Podcast’ page on WD2. I am starting with the S&P500 for no particular reason, although I suppose it might have made more sense to start with the FTSE100 because I am running the Test System of my new Method for Spreadbetting on Indexes, as I have outlined in the Podcast and in 2 recent Weekend Blogs. First up the Weekly Charts (it is always ‘best practice’ to look at the longer-term stuff first and then to drill down), and my Screen below is dominated by that Uptrend Channel marked by my parallel Black Lines. My Black Arrow is pointing to the Lower Support Line and note how the S&P500 has recently tested this but is still within these confines. My Blue Arrow is pointing to a Hammer shaped Candle from Friday and in the current context, where the S&P500 put in a new All Time High (ATH) during the day, this is probably nothing concerning. There is Support at 4056 and 4000 should be Support as a psychological round-number. Note, all the Charts I show are simple and clear. You can use exactly the same techniques when looking at pretty much any Asset or Individual Stock. You might find that you can alter the parameters a bit to fit the Asset; for example, you might find an 8/21 Day EMA works better on a particular Asset than the 13/21 Day EMA does – but mostly I find the Indicators I use to be quite universal. 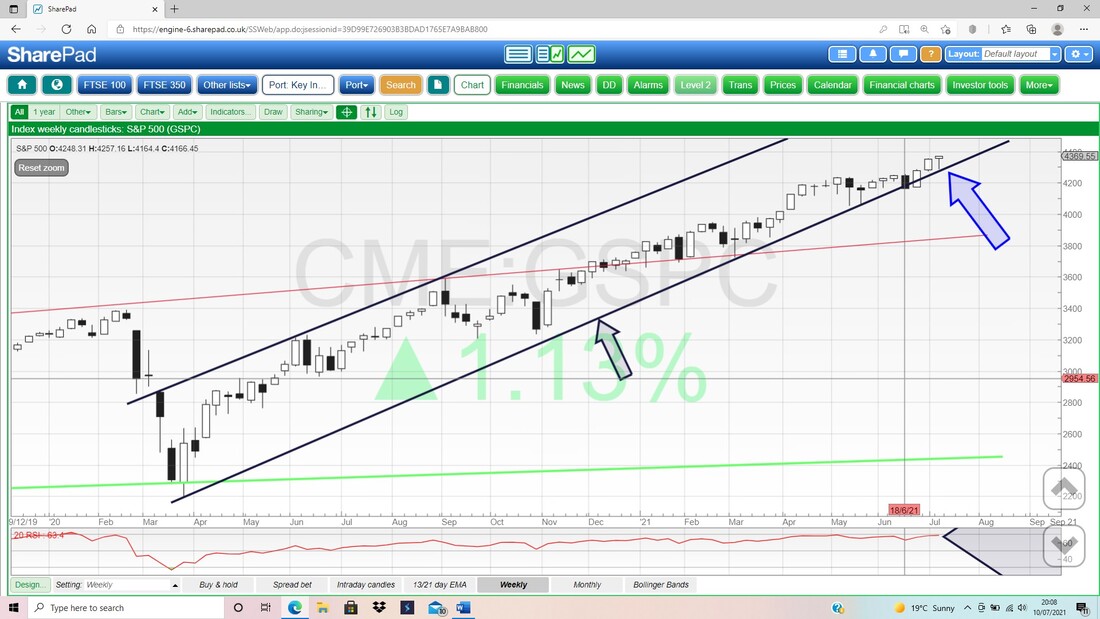
Next up my favourite Indicator, the Black 13 Day EMA Line (Exponential Moving Average – it’s like a normal Moving Average but more recent values are given a higher weighting in the calculation) and the Red 21 Day EMA. My Blue Arrow is pointing to where there was an attempt by the Bears to take the S&P500 down, but they failed and a momentary ‘Bear Cross’ where the 13 Day fell down through the 21 Day, was quickly reversed into a Bull Cross and look how this predicted a considerable amount of gains since that happened. Failure by Bulls or Bears to exploit an ‘easy’ opportunity, shows that the other side is strongly in command.
This Bull Cross is still ‘in force’ and it is unwise to go Short on this Index in any size until we see a Bear Cross that gets cemented. 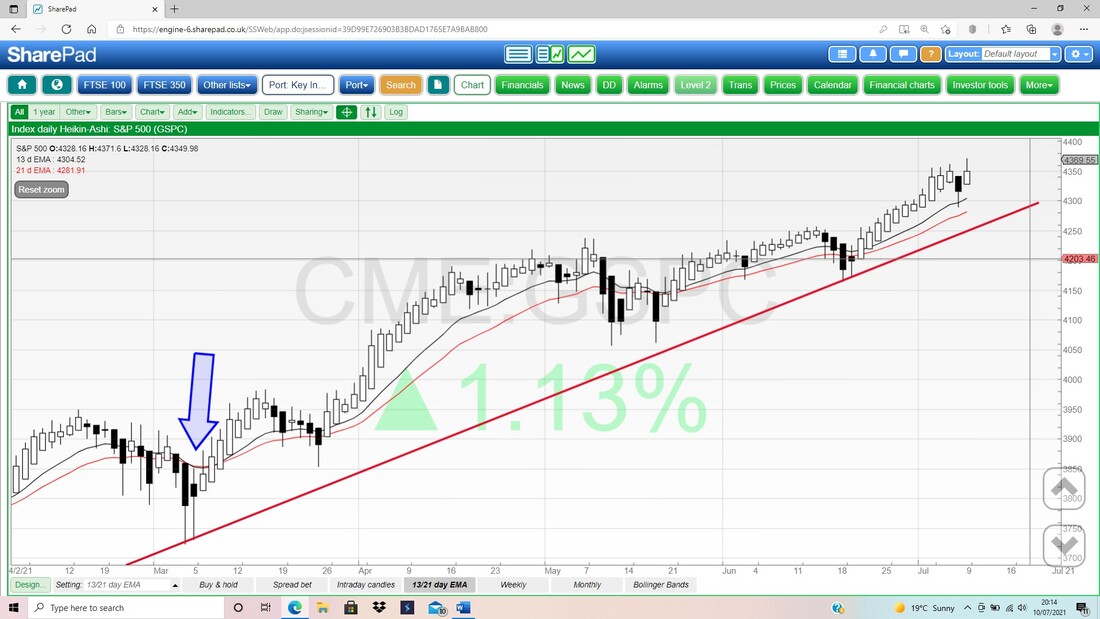
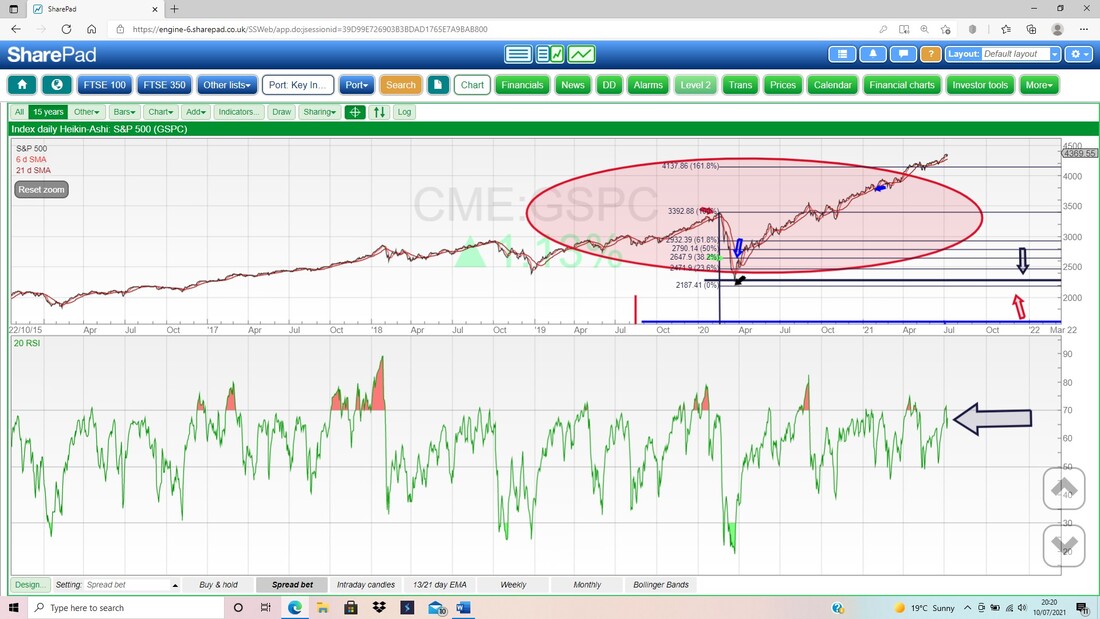
In the bottom window below we have the RSI (Relative Strength Index) for the Daily S&P500. On a reading of RSI 67, this is very high and near Overbought levels, but if you look to the left, it has often risen quite a bit more than this in recent sessions.
My Chart below has the Daily Candles for the S&P500 and the Pink Zone is marking the Upper and Lower Bollinger Bands. My Blue Arrow is pointing to a big White Up Day from Friday and this looks Bullish – building off the sort of Hammer shape Candle from Thursday. The Red Line is the Midpoint Line (Red Arrow) and is often Support – in this case, around 4325. The Top Band is up at 4385 and might cap upside for a bit.
Down below we have the Green Ellipse and this is marking strong Support, particularly at 4056. 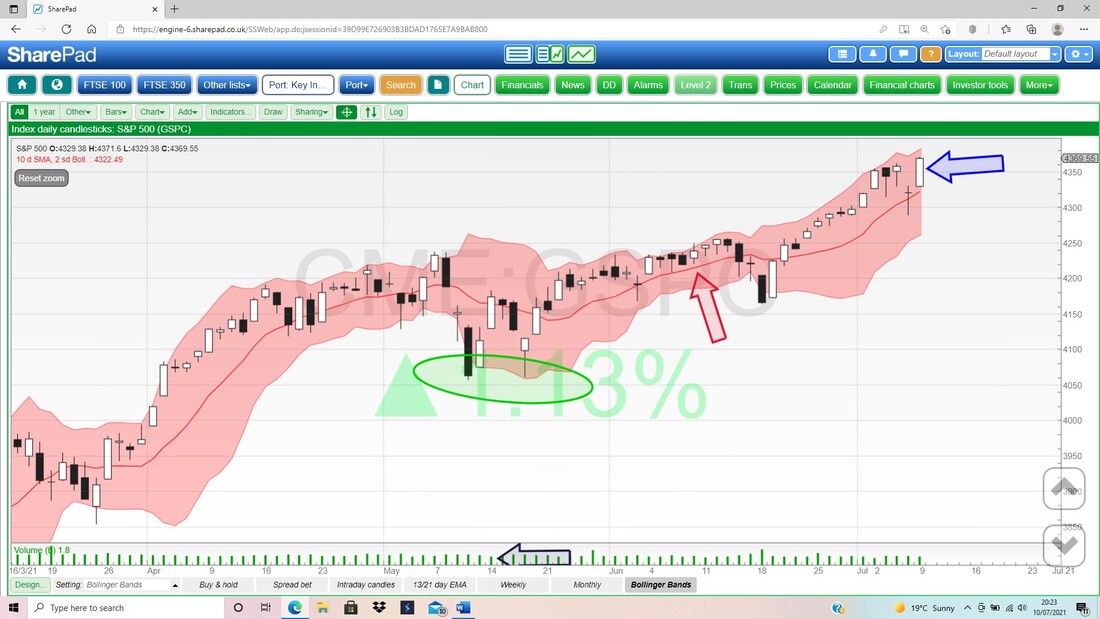
Brent Oil Composite
I always look at Oil because is has quite an effect on the FTSE100, and this is especially important as I run the Spreadbet Test System. First up we have the Weekly Candles and my Red Arrow is pointing to a rather mixed looking Candle from last Week. The High last Week was $77.9 and the Brent Comp Price needs to crack this level decisively. My Blue Arrow is pointing to Resistance at $75.60 and it has just about cleared this, but it would be good to see it keep pulling away from this and on to attack the Blue Ellipse Resistance, which is up at $86.7. That is probably going to be a tough area to get above. 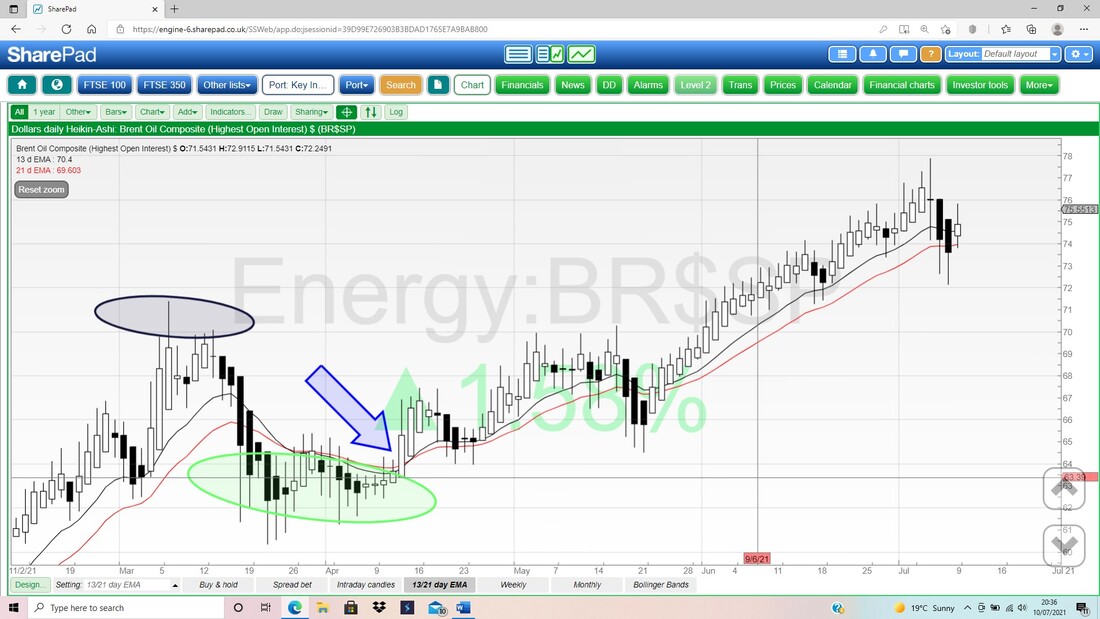
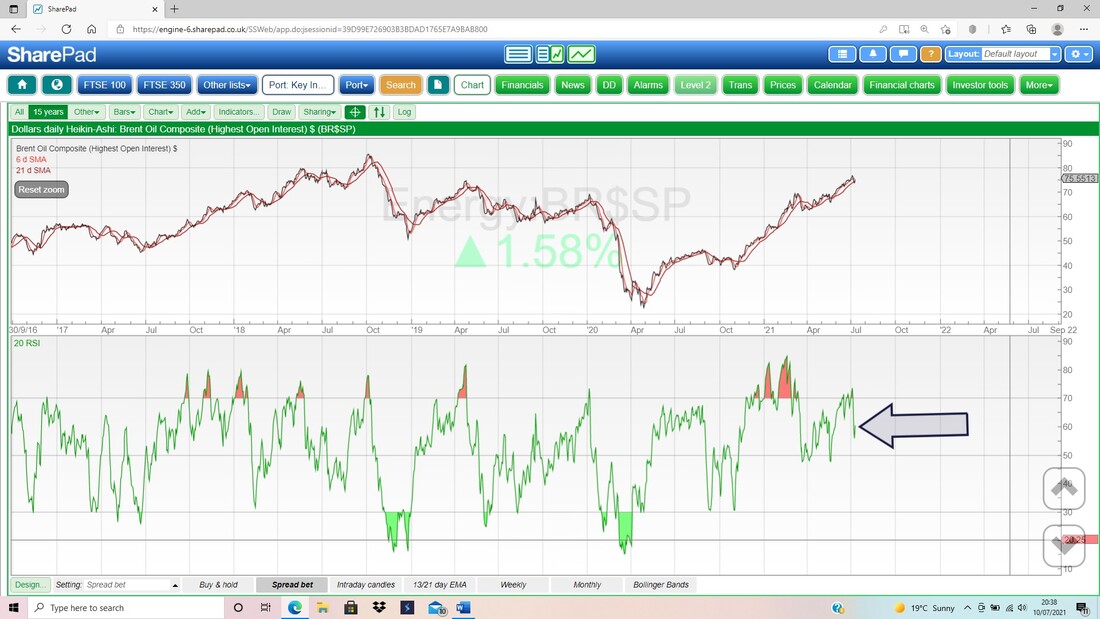
In the bottom window below we have the RSI for the Daily Brent Oil Comp Price. On a Reading of RSI 60 where my Black Arrow is, this is not high and it means the Oil Price can move up a lot from here.
FTSE100
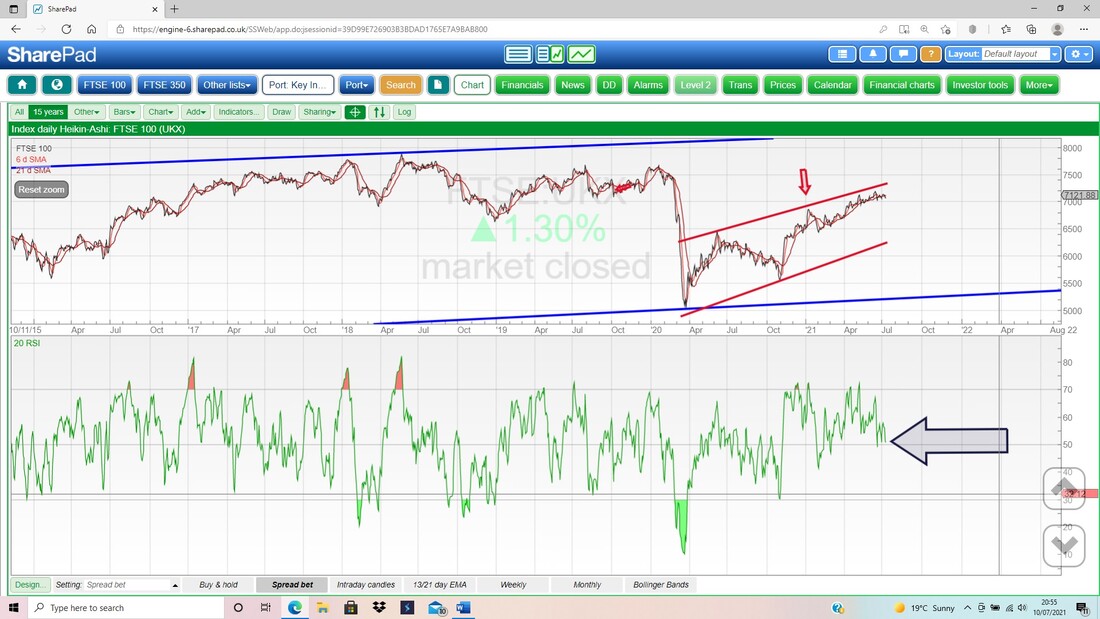
OK, now we get to the meat. Firstly the Weekly Candles for the FTSE100. My Blue Arrow is pointing to last Week’s Candle and this just shows a Reversal during the Week with the Low down near 7000, like on arguably the previous 6 weeks. It makes sense for 7000 to be a strong Support Area. To the immediate upside, the FTSE100 must crack 7217 and I would love this because such a move would push my Test System into profit for the first time. Above that my Black Box in the Left-Hand Corner, marks Resistance in a band up to about 7727 and if it can crack this, then eventually we might take on the All Time High which is up around 7900. If it can breakout of the ATH, that would be immensely Bullish. To the downside, there is Support at 7000, 6823 then 6618. 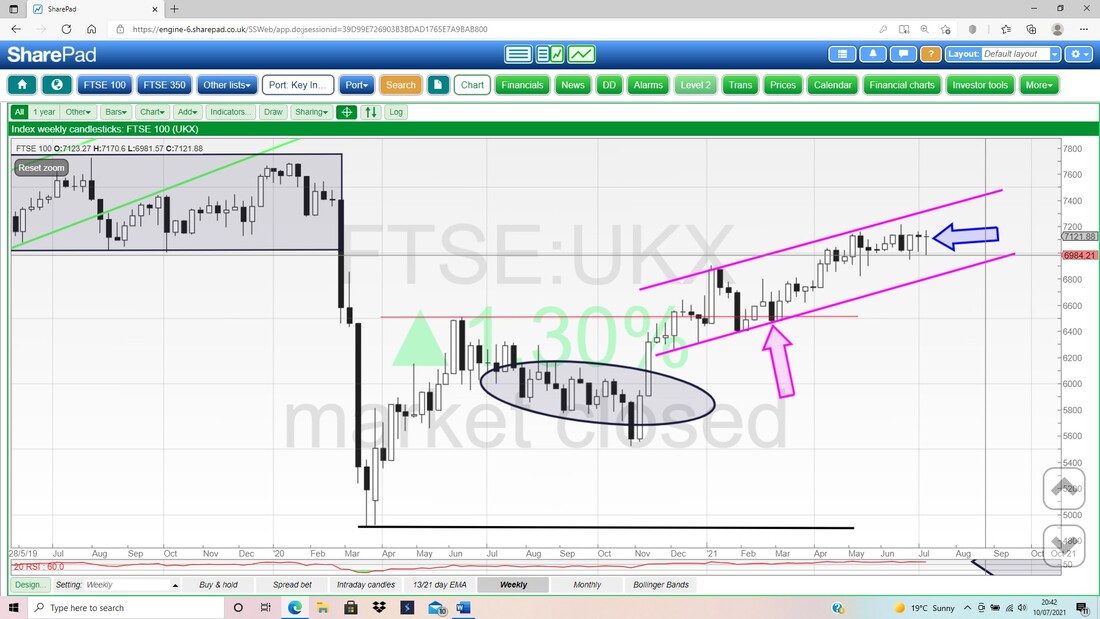
On the next Screen I have zoomed in on the Black 13 Day EMA Line and the Red 21 Day EMA Line. If you look to the right, then you should see that the 13 Day is above the 21 Day, so this is in Bull Mode, but note how the Black 13 Day has dipped down and it is near a Bear Cross. This means that if we see weakness early in the coming week, then there might be trouble brewing.
Sometimes (and this Chart is a bit like this) I find that a Black or White Candle might be obscuring a Bear or Bull Cross. When this happens, I usually quickly toggle the settings to a Line Chart rather than the Candlesticks, and by doing this I can see it easily. I then toggle back to Candles obviously. 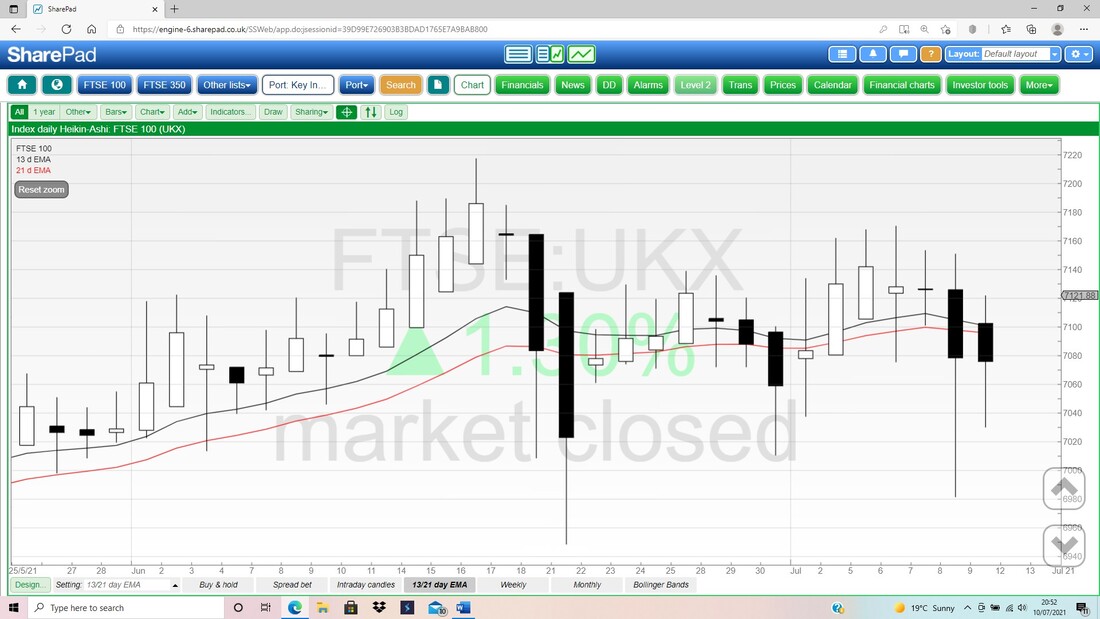
In the bottom window on my next Chart, we have the RSI for the FTSE100 Daily. On a Reading of RSI 51 where my Black Arrow is, this is almost bang on the Neutral 50 level, and means that it is neither Overbought, nor Oversold, in any way. If it turns weak, it can fall a heck of a long way, and equally, it if it decides to rise, then it can go up a lot.
Finally, we have the Daily Candles for the FTSE100 and the Bollinger Bands. My Black Arrow is pointing to a nice Big White Up Candle from Friday and this recovered a lot of the damage from the rough day on Thursday. This kind of Price Action is not a big shock in the quiet Summer Months, and I don’t see much need to worry. The Top Bollinger Band is up at 7185 and this might slow immediate progress to the upside.
OK, that’s it for tonight, good luck with the coming week and make sure you start to think about what you will do if we start to see a Sell-off in the Autumn, which I think is highly possible. Cheers, WD. 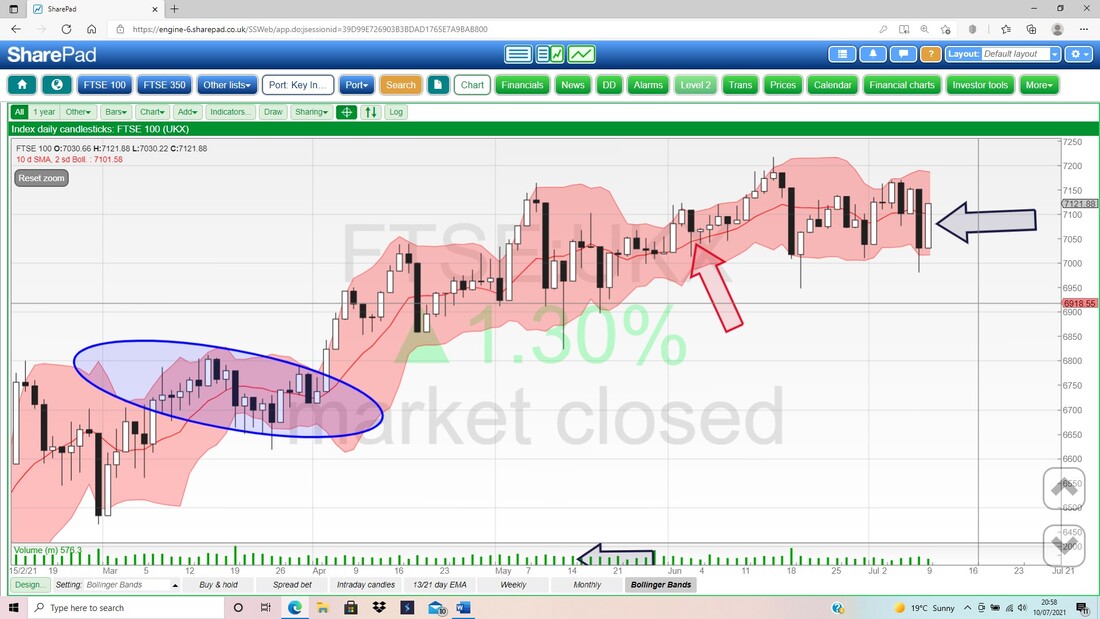
0 Comments
Leave a Reply. |

Stocks & Markets WheelieBlogsThese tend to be more Markets and Stocks related and timely - the Blog Page on the Main WheelieDealer Website has the 'Educational' stuff (well that's the theory anyway !!). Archives
October 2021
Categories
All
|
