

|
stocks & Markets blog |
|
“Rainy Days and Sundays”, not quite a Carpenters tune but after such glorious weather just a few days ago we have been treated to a total wash-out today and any plans I had to start seriously on the Jardin de Wheelie have been totally sidelined. So much for Spring…..
Well that’s 2 Months done and a sixth of the Year used up already - I wonder what the next 10 Months will have in store? - I suspect things will not be as strong on the upwards tack as they have been so far in 2019 as of course we have Brexit to navigate and Markets are up near All Time Highs again in the US (although not in the UK and Europe) and the situation we had during 2018 where Stocks were seen to be very highly valued is back again very quickly. Summer is usually a difficult time for Markets but March to May can be ok (although Summer Sell-offs often start in May) - but with Brexit and a ‘hot’ Market at the moment, we must be getting near some sort of Pullback or at least a Consolidation period where things go sideways and calm down a bit.
On Friday this Week we get the US Non Farm Payroll Numbers (’Napalm’) I think and this can cause some jumpiness on Friday afternoon - as usual 200k Jobs or so being created for the previous Month is the usual benchmark so it will be interesting to see what comes out. Having said that, the Numbers tend to be quite volatile and we get lots of Corrections to the data in coming Months normally.
On the Brexit side of things we are really getting to the crunch now with just 4 Weeks to go and I heard on the BBC News that T May has just 10 Days now to bring her slightly amended ’Deal’ to Parliament for a ’Meaningful Vote’ again and my hunch is that if enough is done on the Irish Backstop, then it is very possible that she can get the Deal through - it will be tight though. It looks like a separate Appendix or something is being created which puts in writing that the Backstop is temporary and I suspect there will be some sort of fudge so that the Attorney General, Geoffrey Cox, can proclaim (no doubt with much theatrics knowing him) that it is “Legally Binding” so that MPs who want a proper Brexit can vote for her Deal even though they know it is very substandard. If her Deal does not manage to get though the Meaningful Vote then I think I heard that the plan is to allow Parliament to Vote on various options for a way forward, but T May has already said that if her Deal fails then Parliament will get a chance to command her to trot off to Brussels again with the Begging Bowl to ask for an Extension to A50. Of course the catch to this is that Napoleon Macron has been saying that he will only accept an Extension if there is a good reason for it, but in reality I suspect it is the usual bravado we expect from the little chap and in truth he is just as scared of a shock ‘No Deal’ Brexit as all the other Leaders and they will grant an Extension (how long it will be is anyone‘s guess but 2 Months seems likely). That’s all well and good but I am not convinced it helps much because it just extends the misery and means we will be subjected to Tony Bliar spouting off about another Referendum and all that - I really can do without such lectures from a prime pillock like him. Hopefully T May has managed to wear everyone down and the MPs who want an easy life will just vote for her Deal however much they hate it - at least that will be the quickest and easiest way of avoiding ‘No Deal’. If the Deal is voted through, I would expect the Pound to Rally and this might drag on the FTSE100 - I am short on the FTSE100 so this would work well for me and perhaps I will get a chance to reduce the Shorts. If things drag on it is hard to work out what the Market reaction will be - perhaps the increased possibility of a Second Referendum (an outside chance because only about a third of MPs are in support of this) will be seen as positive for the Pound and avoiding the terror of ‘No Deal’ might be positive for the Pound. It is very hard to figure this all out !! Last Week Bit of a funny Week for me with not much happening for the first 4 Days which was mainly due to my Hedges I suspect but then on Friday, while I was skiving off down the Boozer, my Portfolio jumped up 0.9% with nice rises across my Portfolio and with not much drag from the Shorts - and this meant that on the Week I was up 1% which was very welcome. Overall I have gradually crawled back the damage from Patisserie Valerie CAKE going ‘pop’ and my Portfolio is now just over Breakeven for the Year which I am happy with when you consider I have been very highly Hedged for the last 2 Months and I took something like a 4% hit from CAKE. With all the obvious Uncertainty and Risk around I am happy to continue with my Strategy of not Buying anything and being more disposed to Selling stuff if the need/opportunity arises. I would like to unwind the Hedges if we get a decent Pullback but things could easily drag on around Brexit for possibly many more Months so I will wait and see what happens before making any significant Strategic Decisions. Volvere VLE and K3 Business Technologies KBT Event in London I noticed that Blackthorn Focus is running another smallcap investor briefing event on Tuesday 19th March in the City and Volvere VLE and K3 Business Technologies KBT are presenting. The event kicks off at 12pm in the Offices of KBT’s PR firm KTZ Communications who are at No 1 Cornhill and it’s FREE to attend and there's lunch included. Here is the link you can use to request a place at the event and it also has a Google Map thing so you know precisely where it is: https://www.blackthornfocus.com/blackthorn-event/apply/766-13eb21508e178f3d8bea279c5010f6d1fb749280 These are popular with some of the best Private Investors out there and currently the invitation is private to the Blackthorn Focus mailing list but after contacting David O’Hara the organiser this weekend, I've been given permission to share it with WD Readers. The two companies presenting are certainly investment grade. K3 (careful - there are two quoted companies called 'K3' - this one is the one that has been around much longer and has the ticker KBT) is a provider of software and tech services, typically to the retail sector. It's a £95m market cap (just below the magic £100m that might be keeping it off fund managers' radars), profitable and dividend paying. The shares are up 28% in the last 12 months as investors are buying into the new management's turnaround because K3 went through a difficult period a while back. I know VLE is well followed by many Readers and the Company buys other companies, often out of administration and then works to turn them around. You only need to take a quick look at the share price graph to see that it has a history of doing this with great success. The shares are up fourfold in five years as management have delivered one superb deal for shareholders after another and the Management here are seen as very capable. Blog Slate Last Week I shoved out a Blog that I had in Draft form for Months and Months and I had intended to use it for ‘emergencies’ and it therefore made an appearance because I am still working on the ‘Mechanisms of a Trade’ Blog and although I have that pretty much complete in Draft form now, I am still not totally happy with it and want to discuss some details with a couple of mates before I am happy that it is in a fit state to be published. As a result I might not be able to issue even Part 1 of this in this coming Week but I have an idea for another Blog that I can whip up pretty fast I think so that might have to be my contingency plan !! I am sure you would prefer the Trade Mechanisms Blog to be in very good shape when you see it rather than me rushing it out and it being pretty ropey. I have also thought up some other ideas for Blogs to do after these ones are out of the way and that should mean I have a good Pipeline going forwards for probably many Weeks - so there should be plenty of reasons to keep checking on the Websites. February is now done so I need to update the ‘Weekly Performance’ page and I will try to do that as quick as I can - I have quite a lot on this Week so I might not get the chance until next Week. Something else to keep your eyes open for is that ‘Special Project’ I have been hinting at - there is a good chance it will appear at some point over the next fortnight. From the mists of time….. Anyone who follows me on Twitter will know about my obsession with Candlestick Patterns - this Blog is a short one which shows precisely why I find them so useful: http://wheeliedealer.weebly.com/educational-blogs/candle-power Remember, the ‘Blog Index List’ on WD2 has all of the Blogs I have ever bashed out listed there and the Educational ones all have Links which you can click to get to them straightaway. There is a huge Archive of material there now and New Readers and Beginners should find this exceedingly useful. Let’s do them Charts then…… FTSE100 As always the Charts I show are grabbed from the excellent SharePad software that I subscribe to and if you click on them they should get larger so you can see more detail. First off we have the Daily Candlesticks for the FTSE100 going back around 9 months or so and what I want to show here is how we are between the Horizontal Red Lines which are shown by the Black Arrows at about 6860 to 7200 and this Range has dominated for quite a while now. Where my Blue Arrow is we turned down after trying to escape the Sideways Range but fell back into it. Where my Red Arrow is we had a ‘Death Cross’ between the Lighter Blue Wavy Line which is the 200 Day Moving Average and the ‘faster’ Darker Blue Wavy Line which is the 50 Day Moving Average. Note this 50 Day MA has turned up recently although the 200 Day MA is still sloping downwards and we need the 50 to cross the 200 from underneath to get much more excited that the Rally is sustainable. The Blue Horizontal Lines down the bottom mark where I opened my Hedges - right at the bottom then !! These Hedges are still running so I might need to extend the Blue Lines soon. 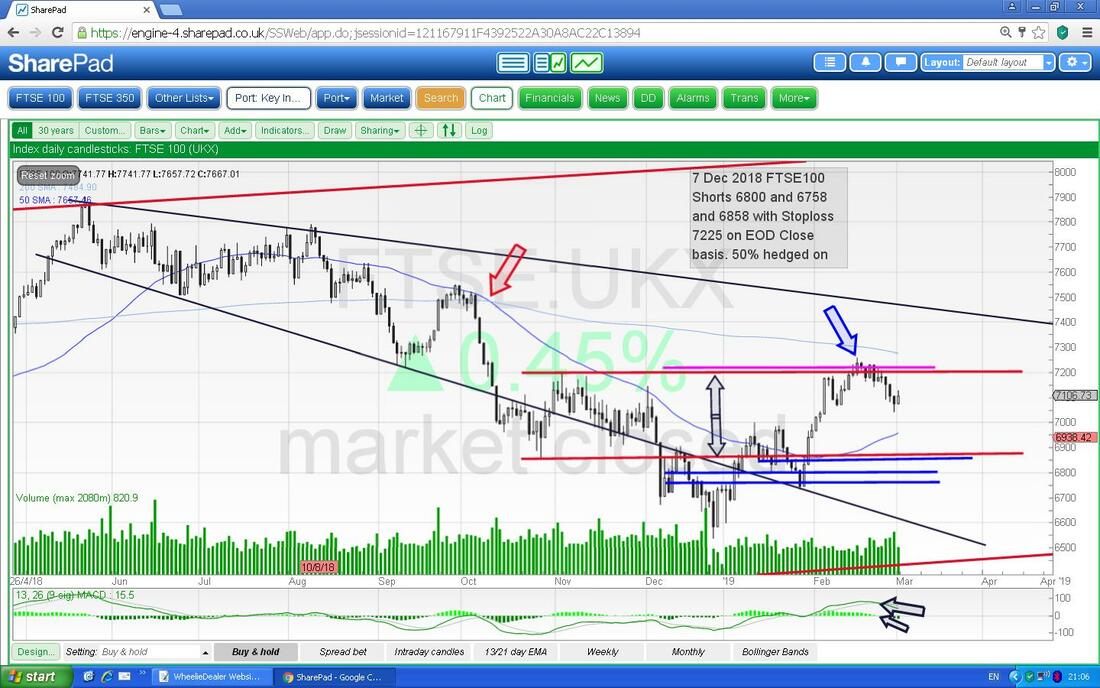
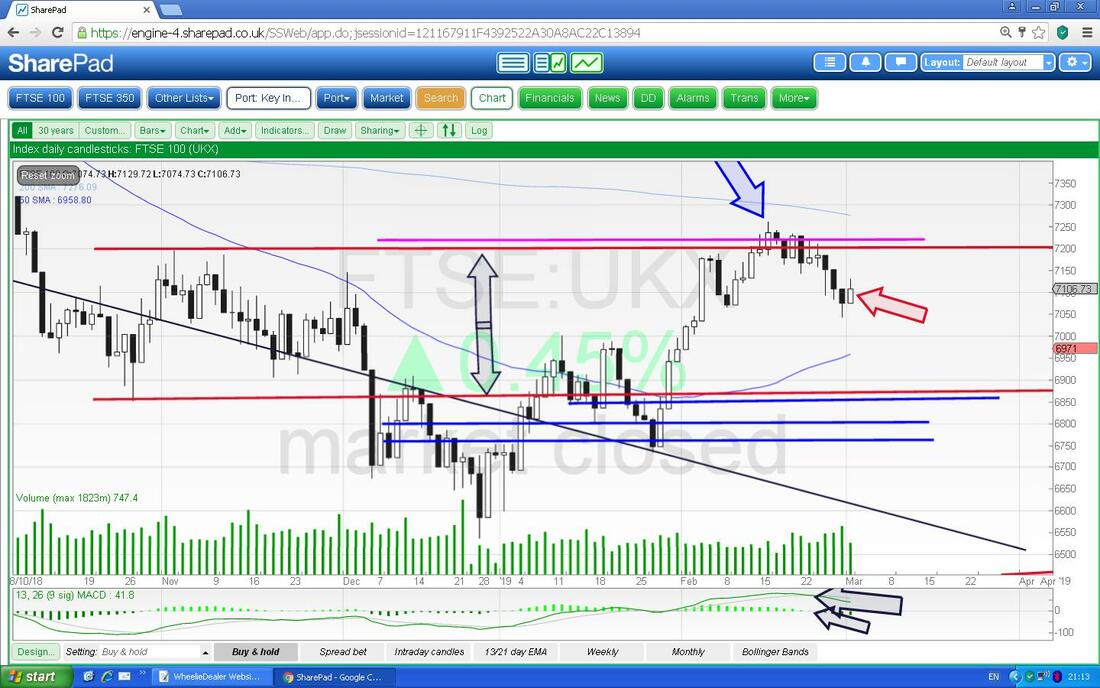
On this next Screen I have zoomed in a bit so we can see the Candles a lot more clearly and where my Red Arrow is we had an Up Candle on Friday which was unable to hold the High of the Day. However, if you look at the Candle from Thursday, it has a bit of a ‘Tail’ going down which shows the FTSE100 recovered off the Low on Thursday and perhaps it has found a Short Term Bottom at that Low which is 7041. That Level is now really important Support - if it breaks, then we could go a lot lower and perhaps test the bottom of the Range.
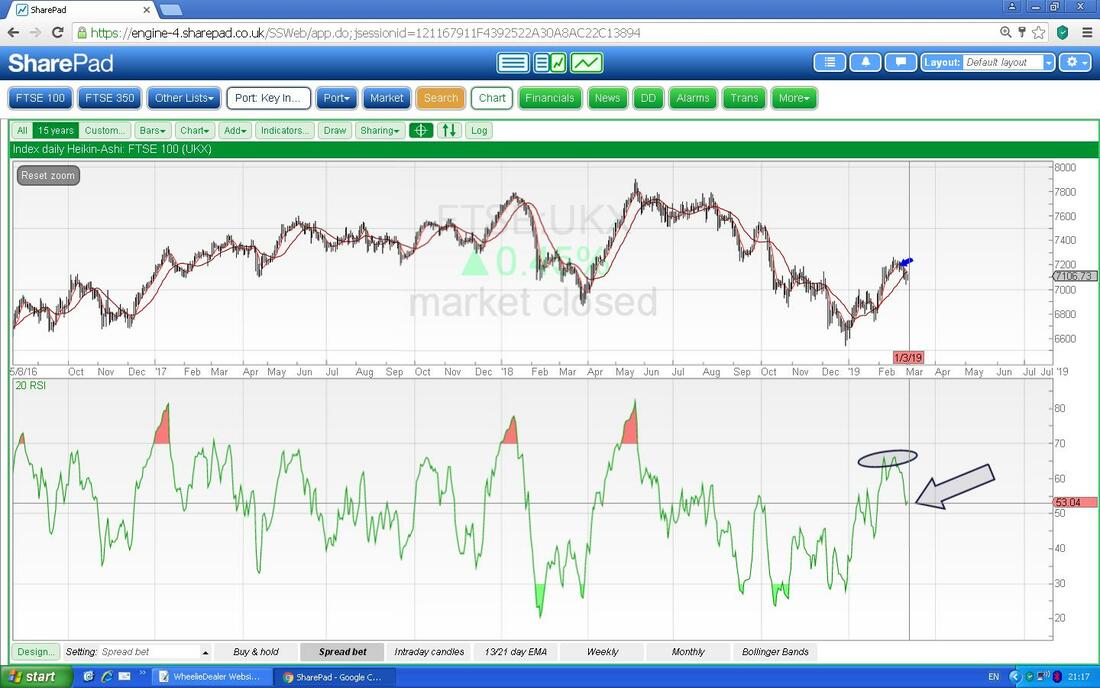
In the Bottom Window below we have the RSI (Relative Strength Indicator) for the FTSE100 Daily and on a Reading of RSI 53 where my Black Arrow is it is around neutral and clearly can move a lot in either direction !!
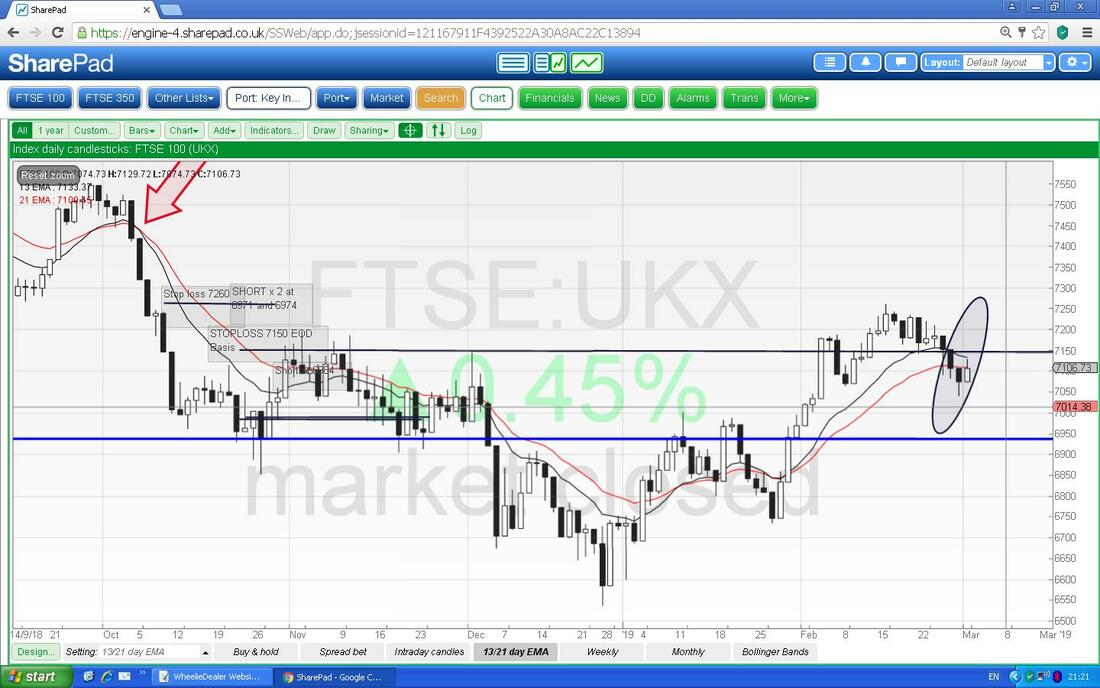
Next we have one of my favourite Signals - where my Ellipse is (sadly I still can’t find a Circle Tool !!) the Black Wavy Line which is the 13 Day EMA (Exponential Moving Average - weights more recent Days heavier) has been curving down towards the ‘slower’ Red Wavy Line which is the 21 Day EMA. If we get a Crossover here, then that would be a Bearish Cross which is similar to what we had where my Red Arrow is in the Top Left Hand Corner. These Crosses (both Bearish and Bullish) tend to be very predictive of events in the following Weeks.
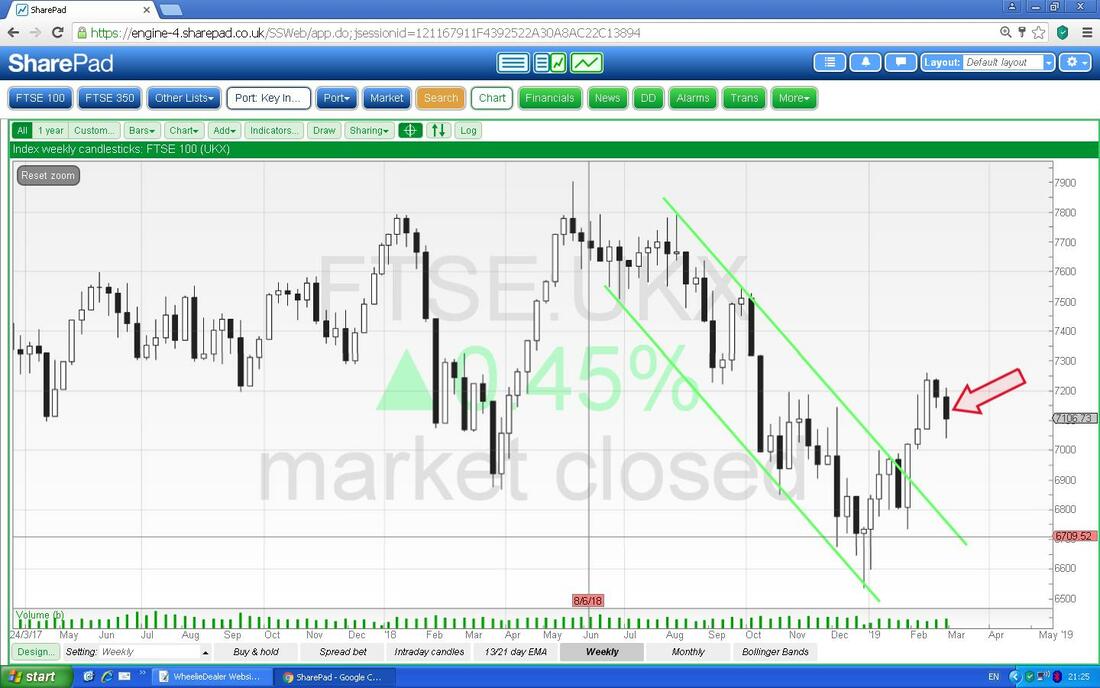
The next Chart is the Weekly Candles for the FTSE100 and where my Red Arrow is we had a Down Candle but note it did manage to Close up off the Low - perhaps this is a Reversal but it is not ‘textbook’ by any means and on the face of it I would say this is more Bearish than Bullish.
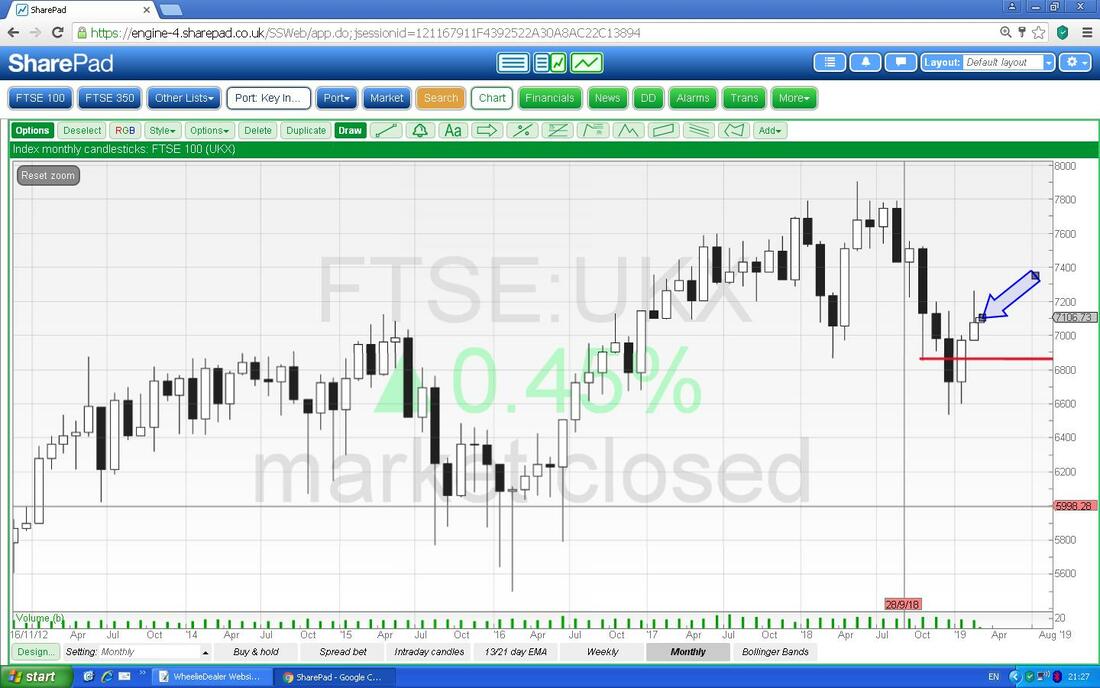
This doesn’t look so good. Now we have the Monthly Candles because February is complete and this now has meaning. My Blue Arrow is pointing to an Inverted Hammer sort of Candle - in other words it Closed well off the High of the Month - and this looks Bearish. To be fair, the Context is not textbook really as you would want to see such a Candle after a strong run up for several Months but it is clearly not good that it was unable to hold the High.
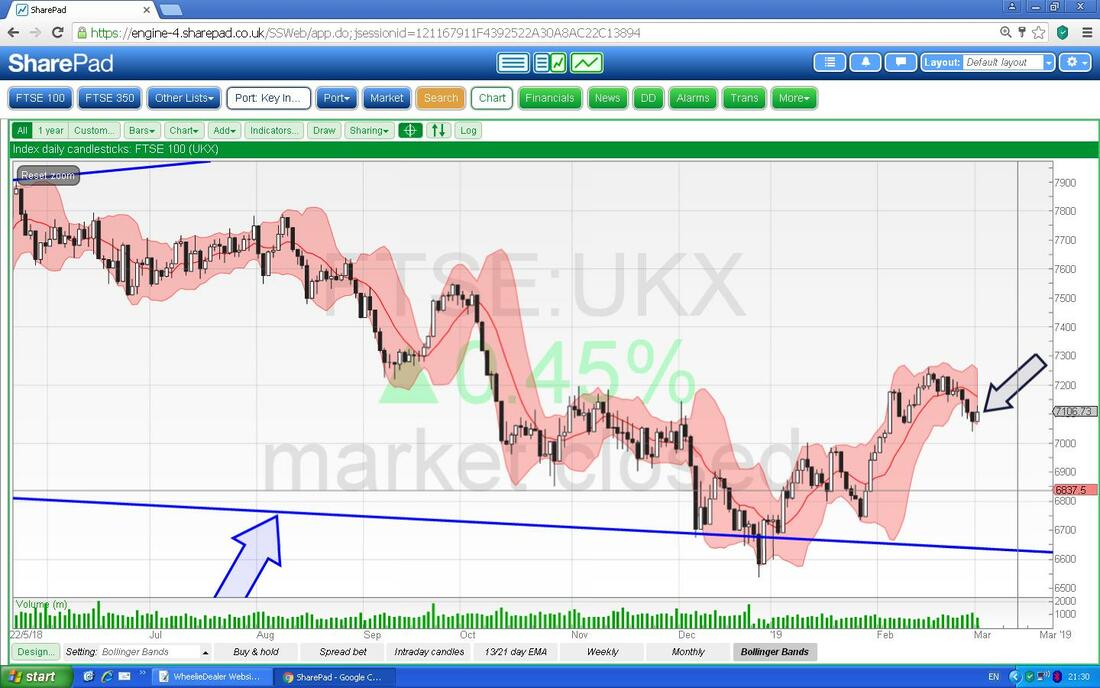
On the next Chart we have the Daily Candles with the Pink Shaded bit representing the Upper and Lower Bollinger Bands. My Black Arrow is pointing to where the Candles from Thursday and Friday are down near the Bottom Band and this suggests we could turn up short term.
FTSE250
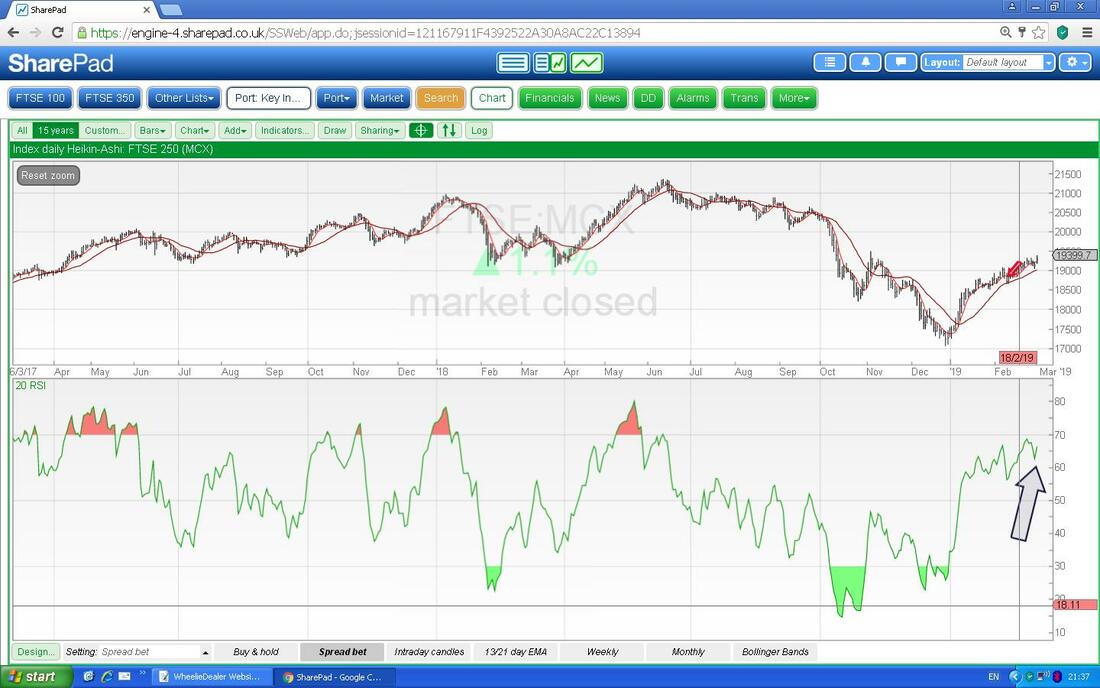
Next we have the Monthly Candles on the FTSE250. These look better than on the FTSE100 and my Black Arrow is pointing to the Up Candle from February. Note the Small White Up Arrow that is purely for 1 Day of March so it has no validity yet. The key now is that Red Line at 19500 and this is really important Resistance to break above - if it does this, then it should go much higher. 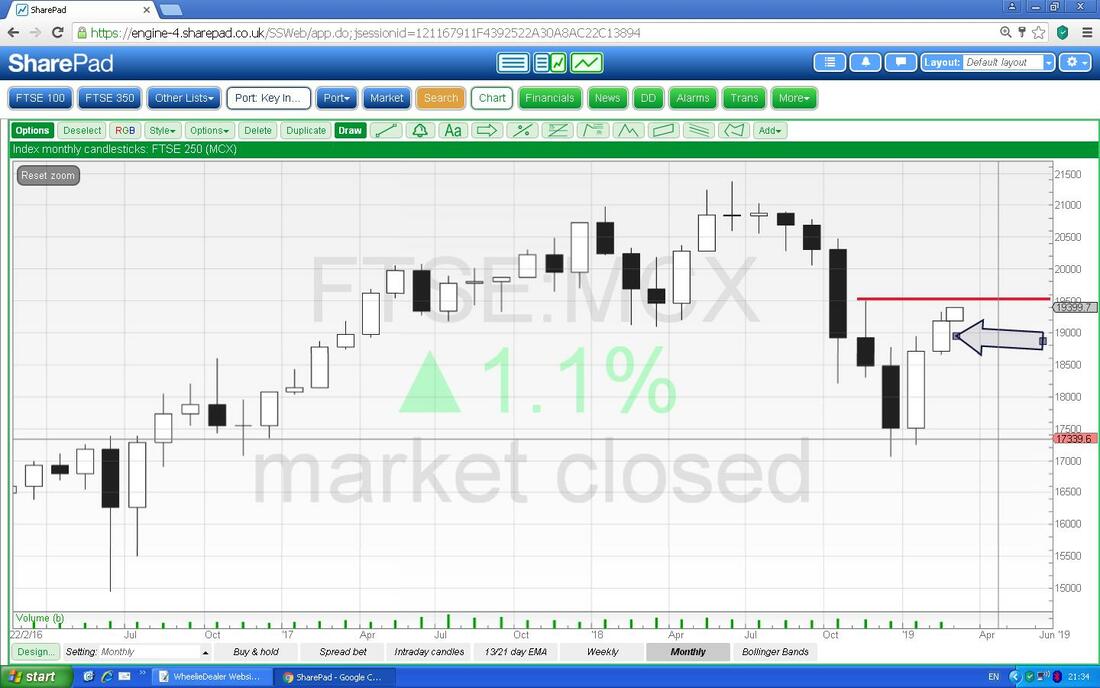
In the Bottom Window on the Screen below we have the RSI for the FTSE250. Where my Arrow is there is a Reading of about RSI 66 and this is quite high - it can go higher and often ‘goes into the Red’ which you can see if you look to the Left but it is a high level.
Pound vs. Dollar
With the value of the Quid having quite an impact on the FTSE100 in recent Years, I tend to look at the £/$ every Night but I don’t always put it in my Weekend Blogs (if you follow me on Twitter you should be able to see a series of Tweets that I usually send out around 10pm to 11pm ish Monday to Friday which have lots about the Index Charts and some Stock Charts on them). On the Chart below first off look at my Ellipse which is showing we nearly have a Bullish ‘Golden Cross’ between the Darker Blue Wavy Line which is the 50 Day MA and the Lighter Blue Wavy Line which is the 200 Day MA - if this happens it would suggest the Pound is going to gain more but of course this is very much related to what happens on Brexit in the next few Weeks etc. If the Pound can keep rising then the first Hurdle is my Red Line (Red Arrow) at about 1.35 and then my Green Line (Green Arrow) at a bit above 1.36. A rising Pound might hurt the FTSE100 but help the FTSE250. 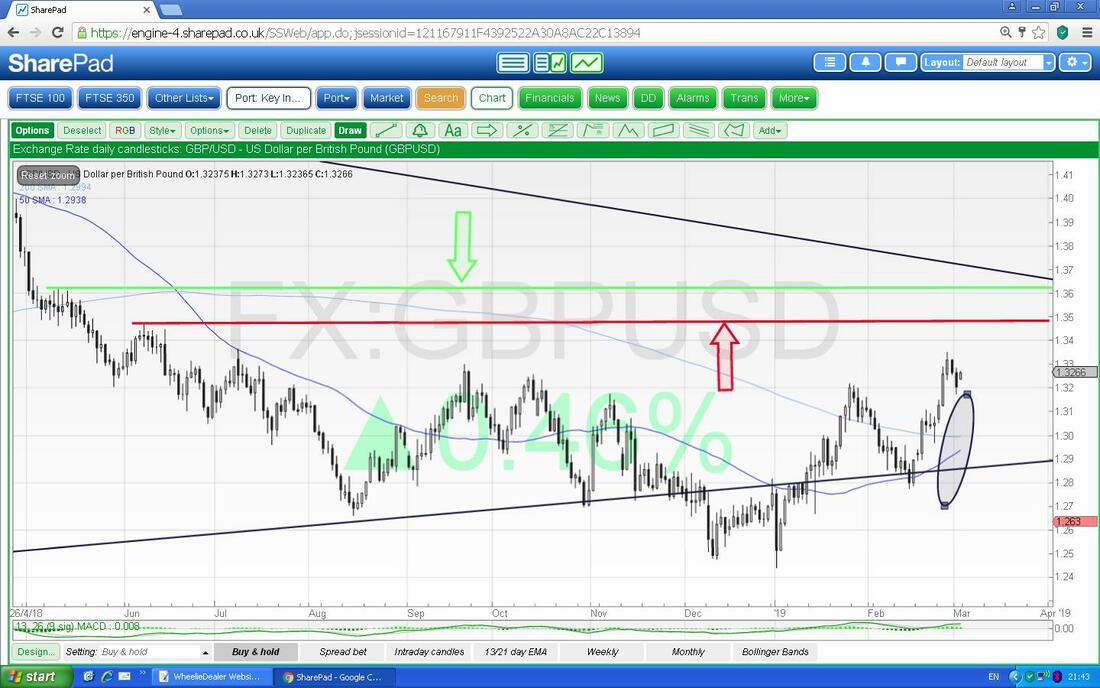
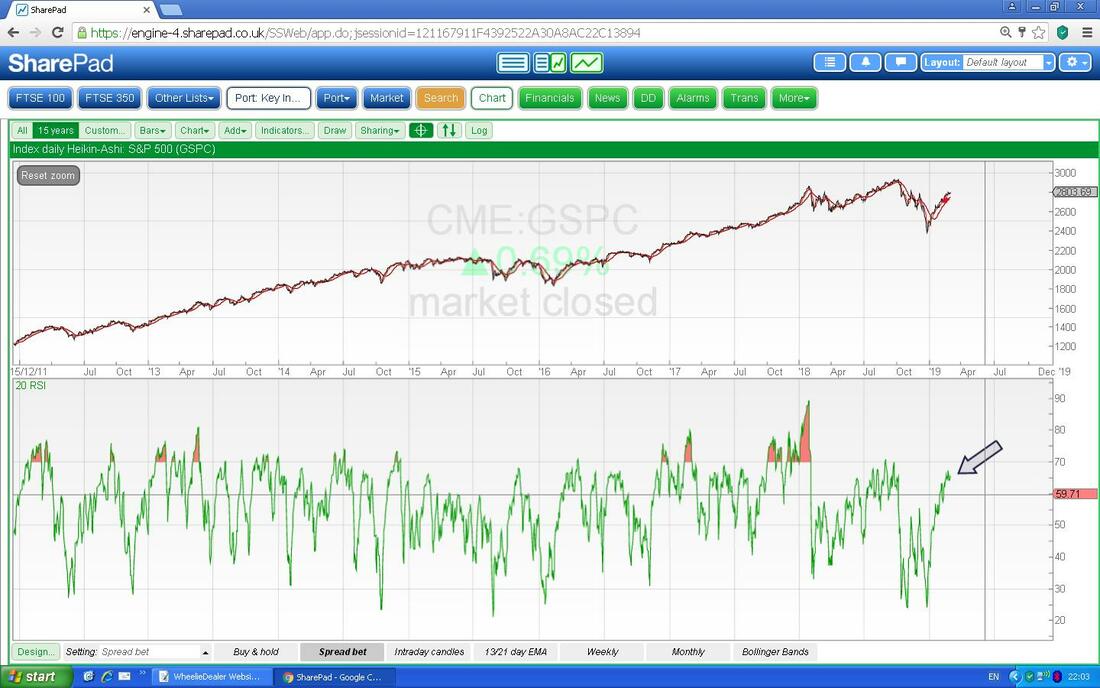
S&P500
I also have a small Short on the S&P500 so I am very interested in what is happening here. This is my ‘working’ Screen so it is quite messy, but the key thing here really is that Black Horizontal Resistance Line marked by my Black Arrow at 2816. Where my Black Ellipse is it looks like the Daily Candles turned down Last Week but on Friday they turned up again and maybe they will try an assault on that 2816 Line. If it gets above the Line, then it is not far to the All Time High up at around 2942 ish. My Blue Arrow is pointing to the 50 Day MA Line and look how it has started curving up. It is heading towards the 200 Day MA Line which is marked by my Red Arrow but it will take a while to get there - if it can cross from underneath that would be a Bullish ‘Golden Cross’. 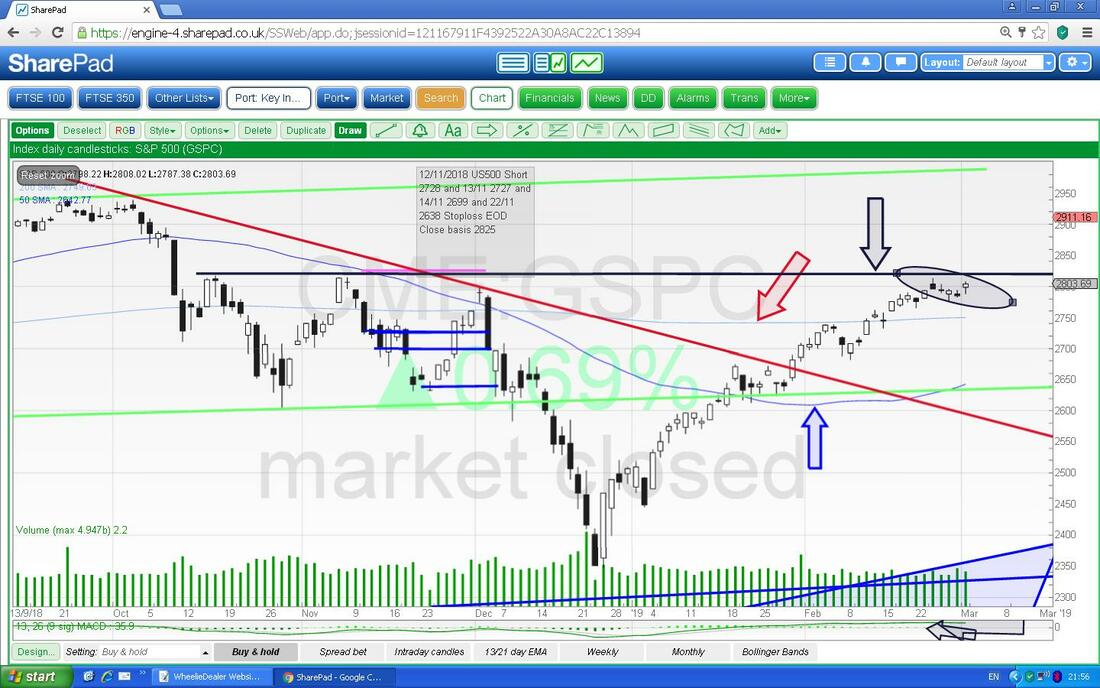
Next we have the Weekly Candles on the S&P500. My Red Arrow is pointing to a Hammer Candle but in this Context after such a strong move Up I would say this could mark a Reversal Point - so that Resistance Line I mentioned above is crucial here if we are to avoid Turning down.
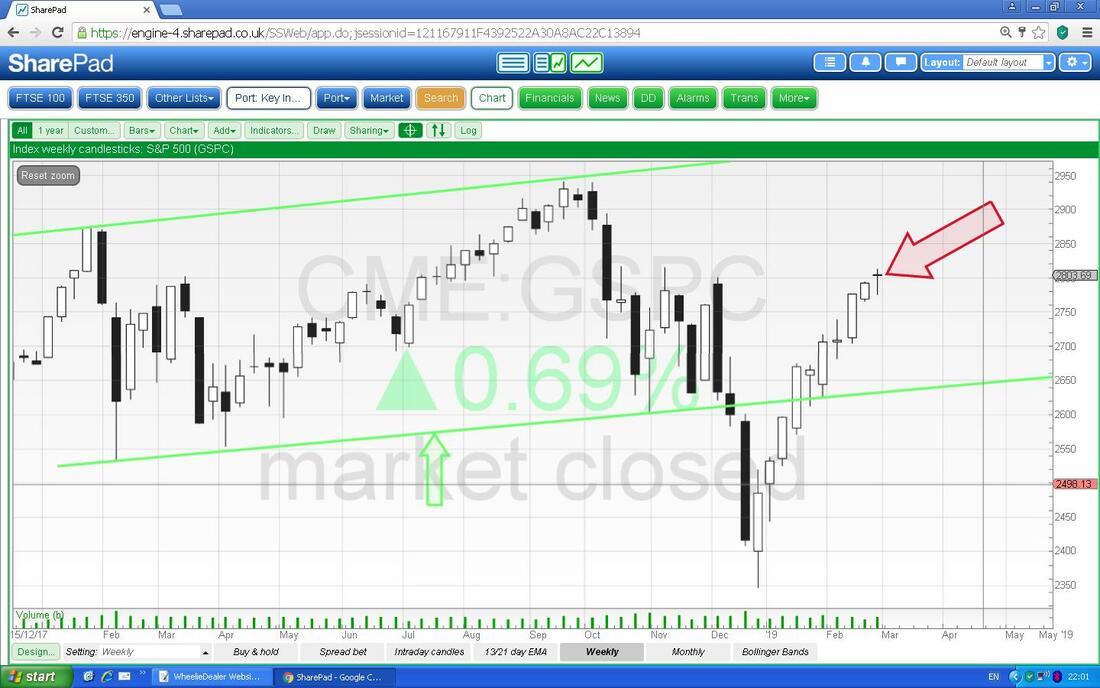
On the text regarding the Weekly Candles above I mentioned the ‘Context’ and how it had already done a strong run up. This got me thinking about the RSI so I thought it would be worth checking that - on the Bottom Window below where my Black Arrow is we have a Reading of RSI 66 which is very high although not as extreme as the S&P500 has been in the recent past - but 2017/2018 were quite unusual in how Bullish the US Indexes were.
Next it is the Monthly Candles for the S&P500 and my Blue Arrow is pointing to a Bullish looking White Up Candle for February. Ignore the funny little bit which is the start of March’s Candle and invalid until we get a full Month.
Consider how high we are now and so close to the All Time Highs. Last Year it was common parlance to say that US Stocks, particularly the Nasdaq, had got over-valued and that this was part of the ‘reason’ for the Correction we had at the end of 2018. Now we are nearly back at those levels and Tech Stocks especially do look expensive again - but I won’t be all that shocked if they go above the ATH in time. 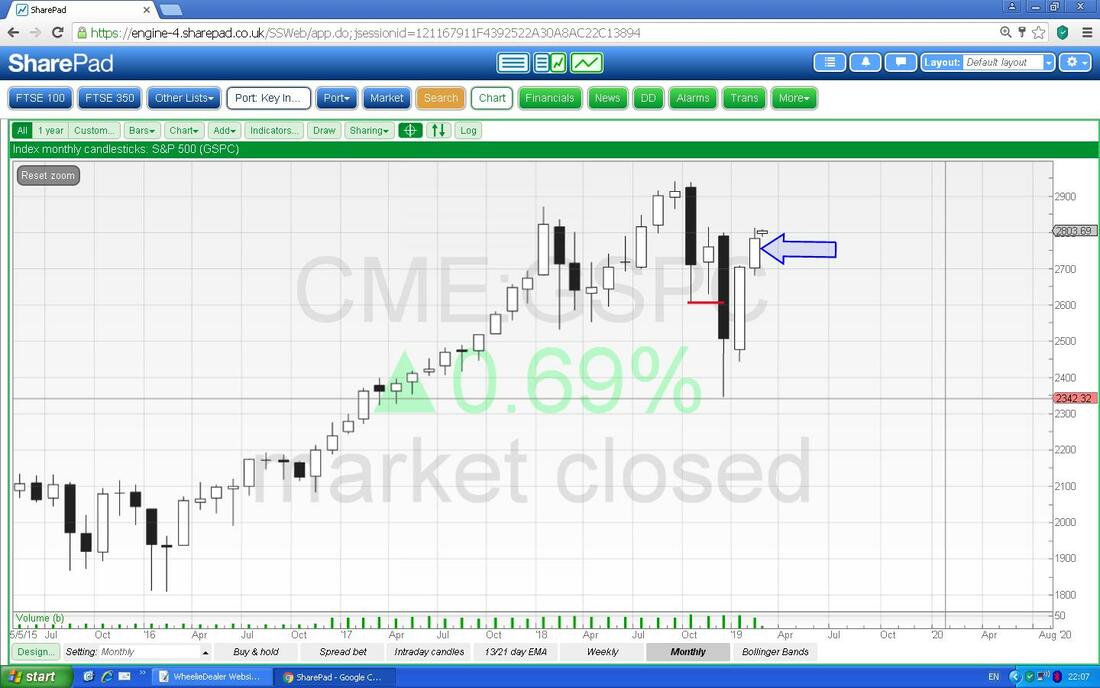
Superdry SDRY
I hold SDRY and it has been a right pain in the Butt lately. Anyway, there is a lot of talk about one of the Founders, Julian Dunkerton, returning to the Company and if this happens it might be seen by the Market as a very positive development. On the Chart we have a very clear Downtrend Resistance Line as shown by my Black Arrow and if there is to be a turnaround here, then that Black Line needs to be broken through and hopefully with some upwards momentum. 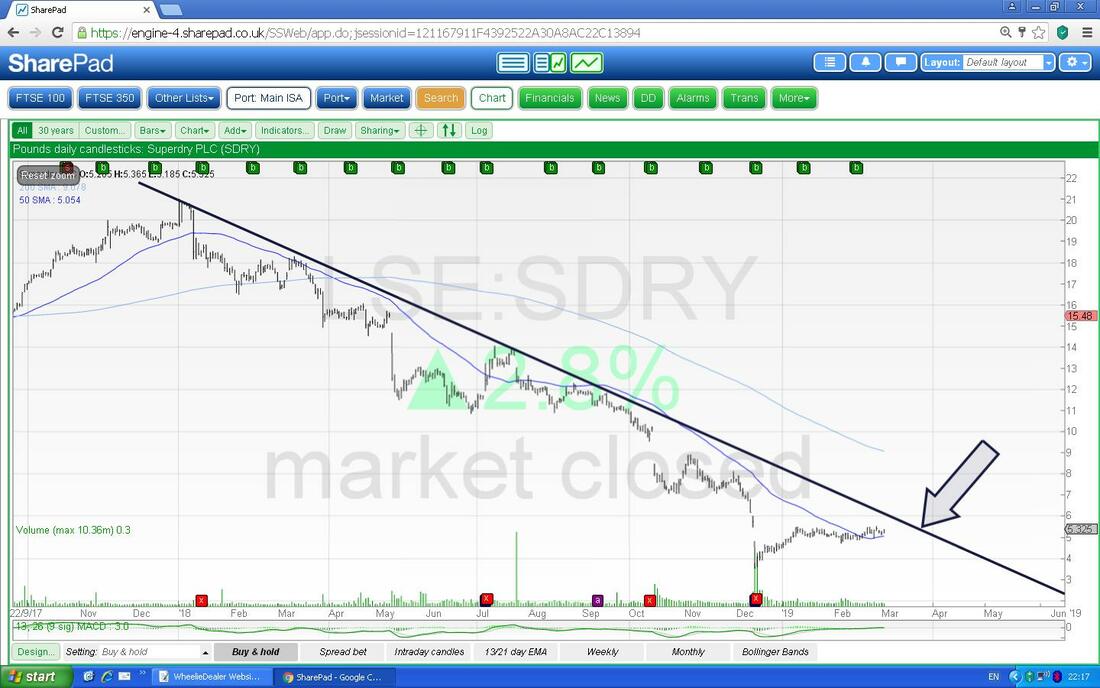
MPAC Plc MPAC
I think this Stock is crazy cheap and have quite a Position in it for a Small Stock. Anyway, it has Results on Tuesday and if they are good we need it to Break higher through that Black Horizontal Line marked by my Black Arrow at about 153p but to be sure a Close above 155p would be a good hint that it is going to keep moving up. I think if the Results are decent then we will see this move. Note there is then a ‘Gap’ up to about 180p so it could close that Gap very fast. We might also get a Bullish Golden Cross between the 50 and 200 Day MA Lines. 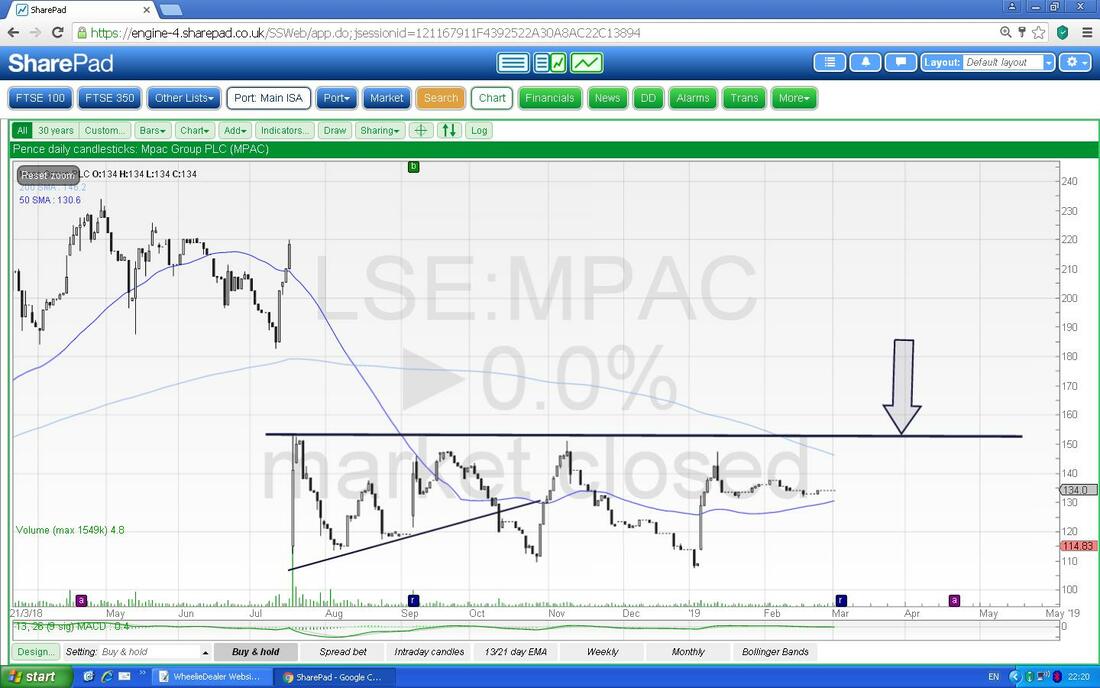
Diversified Gas and Oil Corporation DGOC
This is a big favourite of mine and had Results last Week which held no surprises but just showed that DGOC is growing up and becoming more ‘Professional’ as it adds scale. I am very happy holding these and expect more upside from Acquisitions and it is worth appreciating that the Results were based on considerably lower Production Levels and I reckon we will continue to get juicy Dividends going forwards. On that subject, the Forecast Dividend Yield is 6.1% and then 8% the following year so the attraction is obvious. This Thursday it goes Ex-Dividend for 3.3 Dollar Cents. There is a very clear Triangle on the Chart here. Obviously I want it to Break upwards through the Black Line at the top (Black Arrow) and if it drops below the Red Line (Red Arrow) that is bad. DGOC is AIM Listed but is looking to move to the Main Market which would be nice. Sorry peeps, I wanted to do more Stocks in this Blog but I have timed out and need to get it Proof Read and uploaded to the Website System thing so I will knock it on the bonce there. Good Luck in the Week ahead and I hope the Storms avoid you !! Cheers, WD. 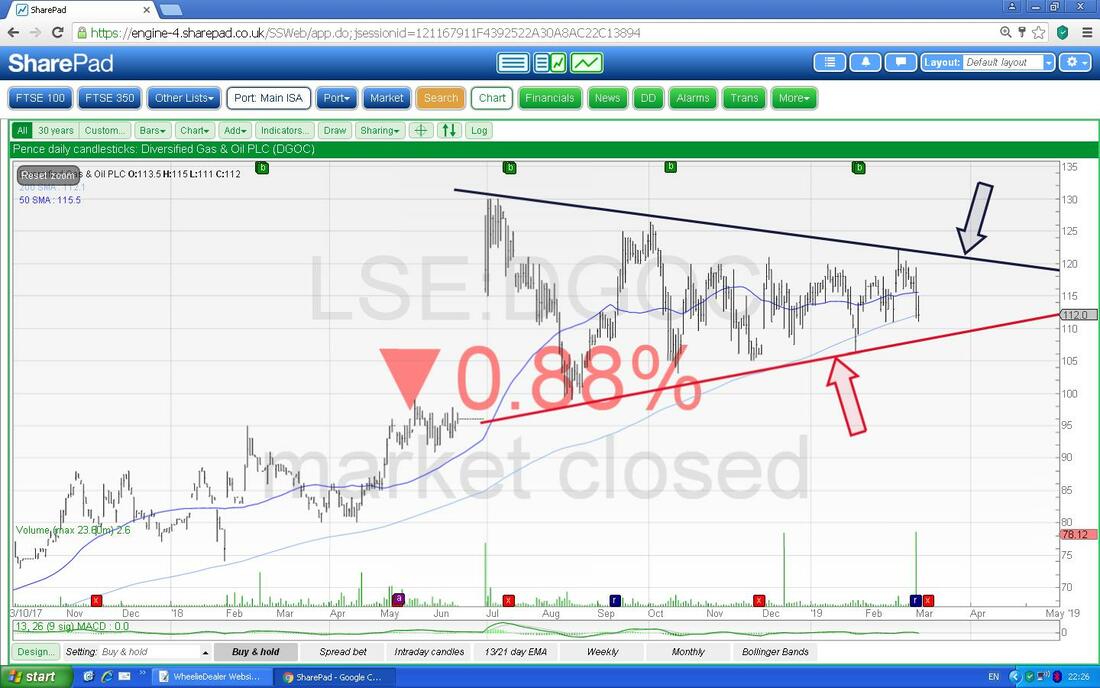
0 Comments
Leave a Reply. |

Stocks & Markets WheelieBlogsThese tend to be more Markets and Stocks related and timely - the Blog Page on the Main WheelieDealer Website has the 'Educational' stuff (well that's the theory anyway !!). Archives
October 2021
Categories
All
|
