

|
stocks & Markets blog |
|
I had a mixed week with my Portfolio just scraping through with a tiny hit and with a visit to my Doctor back on Monday which involved some good news really, but also a bit of not-so-good news.
Prior to the visit to the Surgery (first time since the C19 shenanigans and it was a bit strange with all the PPE requirements and all that), I had a District Nurse come round and take some blood samples; so it was great to hear that they found nothing in the blood and it looks like I might have a few years left in me yet (just as well because the Blog backlog is insane).
The Doc did a pretty good check around all the usual stuff and said she could find nothing obviously wrong. This is consistent with my thoughts in that apart from the uncomfortable state of my stomach/abdomen, I feel absolutely fine and I am eating and all the related functions with no worries at all. I don’t feel sleepy or anything although of course I am totally hacked off with the Lockdown tedium and all that (and being driven progressively more madder).
So the ‘bad’ news is that the Doc can find nothing wrong with me and it means she is referring me to Stoke Mandeville Hospital for them to figure it out. I guess that will involve CT Scans and Ultrasound and X-rays and all that (strewth, I must glow like a Ready-Brek advert by now) and goodness knows when it will happen. It is frustrating as hell and stops me doing things I want to do but on the whole I feel ok most of the time. The really irritating thing is that sitting at my keyboard and working on blogs and stuff just makes me feel rubbish after a while. It is the leaning forwards and as long as I deliberately keep myself very upright, I can deal with it. It’s just typical though because with the boredom of Lockdown I really could be cracking on with stuff and getting a lot written; and there is loads I want/need to write. Ah, one thing that is good news that came out of the visit to the GP was that I asked her about getting a C19 Vaccine and she said to me “Well, it wouldn’t be very good for you to catch it”, which totally lines up with my thinking because my lung capacity is pretty feeble. She said she would look into it and I was expecting a trip about a mile up the road to Windsor Racecourse where they do it (hopefully the Horse Needles are not used !!), but I had a total shock when 2 ladies turned up at my front door on Tuesday morning, saying they were here to stab me. It was all done very slicky and no pain or anything although they did forget to give me the paperwork and one of them returned 5 minutes later. I have noticed nothing too serious in terms of side-effects and to be honest what I did have (a bit of shivering on Tuesday night in bed for about 20 minutes) I am not sure if is a consequence of the Vaccine or not (I had the AstraZeneca one). Apparently it takes 2/3 weeks to get some antibodies built up but I am pleased to have got this done and to see what is already a very low risk around here for me, reduced even more. Last Week My Portfolio suffered to the tune of about 0.3% last week and I am really pretty happy about this. Things started quite well but Thursday was a bit of a shocker for me with my Portfolio getting really spanked and seeing falls across the board. So at the Close on Thursday things looked a bit grotty but the bounce on Friday and the huge contribution from MPAC gaining near 10% after being tipped in ‘Money Week’ magazine, turned things around and meant just a small bit of damage for the week. Phew. I’ll look at the Charts for the Indexes in a bit but from what I saw on Friday evening, it looks at the moment like the weakness is just a consolidation type of move and not anything particularly worrying. I will track the situation closely but it means that really I am in ‘Sit and Wait’ mode and I don’t see a great need to do anything. I am 100% invested and I have no great urge to sell anything (although a few positions are getting quite large relative to others and I will keep monitoring how they are shrinking or growing etc.) and I am really just focused on sensing if I need to Hedge at all. I have been thinking about buying something new (probably SUPR) or topping up on something in my Income Portfolio, and I had a look at how it was a couple of nights ago. It turns out a bit disappointing with the Portfolio actually down a little bit on 2021 so far (thank goodness my Main Portfolio, the WD40, is doing very nicely !!) and there is not much spare Cash in there. I need to add a bit to buy something and although I have been taking a lot of Cash out of my Spreadbet Account, I still do not feel that I have enough of a pile built up so that I can easily weather any storms. At other points in the year I might feel that I have enough Cash, but after such a strong run up and with the March/April months not far away, I feel a bit nervous about committing my Cash if I don’t need to. I saw on Twitter today that igIndex are raising Margin Requirements for a lot of smaller Stocks and I hold FCCN and SDRY that will be impacted by that but it won’t be much thankfully. In the bigger picture it is a bit concerning that igIndex are doing this because it suggests they are preparing for volatility – and that would be no surprise with far too many new Retail Punters being sucked into playing the Markets and there is far too much excitement around. On Monday we should get the new ‘Roadmap’ out of Lockdown from Boris and god knows what that will include and how it will impact Markets. I guess the focus will be on the Pub, Restaurant, Travel, Non-Essential Retail, Entertainment etc. sectors and they might move up if the plans to allow them to open more are not too far away. I don’t hold all that much in these Sectors apart from a few clothing retailers and some travel stuff. I don’t have hospitality at all (but I would like to be able to go to the Pub Garden soon !!). Blog Slate Sadly there isn’t a huge amount to report here although I did manage to make a bit of progress on the ‘Buy Rationale’ blog I am writing for Lok ‘nStore LOK but there is still a lot to do. I really enjoyed doing it and I am discovering new things about them all the time as I go along, but it made me feel rough the next day so that is the drawback. I will try to progress it as I am able to. In the coming week I should be recording the next Podcast with Peter C3 and I have plenty of ideas for that one (and lots of questions from listeners which need a response), and that one, TPI 43, should appear for next weekend, if all goes to plan. If you haven’t heard the most recent Podcast, then you can catch TPI 42 at the Link below on Soundcloud or if you go to the ‘Conkers Corner’ Channel on most big-name Podcast Platforms like Youtube, Spotify, Apple, Overcast, Google+, Audioboom etc., then you should find all the ‘Twin Petes Investing’ Podcasts there. Oh, and on WD2 I have a page that has these amazing widget jobbies where you can play the Podcasts direct from the website page. https://soundcloud.com/user-479955511/conkers3-wheeliedealer-42-1400-return-pton-bynd-tstl-sdi-ua-rbgp-mano-duke-gaw-heiq Digging in the Archives You can find the full list of all the Blogs I have written since starting the WD thing on the ‘Blog Index List’ page on WD2 – and the Educational ones all have Links so you can find them dead easy. From that list I bring you this one, which was one of the first I ever wrote but I recall it being very well liked: https://wheeliedealer.weebly.com/educational-blogs/beware-of-opinion-it-will-give-you-a-nasty-bite-on-the-bum OK, let’s see what these Charts have in store for us…….. S&P500 As is always how it goes, the images I show are all taken from the classy SharePad software that I use and if you click on them then they should get larger so you can see more detail. If you fancy using SharePad or ShareScope yourself, then there are ‘Adverts’ all over my websites which have an offer where you can sign up and get 1 month of Free Data. I also get a kickback from it so thank you very much !! It is ‘best practice’ with Technical Analysis to look at the ‘big picture’ first and then to drill down to shorter timeframes. In that vein, and because we are nearly at the end of February, I am starting with the Monthly Candlesticks but you must realise that the Candle for February is still forming up and it is not fully valid until we have the complete Candle at the Close on February 26th (that’s actually Friday because the 28th falls on Sunday). This is very interesting because my Blue Arrow is pointing to the Bearish ‘Shooting Star’ sort of Candle that formed up for January and which could have been a ‘Pivot Point’ downwards; but as it transpires, February has been a good month so far and this has taken it above the High of January and suggests we might get away with it. However, we could still have a lot of trouble if the S&P500 falls back in a big way now and we get a proper big ‘Bearish Shooting Star’ again – that would be a strong signal that there is trouble coming soon (it would probably be in March !!). 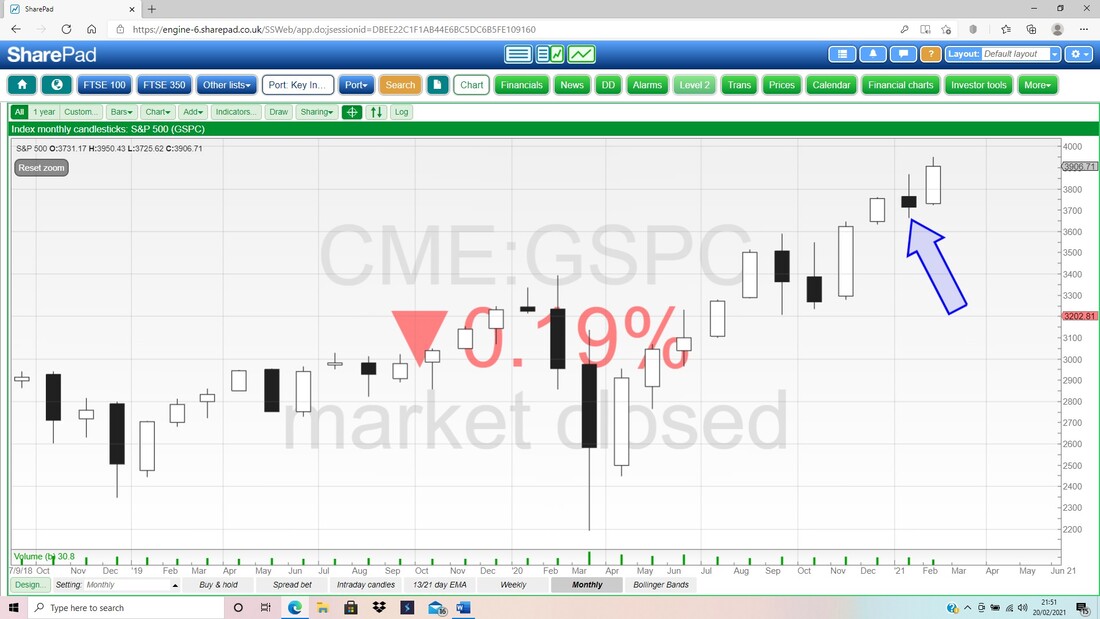
Next up the Weekly Candles for the S&P500 and my Blue Arrow is pointing to a small Doji Candle from last week and that in itself just looks like part of a Sideways Consolidation type of move. The US Markets in particular have been so bullish for so long, and they need to calm down a bit so some Sideways wiggling would be no bad thing.
It would be nice if the S&P500 can stay within the confines of the Uptrend Channel marked by my Black Lines and Black Arrows. 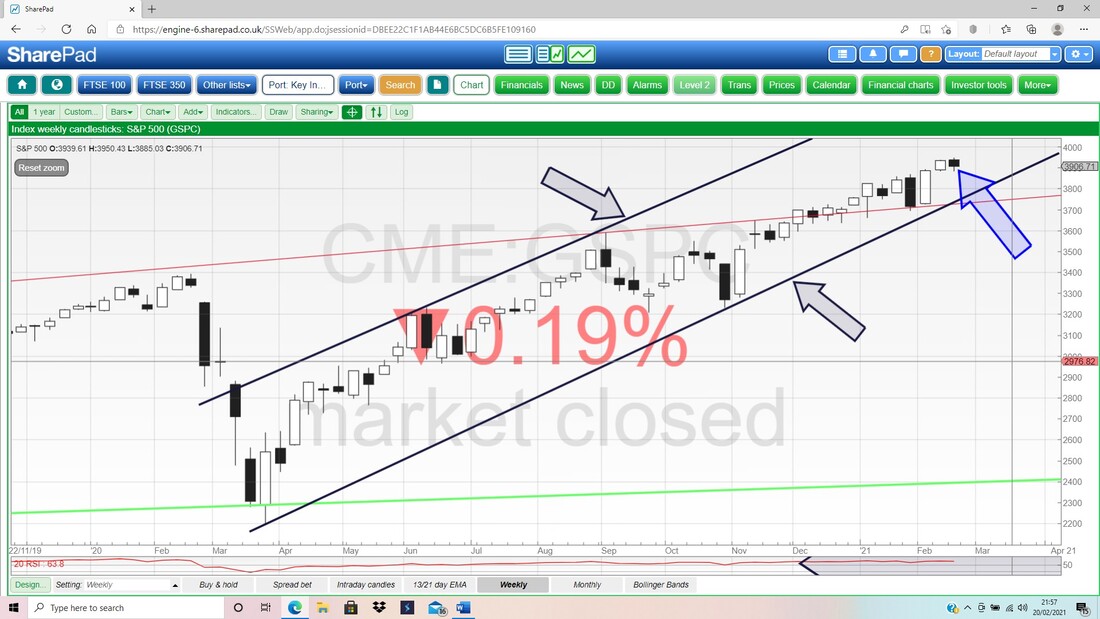
Next we have the Daily Candles for the S&P500 but I am interested here in the Black Wiggly 13 Day EMA Line (Exponential Moving Average) and the Red Wavy 21 Day EMA Line and most importantly, how they intersect.
My Green Arrow is pointing to where we had a ‘Bull Cross’ of these EMAs (the 13 Day crossed the 21 Day from underneath) and this is still ‘in force’ and until we get a ‘Bear Cross’ we shouldn’t get overly panicked. At the moment the 13 Day is quite a distance above the 21 Day and this means we can have weakness or Sideways for quite a while without triggering a potential problem. 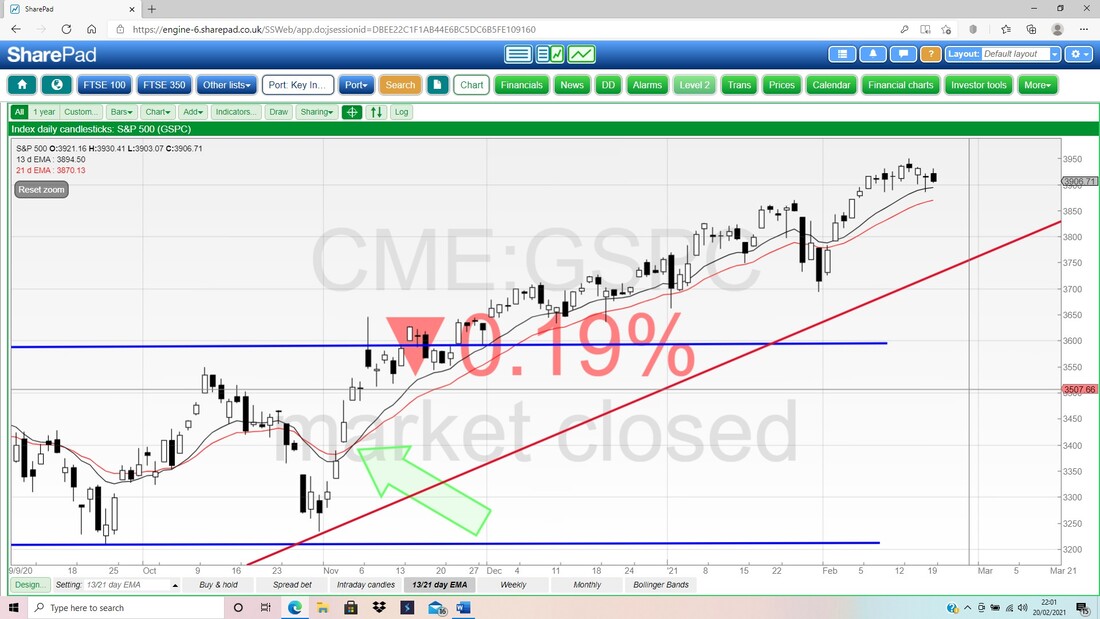
In the bottom window on the next Screen, we have the RSI for the S&P500 Daily (Relative Strength Index – view it as the ‘speed’ or force of a move), and where my Black Arrow is we are on a Reading of RSI 65 which is pretty high but not a crazy level. Recently the US Markets and the S&P500 have been able to keep the RSI up at some very elevated levels, but of course that cannot last forever.
Some sideways movement would be ideal to get this RSI level down and to calm things a bit after all the over-enthusiasm of the Bulls (I mean the ‘Robin Hood’ Gamblers !!) 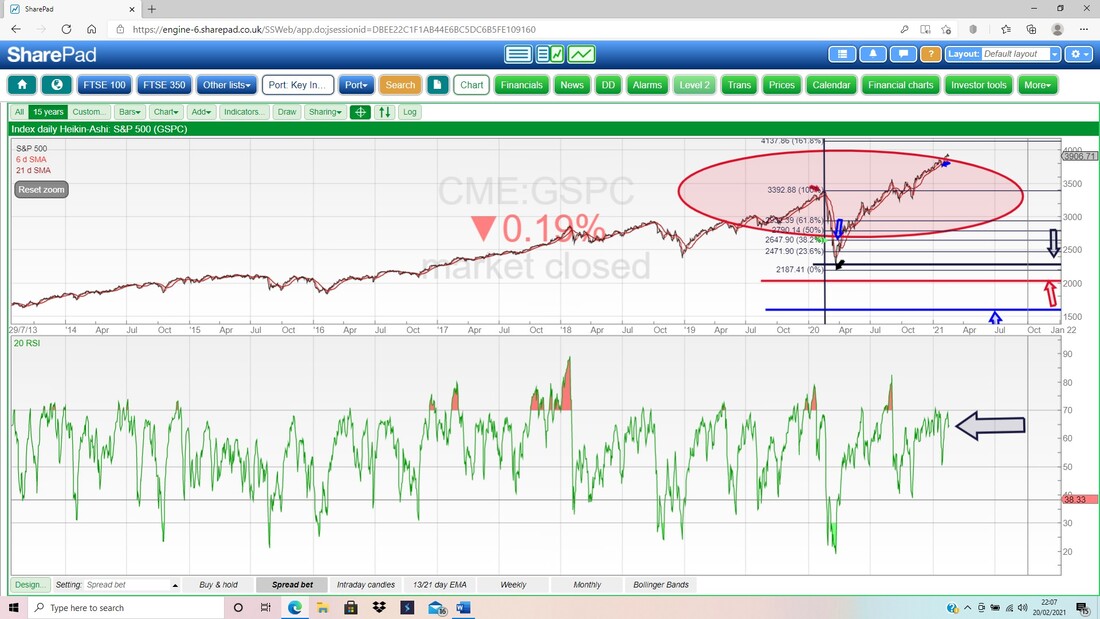
Finally for the S&P500 we have the Daily Candles and the Pink Zone marks the Upper and Lower Bollinger Bands. My Blue Arrow is pointing to a small Doji Candle from Friday and this stayed well within the confines of the moves on Thursday. In the very short term, the Low of Thursday at 3885 is Support and below that there is decent Support right down to 3700.
It is interesting how the Bollinger Bands are squeezing together and this might be heading towards something dramatic – it is early days but when these Lines go into a ‘Sausage Squeeze’ (you won’t find that in any textbooks !!) it can resolve in a really explosive move – but we can’t predict the direction in advance and it could be up or down…….. My Green Ellipse is highlighting a wide Zone of Support. 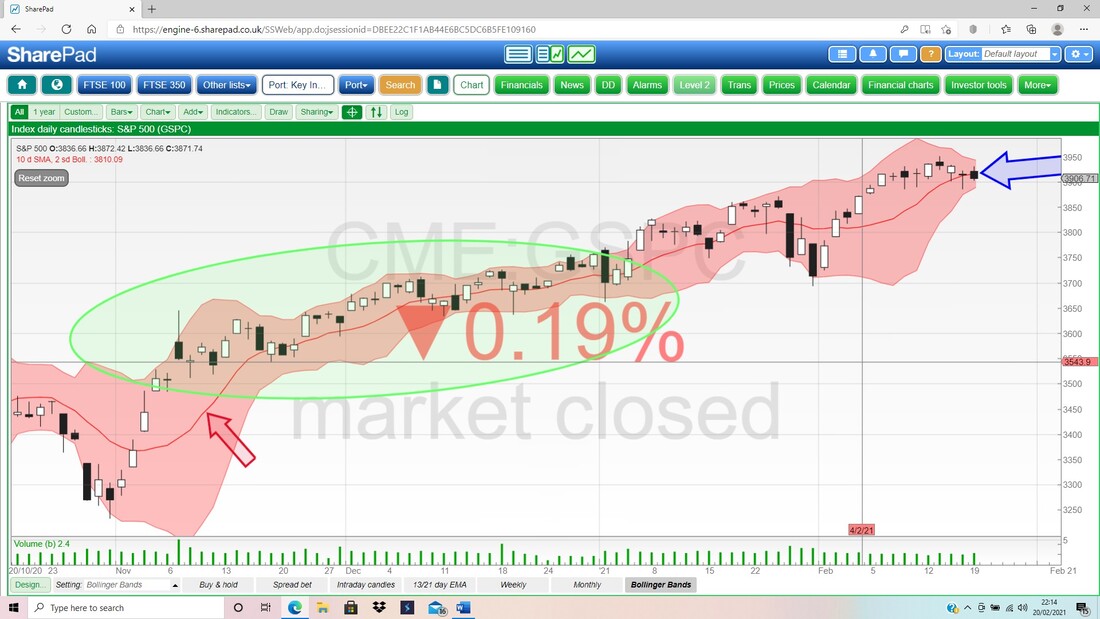
Brent Oil Composite
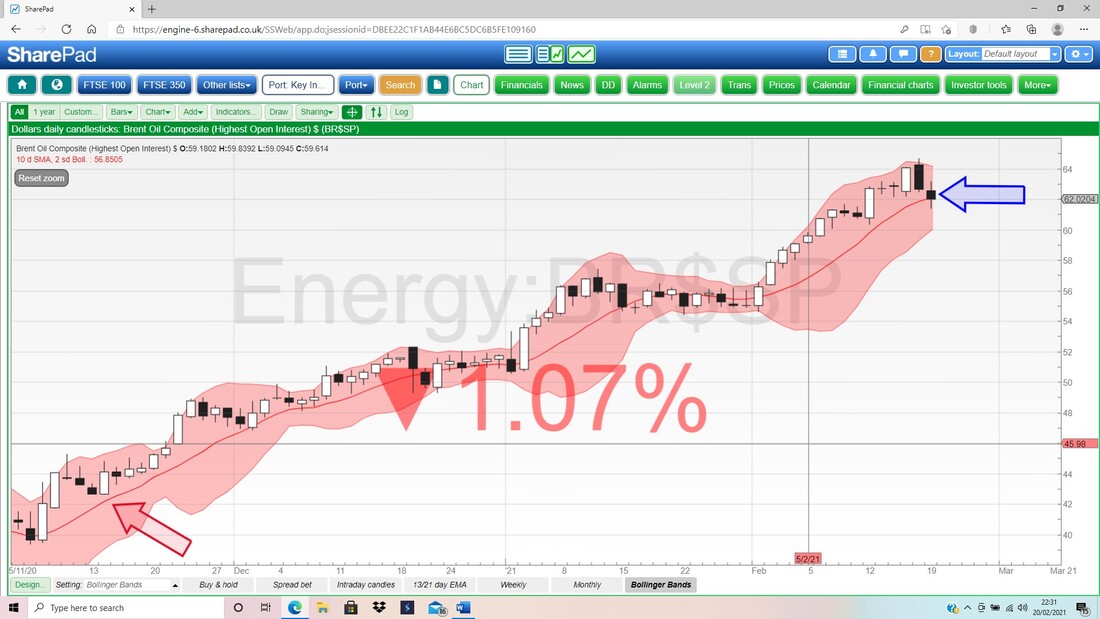
First up the Monthly Candles but remember the Candle for February (pointed at by my Blue Arrow) is not yet valid. As it stands, this looks pretty Bullish still but there is quite a bit of Resistance just up above. The High in February so far is at about $64.7 and it needs to crack that and then we have Resistance up around $75 and up to $86.7. It would need the next few days to be pretty ugly to make this into a Bearish Shooting Star which might hint (loudly) at trouble ahead. I doubt this will happen but that is what we need to be on guard for. 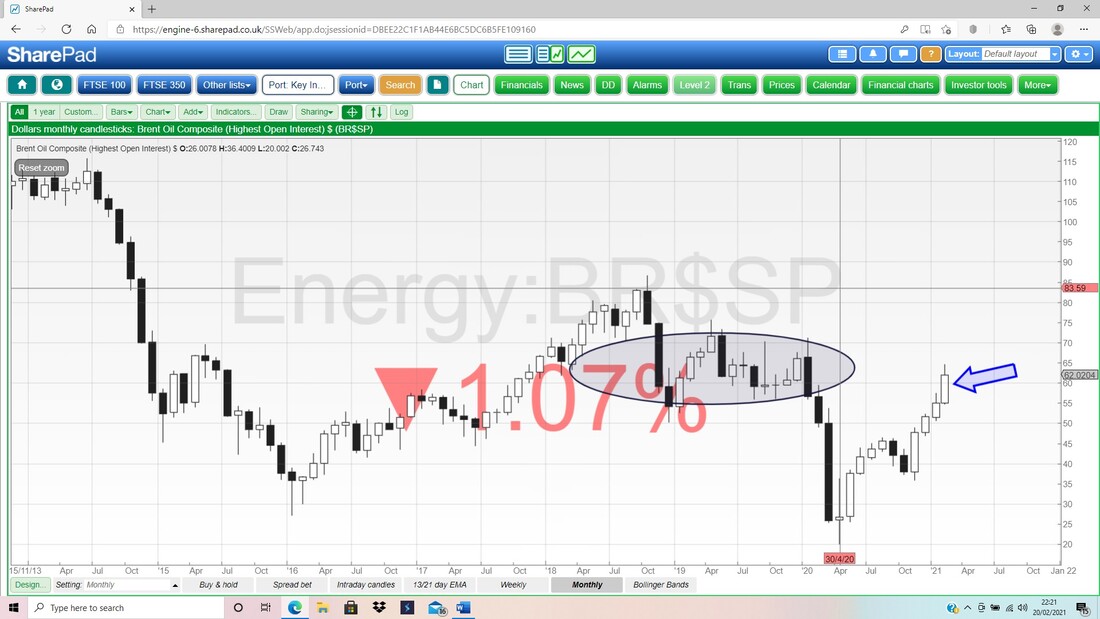
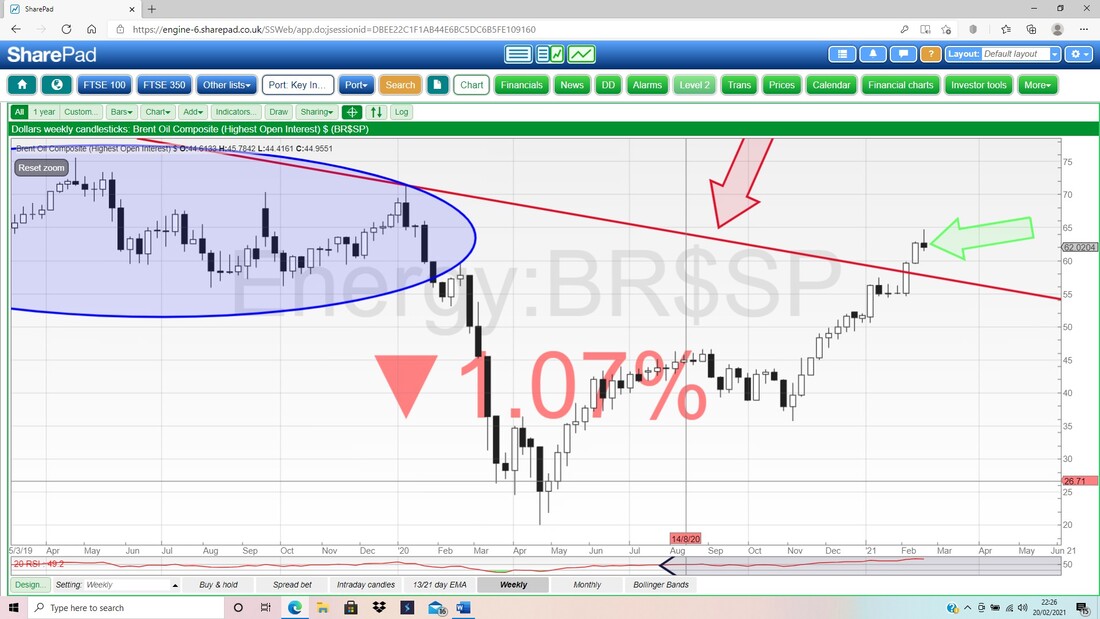
However, if you look at the Weekly Candles next for Brent Oil Comp, then my Green Arrow is pointing to a Bearish Shooting Star sort of Candle and this doesn’t look great. If we get a bad week and we get a Down Candle at the Close on Friday Night, then that would look like Brent Oil Comp is turning down.
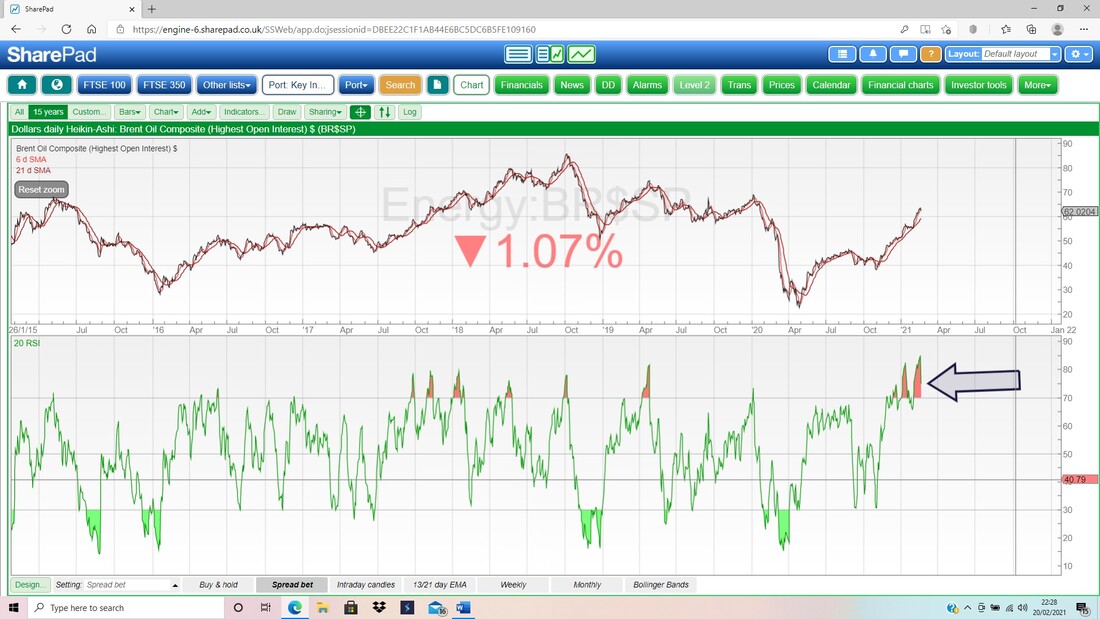
The bottom window shows the RSI for the Brent Oil Comp Daily and on a Reading of RSI 75 this is falling but is still very over-bought. This suggests more weakness in coming days which could drag on the FTSE100 and the DOW etc. We might get more of a Sideways Consolidation type of move and that would gradually unwind the excitement and calm it down.
Last for Brent Oil Comp we have the Daily Candles with the Bollinger Bands. My Blue Arrow is pointing to a ‘Long Tails Doji’ (ok, the Tails are not huge) from Friday which shows it was wiggling around. Note it was doing this dance around the Red Bollinger Band Midpoint Line (Red Arrow). Down below the Bottom Band is at $60 and this should be Support.
FTSE100
Remember the Candle for February is not yet valid but by Friday it will be. My Red Arrow is pointing to this forming-up Candle and it looks pretty promising although note we are off the High of February. However, I like the fact it did not Open down straightaway off the Bearish Shooting Star shape Candle we got for January – that is a sign that Bulls are about. It does give the impression that we are in a bit of a Sideways Range between maybe 6900 ish at the top and 6000 and down to 5600 (I will be surprised if 6000 fails but it could do if things get really rocky – that seems unlikely even with March/April having a poor history). 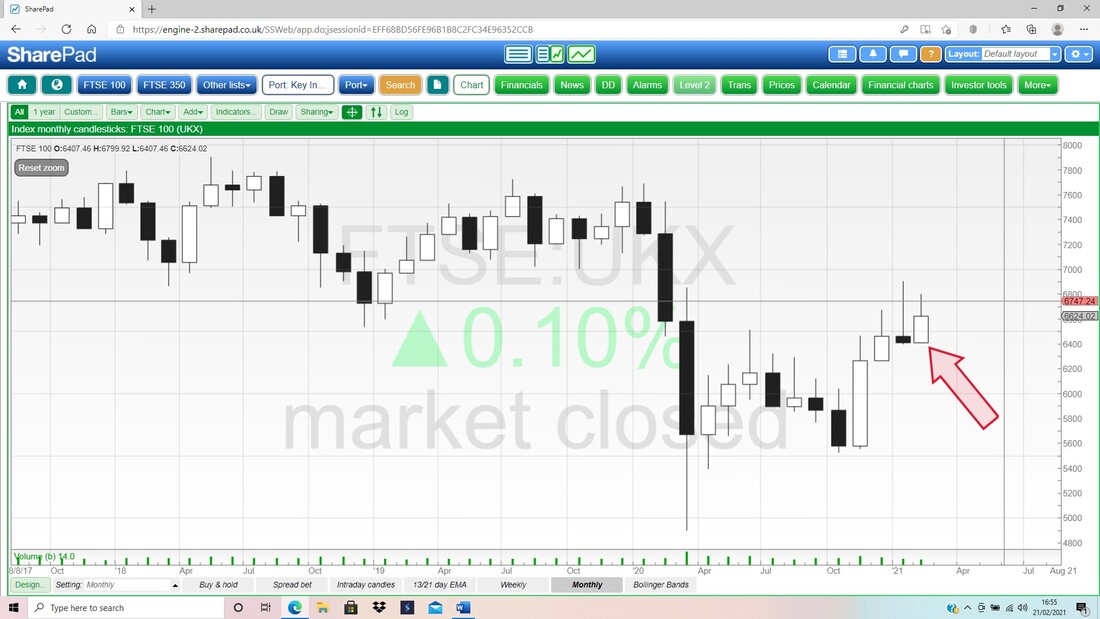
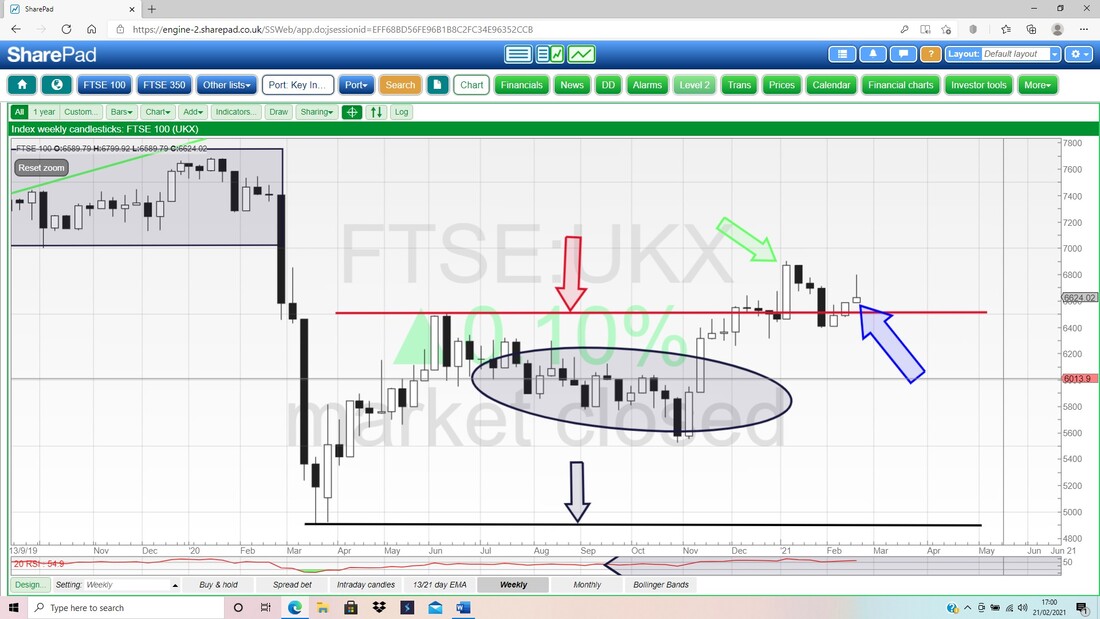
My next Chart has the Weekly Candles for the FTSE100 and my Blue Arrow is pointing to a Bearish Shooting Star sort of thing for last week; but note the context is not highly predictive, with just a small rise before last week’s Candle. However, I just get a sense of choppiness from this Chart and what I said earlier about Ranges is backed up by this. My Black Ellipse shows a good Zone of Support down below and Support looks pretty good down to 6250.
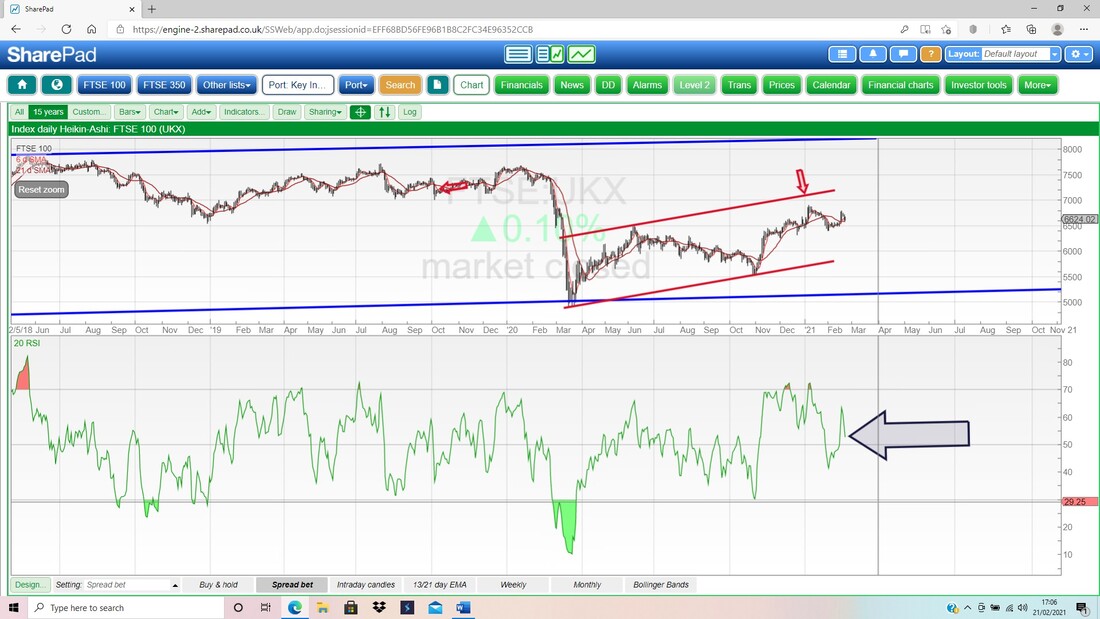
Next we have the Daily Candles but my focus here is purely on the Black 13 Day EMA and the Red 21 Day EMA. My Blue Arrow is pointing to a ‘Bull Cross’ and this is still in force. There are some signs of hope here and I will come on to them in a bit.
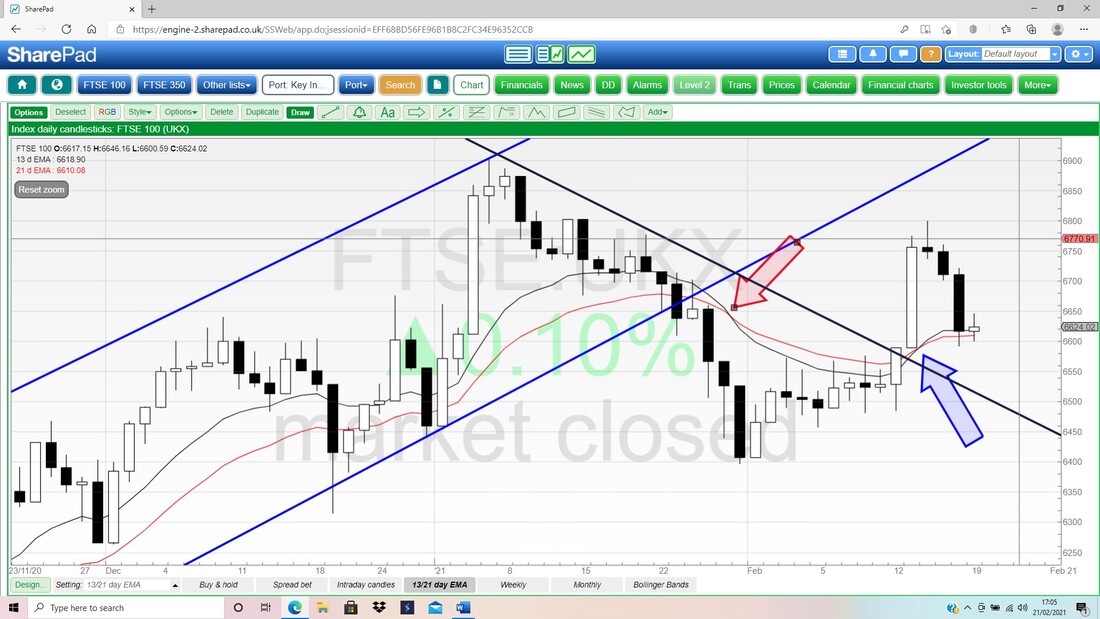
In the bottom window on my Screen below we have the RSI for the FTSE100 Daily. On a Reading of RSI 53 it is a tad above the Neutral 50 Level and this means it is nowhere near Overbought nor Oversold. In other words, whichever side takes command, Bulls or Bears, then they can run with the ball a long way if they have the spirit and the legs.
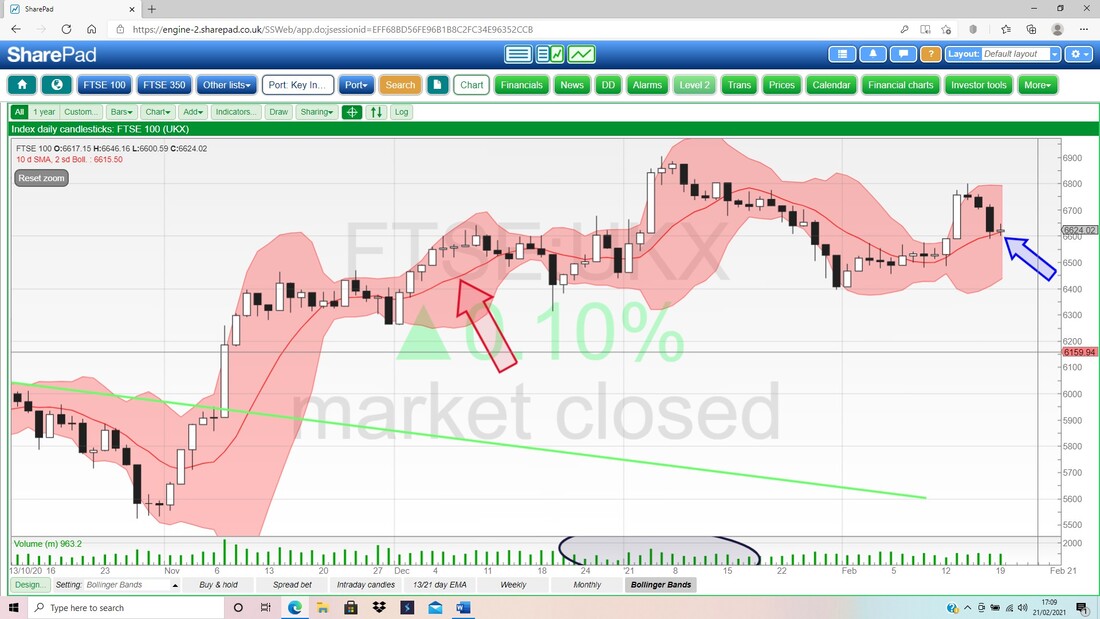
Last for the FTSE100 we have the Daily Candles and the Bollingers. My Blue Arrow is pointing to a tiny Doji Candle from Friday but note this appeared after 3 Black Down Days and it could be highlighting that a turn up is coming. I also like the fact it is parked on the Bollinger Midpoint Line which can often be Support. We should know early on Monday because if a rise off this is coming then it should start straight away.
HSBC Holdings HSBA
I noticed this Chart forming up for a while and it is pretty sweet (I hold some). I decided to use the Weekly Candles because it is a bit ‘cleaner’ but you can see the same on a Chart with Daily Candles anyway. The key thing here is what looks like a very nice ‘Bullish Reverse Head & Shoulders’ pattern – which is basically everything below my Blue Line (Blue Arrow) which happens to be the ‘Neck Line’. You can also see a bit of ‘Bullish Cup & Handle’ if you feel so inclined. In essence, if the Price can Breakout over the Blue Line at 435p then we should see some nice upside. Where my Black Ellipse is I am trying to mark Resistance at about 525p and then the Red Ellipse shows Resistance up to about 600p. The key is getting that initial Breakout of the Blue Line. Sneaky Traders would go Long on that Breakout. OK, that’s it for this week. Don’t do anything rash and keep as sane as you can as we get through all the craziness. Cheers, WD. 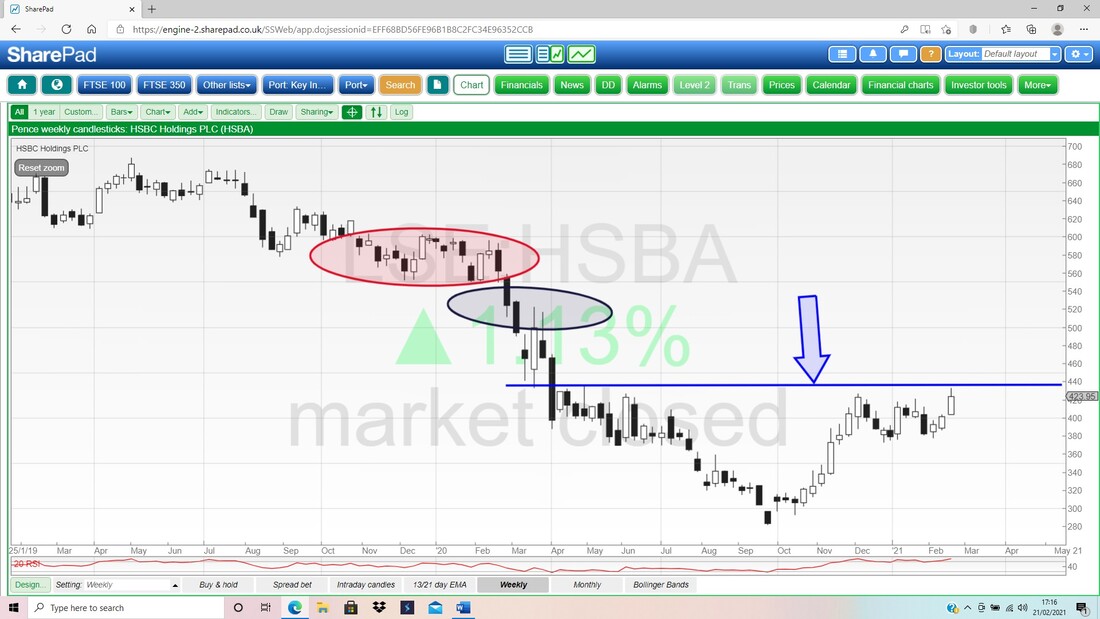
2 Comments
Kevin S
2/21/2021 11:15:35 pm
Thanks for the update Pete. I always look forward to these on a Sunday evening. They give a great overview of the market and set me up ready for the week.
WheelieDealer
2/27/2021 02:08:20 pm
Hi Kevin, Leave a Reply. |

Stocks & Markets WheelieBlogsThese tend to be more Markets and Stocks related and timely - the Blog Page on the Main WheelieDealer Website has the 'Educational' stuff (well that's the theory anyway !!). Archives
October 2021
Categories
All
|
