

|
stocks & Markets blog |
|
What a nutty Week in Politics - it just seems like any previous ‘achievements’ in Parliament are simply being smashed to pieces in the current turmoil with one of the most bonkers being Theresa May now holding the records for the First and Third largest Parliamentary defeats in history - I am convinced she is trying to get the hat-trick. Usually Prime Ministers would resign on just a minor defeat but we can just throw the previous precedents out of the ornate stained-glass windows because they mean nothing.
Probably the hugest irony though is that if you had done a Poll for who was the most likely Party Leader to not be in situ by the end of the Week, then absolutely nobody would have plumped for Vince the Cable - that is simply mystifying. Having said that, he has been notable by his absence ever since he was made Leader of the Libdems. One of the other nutty events was the latest Brexit Minister, Steven Barclay, doing the summing up speech on a Government motion and using the traditional words “I commend this motion to the House” only then to vote against that very motion himself !!
And of course I mustn’t forget the bizarre occurance of the Prime Minister voting against a motion her Government had tabled…….
I am sure we are in for more such ludicrous events in the coming Week and the most crazy might actually be that Theresa May manages to get her ‘Deal’ through - that would be pretty remarkable but it is quite possible I would say. That vote is on Tuesday I think and if she gets defeated then there are plenty of opportunities for an ugly mess and I would not be surprised if we still ’crash-out’ on No Deal on the 29th March as a combination of immense stupidity and lack of ability to compromise from all Parties involved. From the News out today it looks like many hardline Brexit Tory MPs are going to vote for T May’s Deal as they are under pressure from their Local Constituency Parties and the key is the DUP, because if they come on board then it really is possible that the Deal will get through. Further down this Blog you will find a link to the latest TPI Podcast that I recorded with @Conkers3 and we cover a lot of the Brexit shenanigans on there and the likely impacts on the Markets. Last Week I’m pretty happy with how things turned out last Week with my Portfolio gaining 0.85% and this brings it back to a shade under Break-even for 2019 - and with the drag from my Index Hedges and a hit of over 4% on CAKE then things are looking OK. Fortunately my Income Portfolio is chugging along nicely and this has been bringing in some nice ££££s for me so at least I can eat and drink and put Petrol in the Cupra (amazingly it doesn’t use all that much unless you spank it on short journeys). Current stance on my Hedges The Shorts are holding my Returns back but overall it looks like I have the balance probably not too far away from what would be ideal (and in truth it is pretty much impossible to get an ideal Hedge) and apart from the occasional Day where my Stocks lag behind the FTSE100, mostly my Stocks do seem to have the edge and this means I am weighted to rising Markets and the Hedges are just reducing the Returns I would be making otherwise. But of course the point is that my Hedges mean that my overall Exposure to the Market has been lowered a lot which is precisely what I want to achieve because it is an alternative to actually selling the Shares, as I have explained in recent Blogs. And with the current Political turmoil and the ‘Tail Risk’ of a crash-out ‘No Deal’ a real possibility, I want to have my Portfolio Hedged and ready if there is a serious ‘Risk-off’ situation and Stocks take a dive. On the flipside, if some sort of solution is cobbled together at the last moment, then I expect the Pound to rise and this could hit the FTSE100 as well - we shall see. I also have a small Short on the S&P500 and it seems to me that the US Markets are just hugely overvalued and the Rebound since the start of 2019 has been ‘V’ shaped and way too fast and steep - that doesn’t look sustainable to me and as we approach the Resistance of All Time Highs again, I suspect we could easily see a Pullback. On Friday I recorded a Twin Pete’s investing Podcast with @Conkers3 and something we discussed in it (I think we did anyway !!) was a paradox I am seeing in the Gold Price and the strength in Stock Markets. This paradox arises because the Gold Price has been moving up lately and that coincides with Stocks going up and this is rather strange because Gold can be seen as a ‘Risk-off’ Asset whereas Stocks are a ‘Risk-on’ Asset - that is the usual relationship so you would expect them to be quite inverse really with Gold rising and Stocks falling and vice-versa. So this leaves me to the thought that one of these is probably wrong and if I was to pick which it is, I would say that Stocks are getting it wrong and there are problems on the near horizon. There’s a bit more evidence for this. In the latest Investors Chronicle (dated 15th March 2019 with ‘Short Circuit’ on the cover), on Page 16 under an Article entitled ‘Low yield warning’ (the clues in the name !!), Chris Dillow writes a very good piece which in essence says that Government Bonds are warning us of trouble ahead and of course this lines up with what Gold is telling us. It is worth appreciating also that the Bond Market utterly dwarfs the Stock Markets (I think it is something like 20 times larger) and therefore perhaps it has more predictive power. One chunk of text stands out: “Which alerts us to the real reason for ultra-low yields. It’s that the economy is so weak. Investors expect growth to be low and so have switched into safe assets and out of growth-sensitive ones such as equiites.” Oh, and the strapline on the Article says: “Gilt yields are near record lows because the market fears weak economic growth. This should worry equity investors.” So the upshot of all of this is that even if we cast aside the Downside Risk to Stocks from Brexit, then the wobbles in the Global Economy and the kinds of signals that both Gold and Bond Yields are flashing at us are sufficient to make me think that we could very easily see a drop in the Markets again. Another factor is that April tends to be a very strong Month but just after that May is a very bad Month as we head towards Summer (‘Sell in May and go away….’) and Summer is the worst 6 Month period for Stocks over time when compared to the Winter. With this in mind, I am going to keep my Shorts running and despite the Risks in doing this and the annoying Costs I incur from Interest Charges and having to pay Dividends, I anticipate there will be many chances ahead to get out of these Short Positions with either much reduced Losses on them or even at a Profit if things get really ugly. I will keep monitoring things as usual and it is possible that if I can see a Pullback starting then I will Short a little bit more and in effect ‘Average Up’ if you see what I mean (it is like ‘Averaging Down’ on a Long Position but obviously the opposite because I am Short). That is risky to do though. A couple of Years ago I got caught out on an Index Hedge and took a sizeable real Loss which hurt a lot. However, looking back at what happened there (of course with the marvellous benefit of Hindsight !!) if I had held onto the Position and rode it out, then I could have Closed it with a significantly smaller Loss (or maybe even a Profit) when we had the Sell-off at the end of last Year. This is a risky strategy of course but an advantage I have this time is that my Shorts are smaller relative to the size of my Long Positions and in addition we have the Macroeconomic Issues I have referred to above and of course the Brexit fiasco which brings a lot of potential Downside Risk to the Markets. With Summer just on the horizon and the Autumn nearly always being a difficult time for the Markets, I am happy to let my Hedges run and see if I can unwind them as soon as an opportunity arises. It is a pain that Interest Charges and Dividend Costs mean the longer I hold the Shorts, the more pain then inflict on my Portfolio but fingers crossed the longest I will need to keep them running is a few more Months. It is not overly comfortable because when a Short Position via a Leveraged Trade like a Spreadbet or a CFD (Contract For Difference) goes against you, then it absorbs Cash although a big benefit I have is that my Long Spreadbet Positions offset a lot of this Cash sucking. Another possible option is to reduce the size of my Shorts and in effect take a bit of a Real Loss (as opposed to a Paper Loss) but this would make them more manageable in terms of any Cash drain. Ahyway, that is my current thinking and let’s see how it all plays out in coming Weeks and of course it is worth bearing in mind that even if the Brexit Withdrawal Deal gets through, we then move onto more battles around the ‘Future Partnership‘ although I suspect those will be easier despite all the noises you near coming from MPs etc. New TPI Podcast As I mentioned above I recorded another Podcast with @Conkers3 on Friday and this has just been released. We cover a lot of stuff in it and I recommend you have a listen. If you like it, have a listen to some of the previous ones because even though a bit of the subject matter is of a timely nature, most of it is more of an Educational bent and is pretty timeless. You can hear the latest Podcast here and I must mention that we have resolved some of the sound issues that have been present on previous ones because I got Openreach to come out and look at my Broadband Connection - having said that it does mysteriously get cut off at the end but it is 59 minutes long by that point !! https://soundcloud.com/user-479955511 Oh, and make sure your ‘Balance’ setting is centred on your listening device because a weird feature of how we record the Podcasts means that our voices come out of different Speakers - so it is possible to just get one of us talking without the other (bad luck if you get me !!). Master Investor Show I have finally made a decision and I intend to be at the Master Investor Show in Islington at the Business Design Centre on Saturday 6th April and I will get there around 12 noon and normally I tend to hang out in the Restaurant/Canteen area bit for most of the afternoon. As a Wheelchair User I am easy to spot so come and say “Hi” if you are there. The UK Investor Show which is at the Queen Elizabeth Conference Centre in Westminster (just over the road from the Parliament Madhouse) is the Weekend before on Saturday 30th March but with them so close together I don’t want to attend both of them and the Islington one is an easier drive for me really. The Tickets are £20 normally for Master Investor but if you do a Google Search and put in ‘Master Investor Discount Codes’ then you should be able to get FREE tickets (shout if you have no success with this). You can find out more about the Master Investor Show here: https://events.masterinvestor.co.uk/master-investor-show/about-the-show/ And the UK Investor Show is here: https://www.ukinvestorshow.com/ Blog Slate I surprised myself and managed to get out the first Part of those ‘Mechanics of a Trade’ Blogs a few Days ago and my intention is to get the next Part out later in the coming Week. I also made a start on Friday Night on a Blog or maybe two about what I look for every morning when I am reading through Results Statements and Trading Updates - so I am sure Readers will particularly like that one. That lot should keep me occupied for a few Weeks and perhaps there will be a miracle and the Sun will appear and I can get totally distracted on things like digging my Garden !!! Journey through time The Archive of Blogs that I have now scribbled over the last 4 or more Years is getting pretty immense now and if you are new to all this WheelieDealer nonsense then I recommend you have a dig through them. Go to the ‘Blog Index List’ which sits on the WD2 Website and that has all the Blogs listed and the Educational ones all have Links so you can find what you want quite easily these Days. In the meantime, here is one I wrote a while back that might get you salivating for more (or perhaps not !!): http://wheeliedealer.weebly.com/educational-blogs/wheelies-triage-process Right, let’s look at those Charts with a particular focus on the Resistance that is lying just up above where we are now on the US ones. S&P500 All the Charts I show are from the stupendous SharePad Software Webby thing I subscribe to and if you click on the images then they should grow bigger for you to see more details. I have a Short on the S&P500 so I am particularly interested in it and the key thing to notice on the Chart below, which has the Daily Candlesticks going back about a Year and a few Months, is the Ellipse Shape jobby which is trying to highlight a Zone of Resistance that we have up above as the Index approaches its All Time High (ATH) again. My Black Arrow is pointing to a Black Horizontal Resistance Line and it looks like the S&P500 is trying to break above this now, which sets up a challenge on that Resistance I showed in the Ellipse. This may be tough to get through. Up above that we have a Green Line (marked by my Green Arrow) which could be more Resistance. My Blue Arrow is pointing to the 50 Day Moving Average Line and my Red Arrow is pointing to the Lighter Blue 200 Day Moving Average Line. Note how the 50 is moving up towards the 200 from underneath and it looks like we will get a Bullish ‘Golden Cross’ quite soon - however, although this is a positive development, it is quite a ‘slow’ Indicator and not hugely useful. 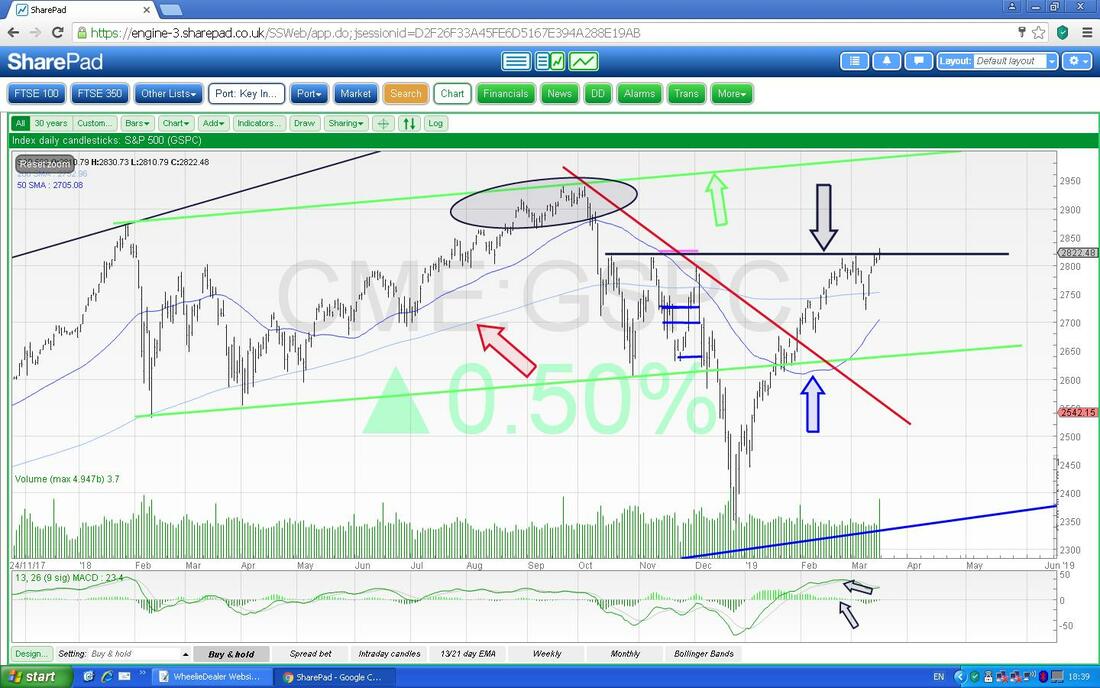
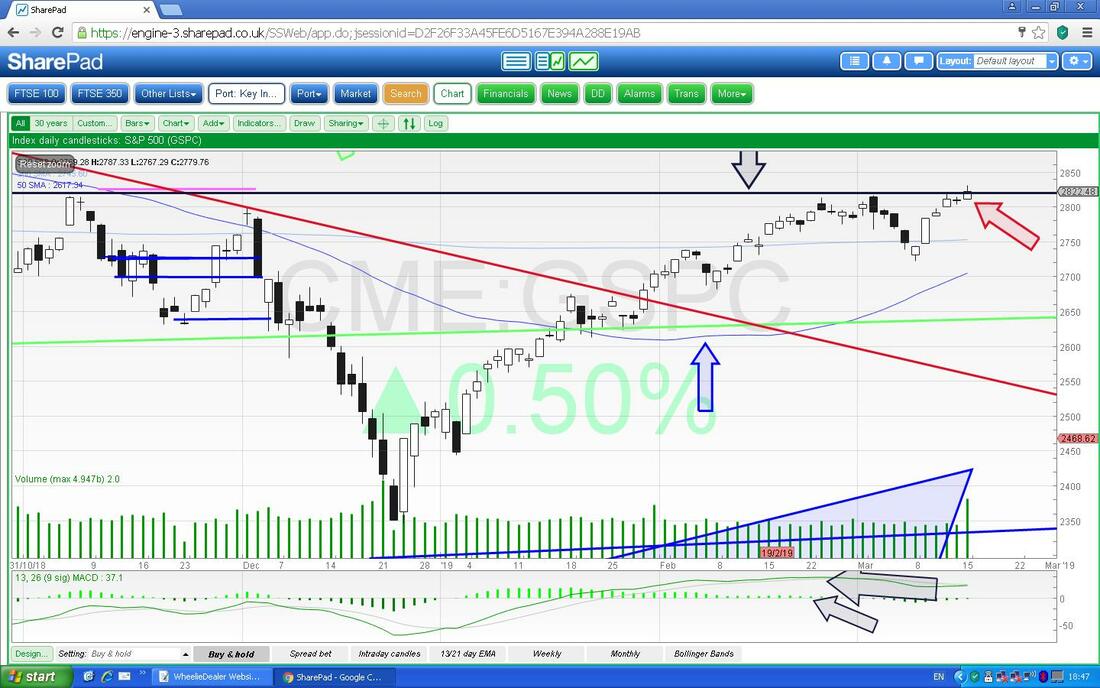
On this next Screen I have just zoomed in on the earlier Chart and introduced the Red Arrow which is pointing to the ‘Doji’ Candle we had on Friday - note it has a ‘Wick’ going upwards and this shows the S&P500 couldn’t hold the Intraday High. There is not a dramatic Reversal here like there would be if we had a clear Hammer or something, but it does suggest the ‘Breakout’ of the Black Line did not have much oooomph behind it.
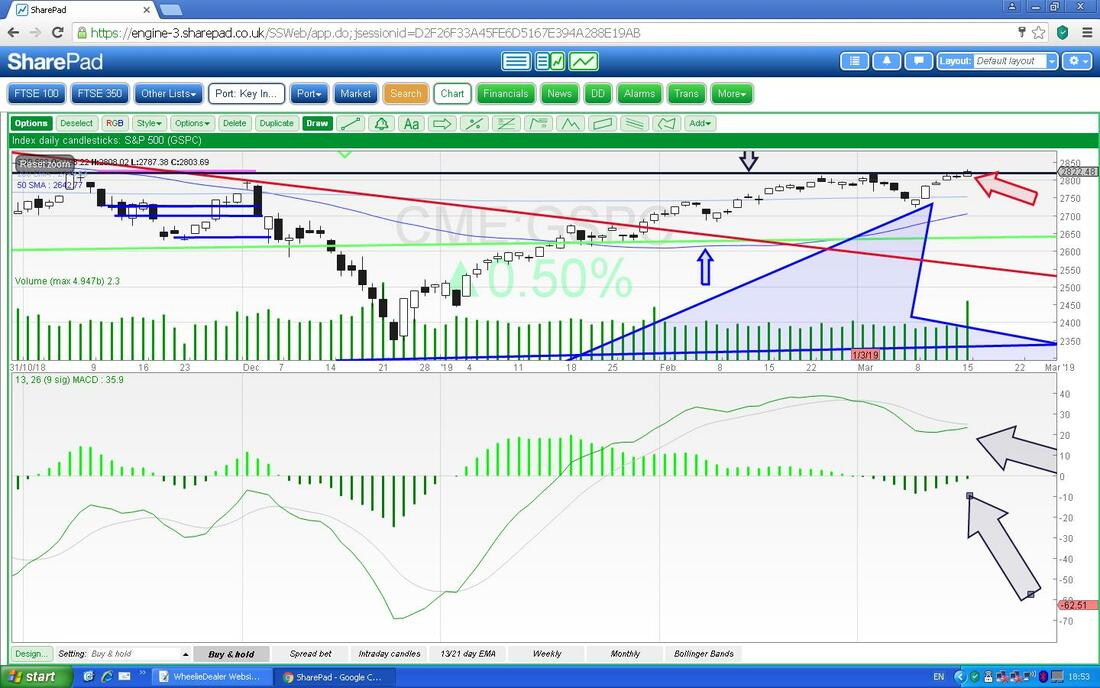
In the Bottom Window on the Screen below we have the MACD (Moving Average Convergence Divergence) for the Daily on the S&P500 and my Arrows are pointing to where we are very near a Bullish Crossover in both the Histogram Bar format and the Signal Lines format. Again this is not the best Indicator but it does suggest more upside in coming Days.
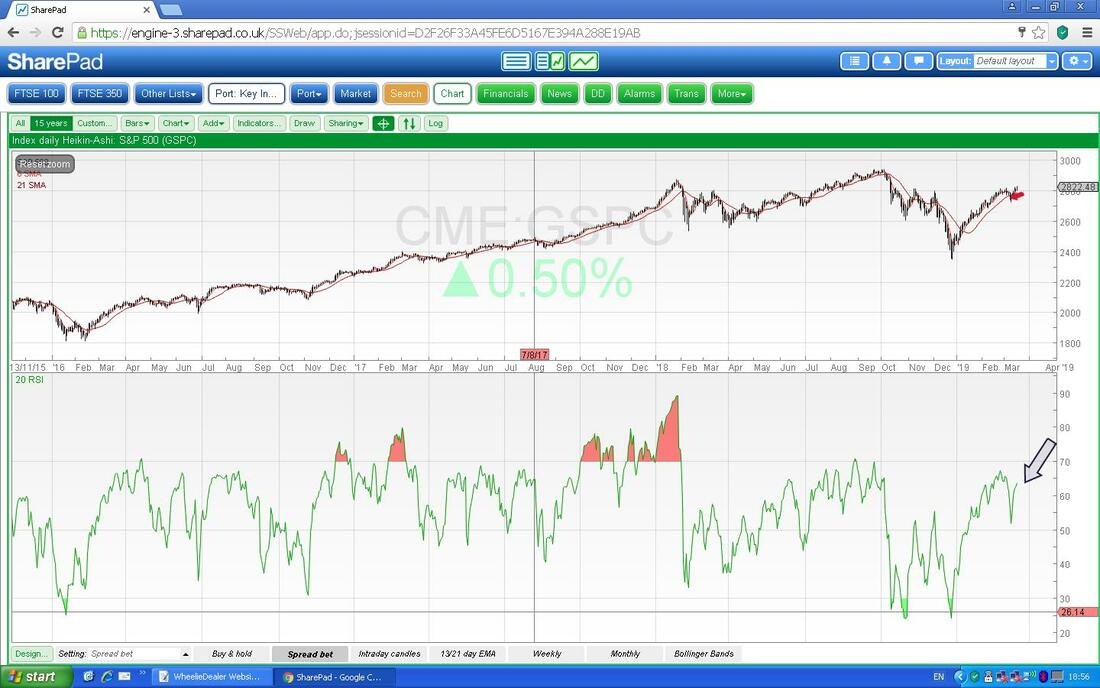
In the Bottom Window on the Screen below we have the RSI (Relative Strength Index) for the Daily S&P500 and where my Arrow is there is a Reading of about RSI 63 which is high but not crazy and suggests there could be a bit more upside.
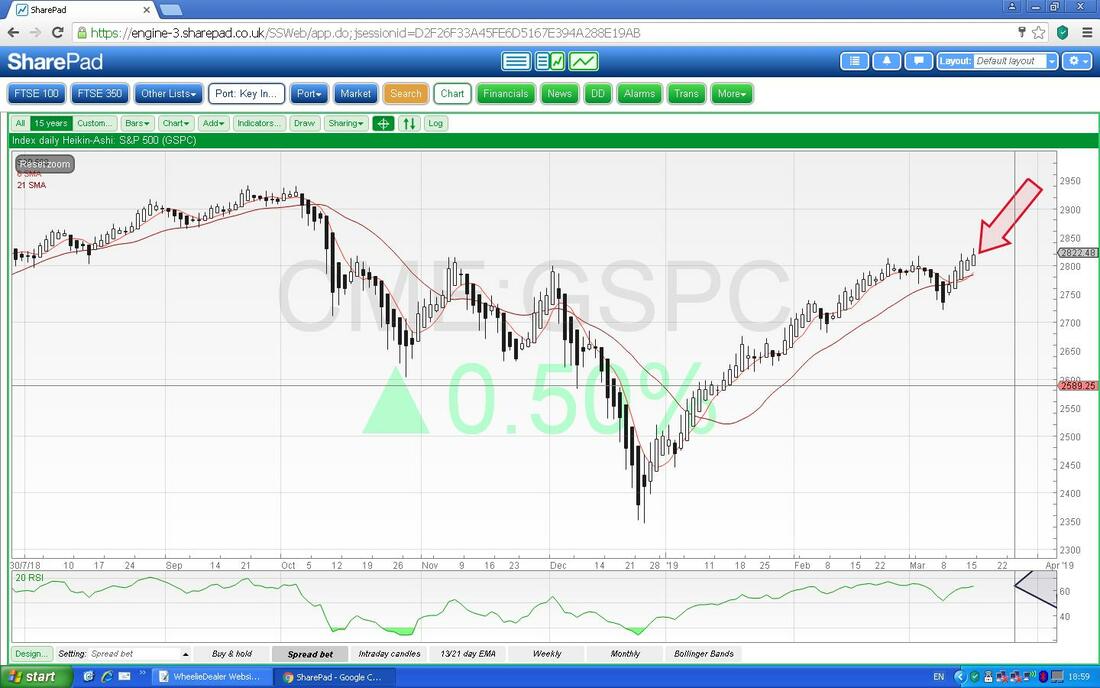
Next up is the Daily Heiken Ashi Candlesticks. My Red Arrow is pointing at a Big White Up Candle and with the way these work (they are totally different to normal Candles), that is Bullish. However, it is worth appreciating that they are a ‘slow’ Indicator as they form up over 2 Days.
This next Chart shows how painful my Shorts have been because the Blue Line shows where I placed the Short on. Anyway, what I want to show here is the interaction of the Black Wiggly Line which is the 13 Day EMA (Exponential Moving Average - more weighting to recent Days) and the Red Line which is the 21 Day EMA. Where my Red Arrow is we had a Bullish Cross where the 13 Day EMA crossed over the 21 Day EMA and this is still in force as we have not had a Bearish Cross. One of these can be seen where my Black Arrow is.
These are superb Signals I find and you can probably see that I put my Short Position on not long before the Bullish Cross - so this was telling me not to be Short. However, that is fine if I was just going by the Technicals but my Shorts were placed on to Hedge out Brexit Risk so I ran them anyway. Maybe that was an error on my part but it is easy to say that with Hindsight/Outcome Bias. 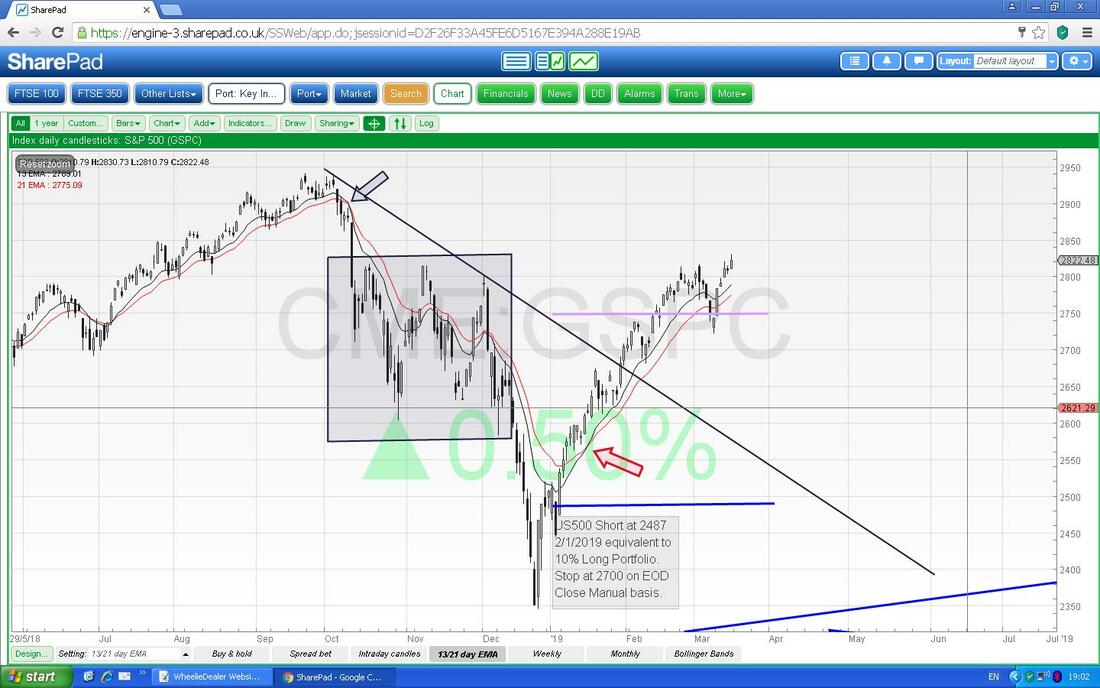
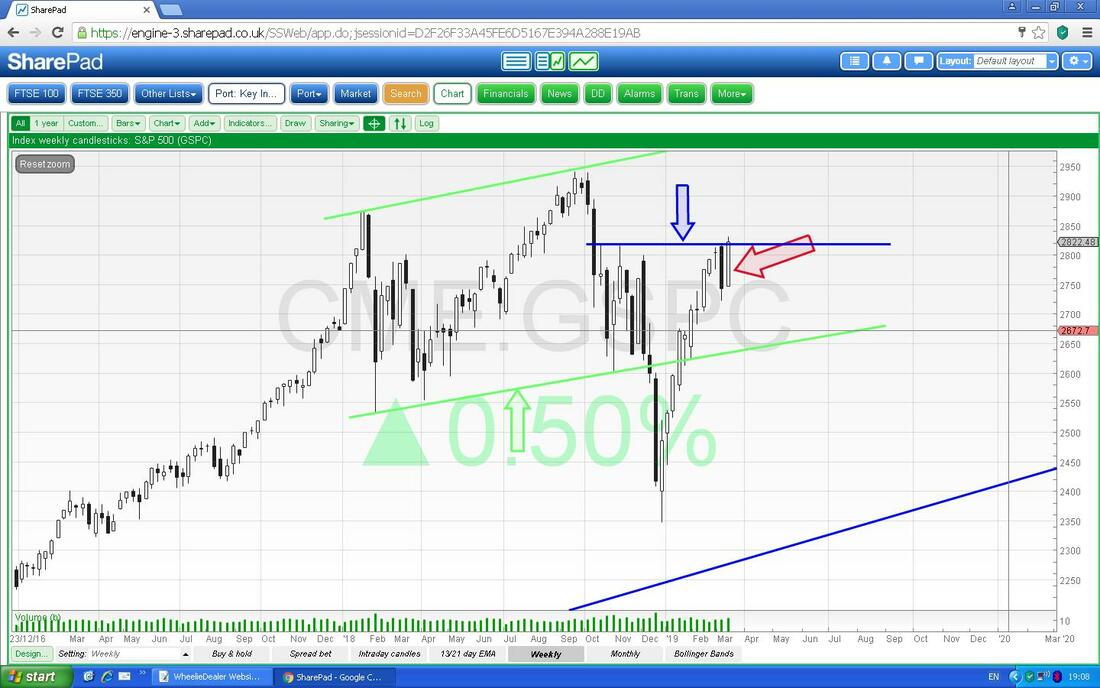
Next we have the Weekly Candles which are generally a pretty useful tool. This is interesting because my Red Arrow is pointing to a Big Bullish White Up Candle and the key thing is that it has negated a Bearish Down Candle from the Week before which was preceded by a Star Doji sort of thing which looked like a Pivot Point. The Bullish Candle last Week is a sign of strength.
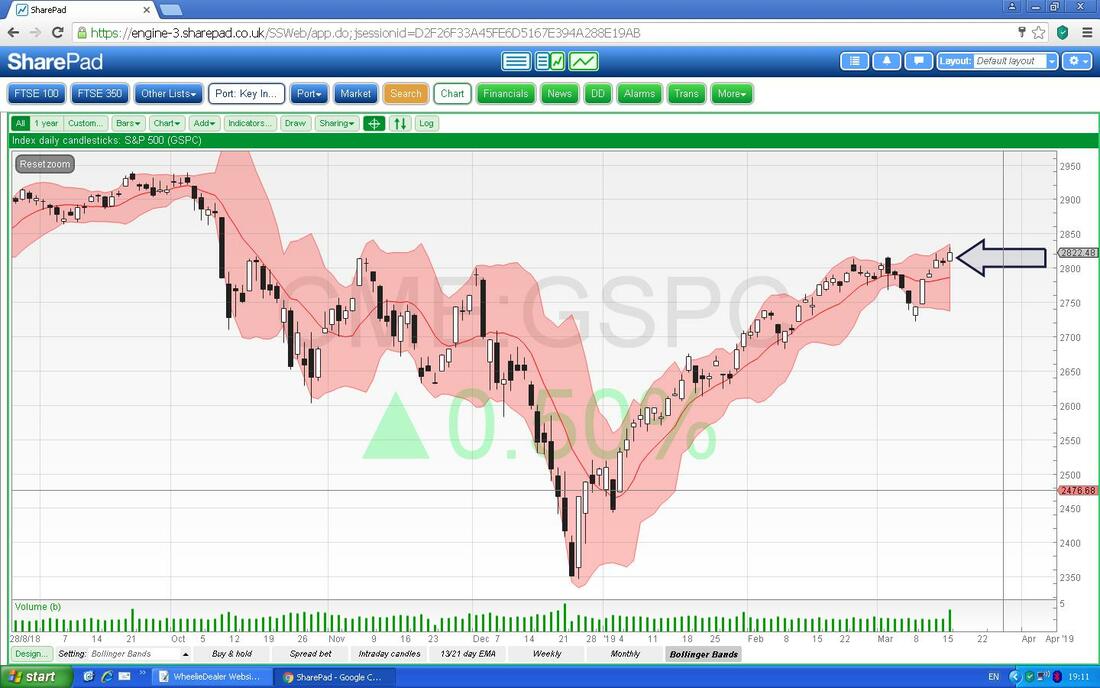
On the next Screen we have the Daily Candles for the S&P500 and the Pink Zone is marking the Bollinger Bands. My Black Arrow is showing that we are up near the Top Band now and it might struggle to go higher here in the short term.
The Nasdaq Comp is pretty much the same as the S&P500 which shows how closely they track, so I won’t include it here for time reasons. However, on a Fundamentals viewpoint, I see the Nasdaq as bonkers overvalued and with the charge up in 2019 so far, we are just as over-valued as we were last Year when everyone was worried about it.
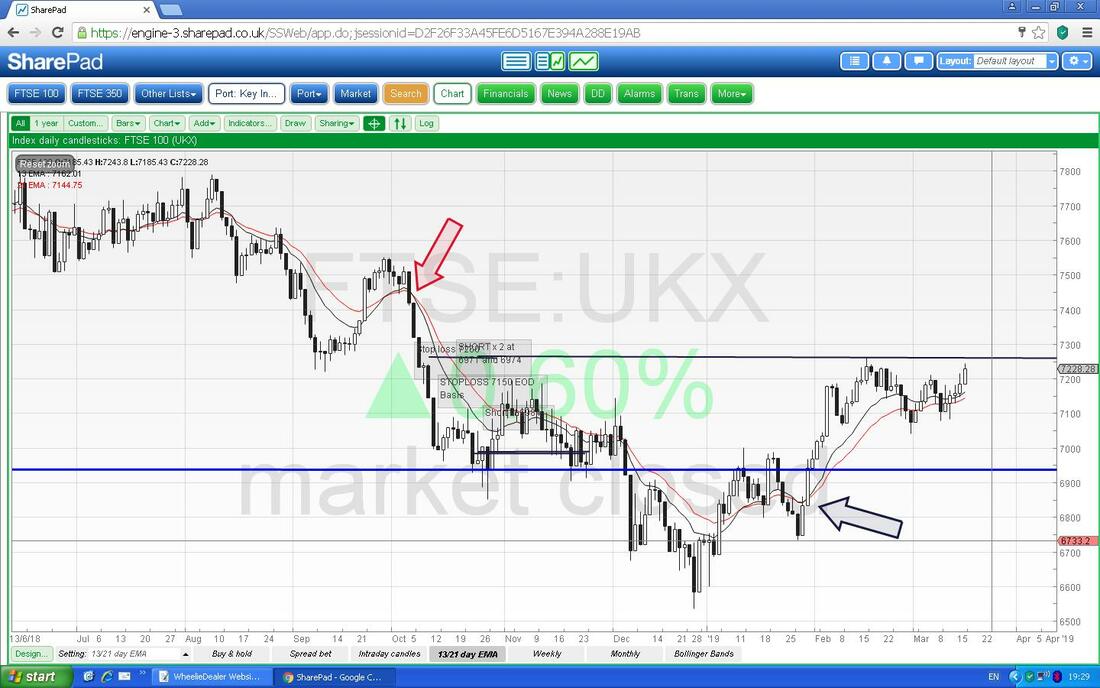
FTSE100 Obviously Brexit is the main event here but it is useful to see what the Technicals are telling us because they represent the way that the ‘Wisdom of Crowds’ is anticipating the Political farce to play out. The Chart below has the Daily Candles and the Blue Horizontal Lines are where my Shorts were opened so again you can see why they are painful !! My Green Arrow is showing the White Up Candle from Friday and like with the US ones, it was unable to hold the High of the Day but it does look like it wants to Breakout and go higher. My Blue Arrow is pointing to previous Resistance at about 7262 and this is the Breakout Level. If it does manage to Breakout, then my Ellipse to the Left is showing a huge Zone of Resistance and this will be very tough to get through. Note also the Lighter Blue Wavy Line which is the 200 Day MA which is acting as Resistance now. 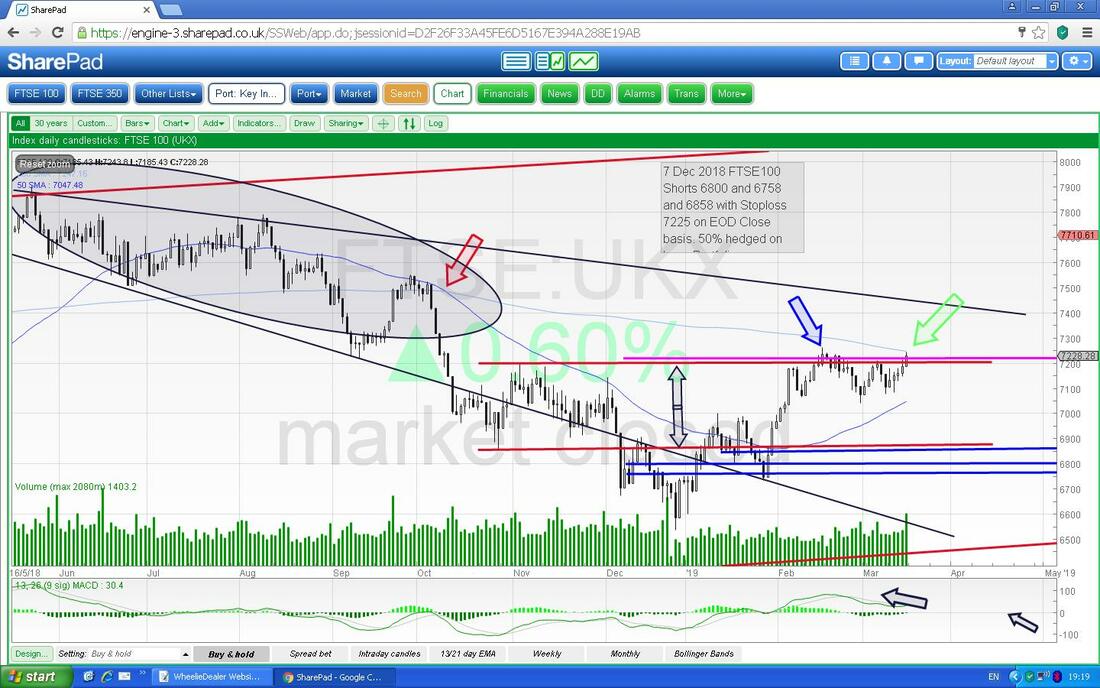
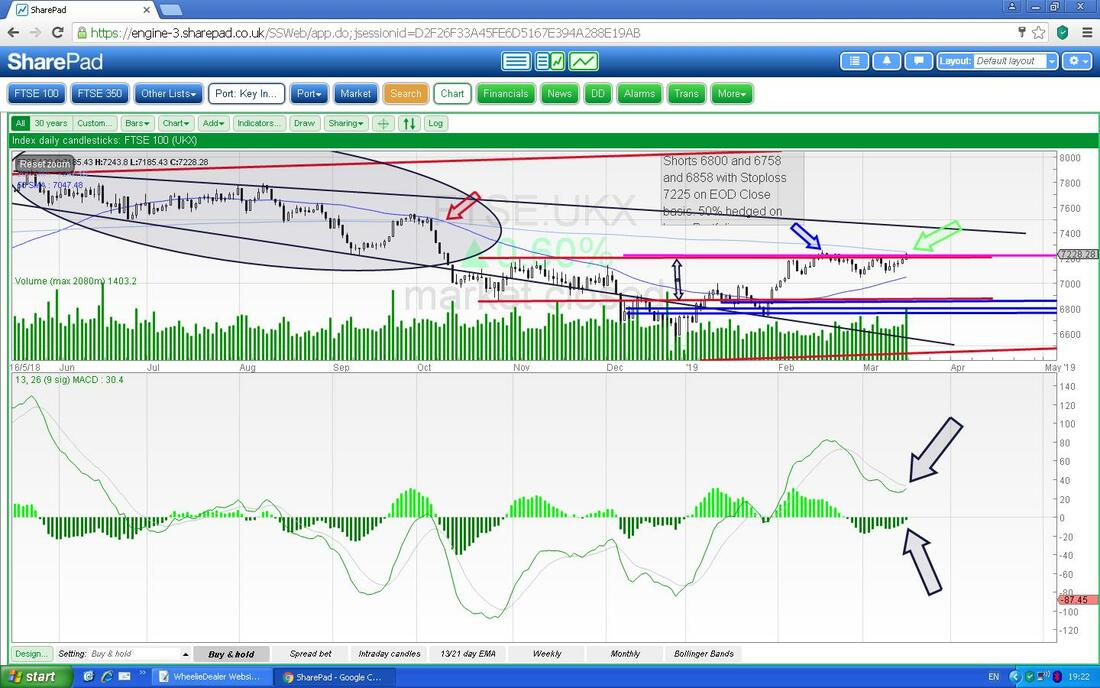
In the bottom window on the Screenshot below we have the MACD for the Daily FTSE100. My Black Arrows are pointing to the 2 different formats which indicate that we are near a Bullish MACD Cross.
The Chart below has the Daily Heiken Ashi Candles. My Black Arrow is pointing to a Big White Up Candle and this suggests more upside.
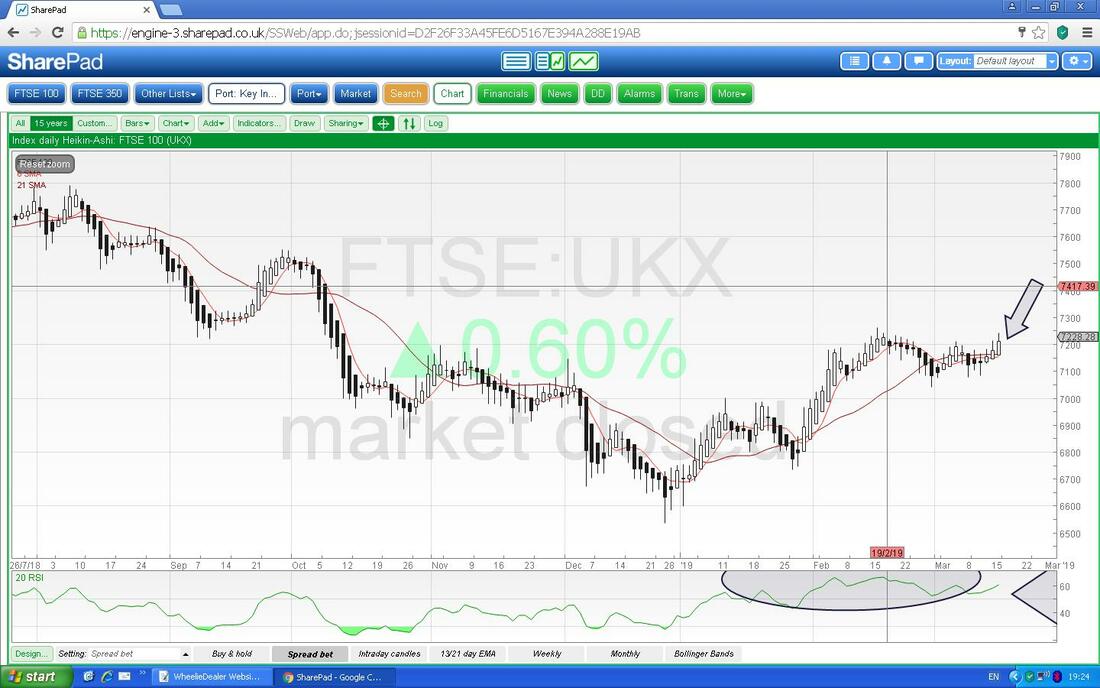
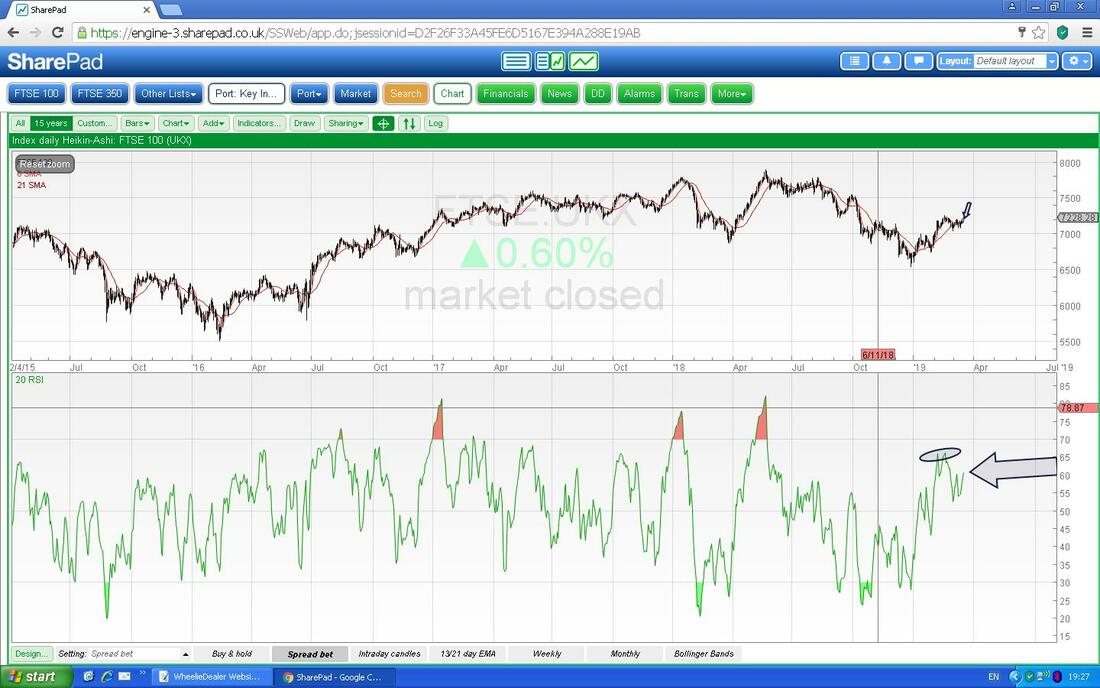
In the bottom window below we have the RSI for the FTSE100 Daily and on a Reading of RSI 60 where my Black Arrow is, this is not a particularly high Level and suggests more upside is possible in the short term.
My next Chart has the Daily Candles and the 13/21 Day EMA Lines. My Black Arrow shows where there was a Bullish Crossover and this is still ‘in force’.
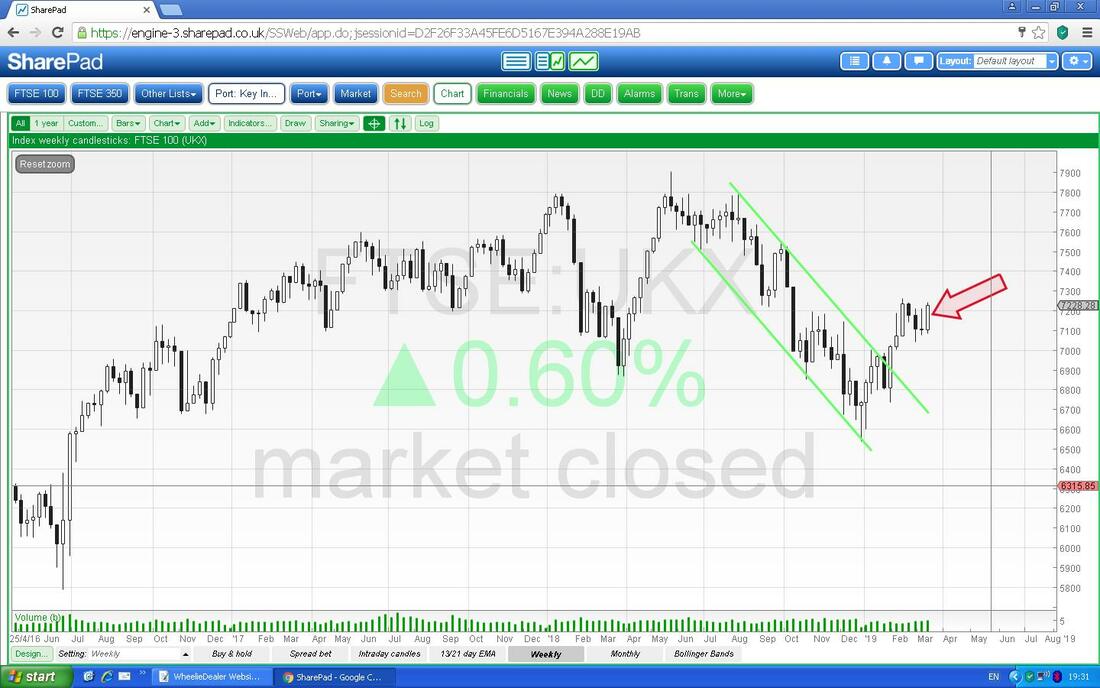
Next we have the Weekly Candles for the FTSE100. My Red Arrow shows a nice White Up Candle and after the Pullback of recent Weeks this looks Bullish.
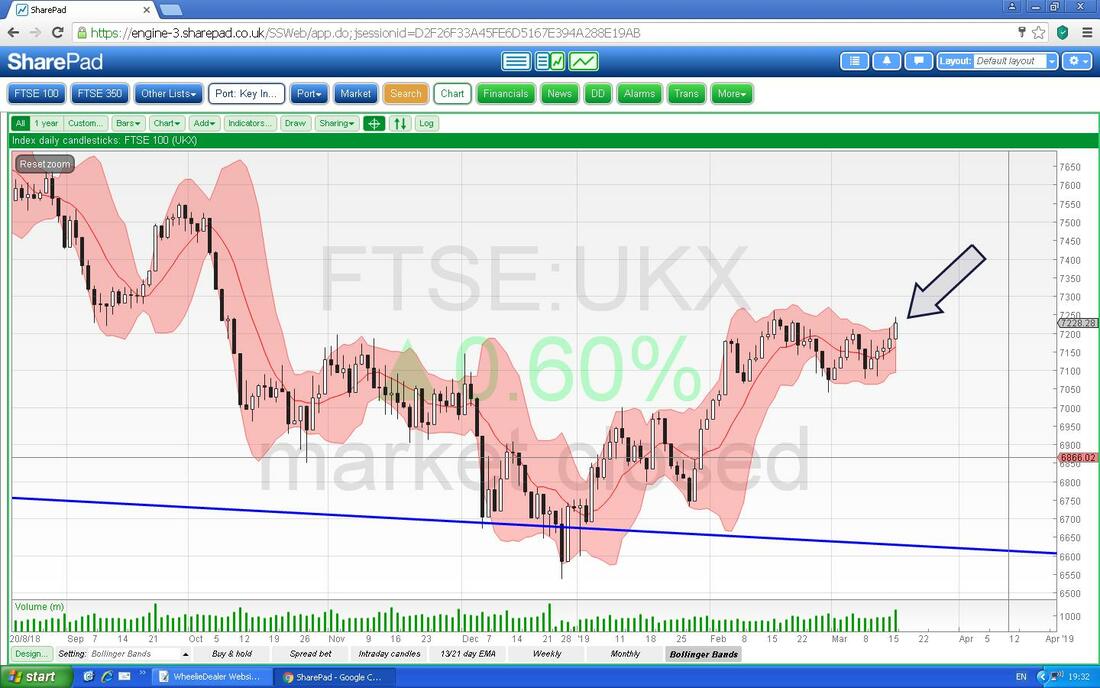
Now we have the Daily Candles with the Bollie Bands. My Black Arrow shows we are up near the Upper Band and this could be a constraint on progress short term.
Pound vs. Dollar
There is some link between what the Pound does and what the FTSE100 does although it is far from a perfect Inverse Correlation as many People think. In fact, if anything they are Positively Correlated of late with both the Pound rising and the FTSE100 rising for 2019 so far. The weird thing is that they seem to move in opposite directions (Inverse Correlation) during the Day but on the ‘bigger picture’ they are more Correlated and move together. My Blue Lines are showing an Uptrend Channel that seems to be in place now and this suggests more gains for the Pound. Note also the 13/21 Day EMAs are suggesting the same. 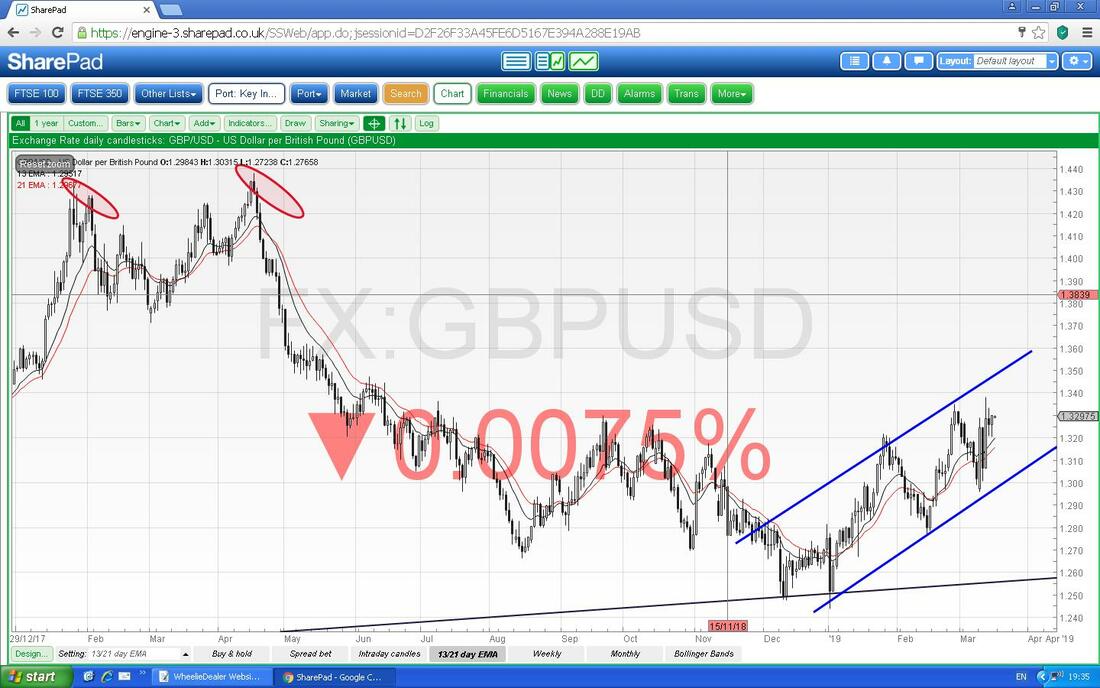
Whitbread WTB
I don’t hold WTB myself but it is an interesting Chart and I know a lot of Readers do hold it. As always with any kind of Chart ‘analysis’, we should look at the ‘Big Picture’ and the long time-frame first of all and then drill inwards. This is because the longer a Trend has been in place, the more ‘power’ and dominance it has over shorter-term events. The Chart below shows WTB going back as far as SharePad will let me and my Black Line with the Black Arrow is showing an Uptrend Support Line and this is important in the long term. My Red Horizontal Line with the Red Arrow up around 5500p is the ATH and this may be tough to get through. If it does Breakout above this ATH then that is a Bullish development and suggests more gains to come. 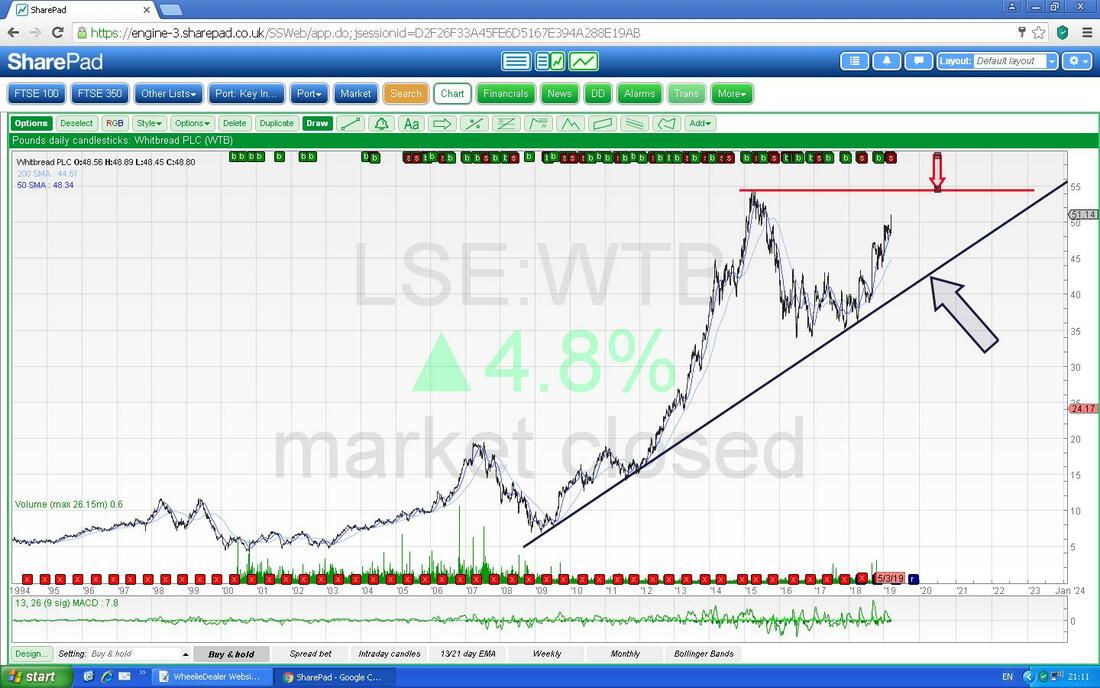
On my next Chart I have zoomed in a bit and this Chart has quite a few interesting concepts on it. First off look at my roughly drawn Green Lines - these are an attempt to show an Uptrend Channel which has been in force for a while and although it is a bit messy (and arguably a Wedge could be forming which is potentially Bearish), it is worth noting how this shows the usual pattern of a surge upwards, followed by a sideways consolidation type move, followed by another surge upwards etc. (bit like a Staircase). Note that the Price now has Broken-out over the Blue Line (marked by my Blue Arrow) at about 5000p (which in itself is an important psychological level) and this looks Bullish.
That Red Horizontal ATH Resistance Line up near 5500p is pretty key here though. 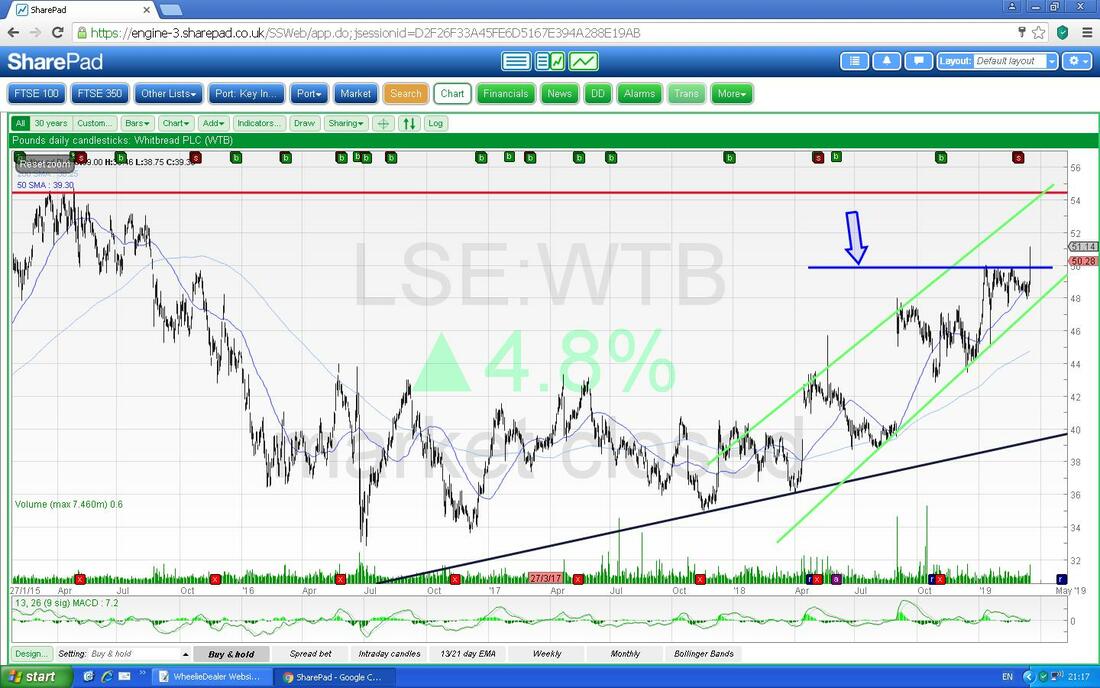
XP Power XPP
Again I don’t hold this one, but I was sniffing through a copy of Investors Chronicle a few days ago and spotted that XPP had dropped hugely off its previous ATH from 2018 after being a bit of a ‘wonder Stock’ for a while. Anyway, any Readers tempted to buy it would need to dig hard into the fundamentals and all that but from a Chart viewpoint there might be some promise. Again I am starting with the Big Picture and using the same approach I just employed on WTB and my Black Line is showing Uptrend Support (marked by the Black Arrow) and my Red Horizontal Line (Red Arrow) is the All Time High up around 3800p and clearly this will be tough Resistance if it ever gets up there again. 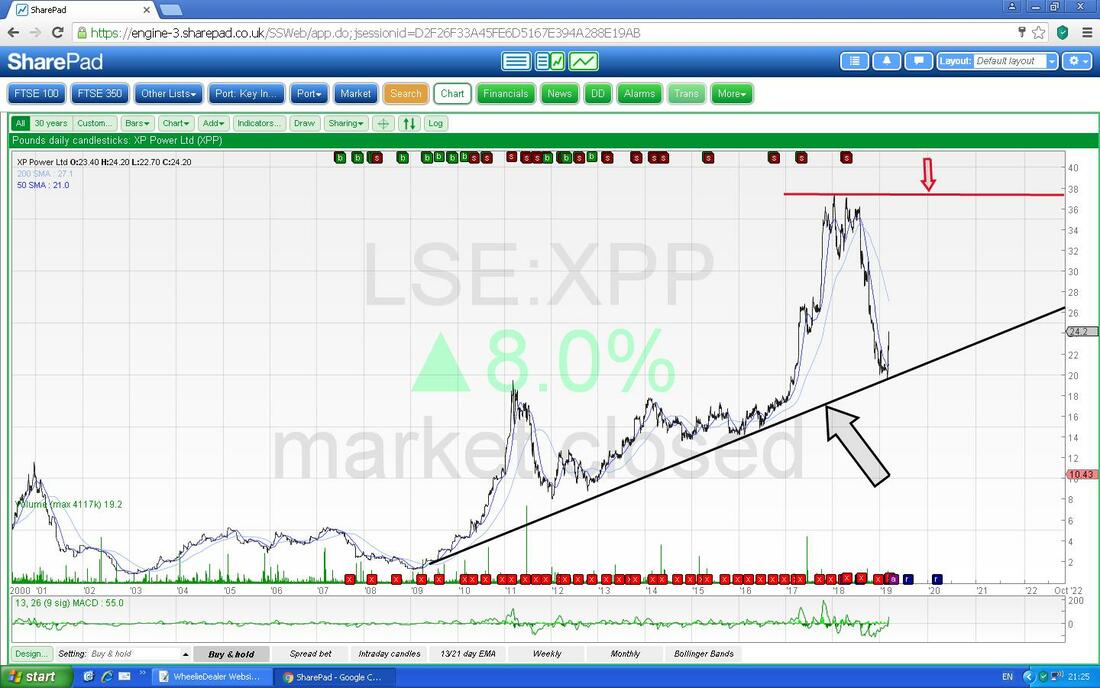
I have zoomed in on the Chart below and my Blue Arrow is showing where the Price had a big move up on Friday with a tasty Big White Up Candle and I have clicked the ‘X’ at the bottom of the Screen to get that Text in the Red Box and this shows that XPP goes Ex-Dividend on this Thursday 21st March for 33p per Share.
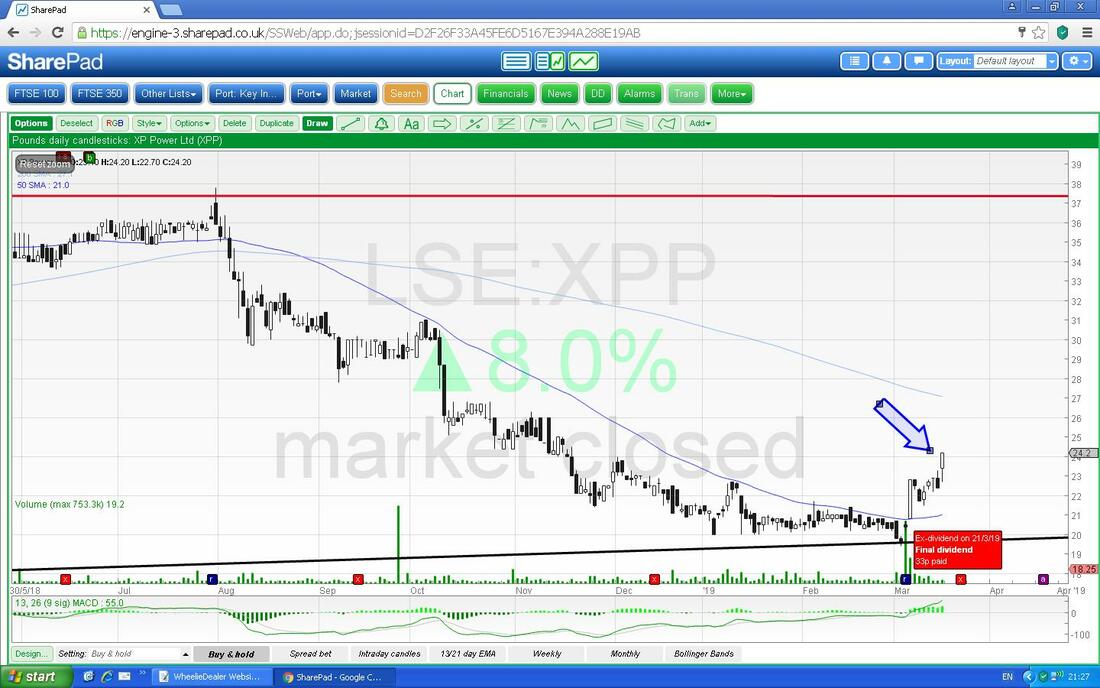
Just for curiosity sake I skipped over to my ‘List’ Screen which is setup as I want it (you can add and subtract gazillions of different Columns and stuff on SharePad - and if you are familiar with ShareScope you can see that these List Screens are very similar), just to see what the P/E and Divvy etc. are. Anyway, you can probably see from here that the Forecast Dividend is 3.6% for next year and the Forward P/E is 13.5. Obviously it needs to be figured out if these Numbers are sensible and there is always risk, but on the face of it these Numbers are attractive.
OK, I need to finish off there. Don’t forget to listen to the Podcast. Good luck in what could be another surreal Political Week !! Cheers, WD. 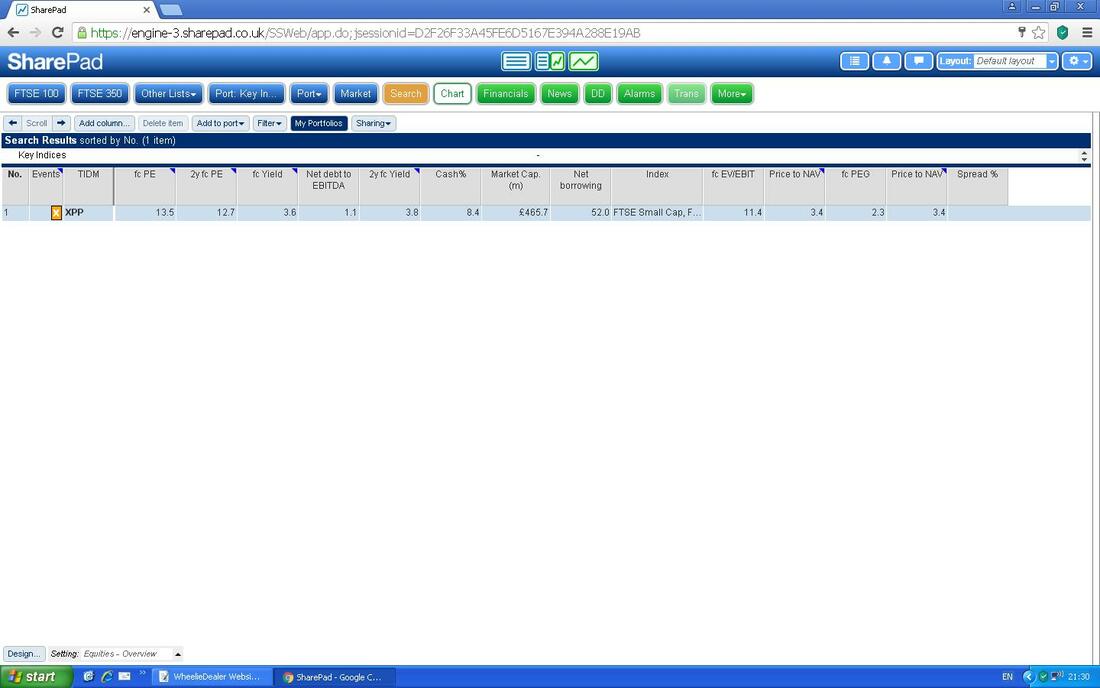
0 Comments
Leave a Reply. |

Stocks & Markets WheelieBlogsThese tend to be more Markets and Stocks related and timely - the Blog Page on the Main WheelieDealer Website has the 'Educational' stuff (well that's the theory anyway !!). Archives
October 2021
Categories
All
|
