

|
stocks & Markets blog |
|
I have had yet another very tough and frustrating week regarding my health, but thankfully I am a bit better now and able to knock out this Blog. As time always does, we have rapidly counted down to the WheelieBash and it is now just a handful of days away. It promises to be a very useful and fun event and we are on target to have the largest one ever. In fact, because of the terrific response, I am planning to do two WheelieBashes next year – one in May/June and one in September as per normal.
The current thinking is that I will establish a date in May or June and tell everyone what that is, and people can decide whether they want to go to WB1 or WB2. Once we get nearer the date of the first one, if there are any spaces left, I will let anyone come along – which means some lucky peeps might be able to attend both Bashes. We are limited to 60 at each event so I want to give more people the chance to attend at least one of them. We are limited by the size of the boozer, but I think that if the event got any bigger, it would become too big anyway and lose some of it’s relaxing and friendly feel.
Latest Podcast TPI 56
TPI 56 was released on Friday and this one covers loads of Stock ideas and we have quite a chat about the prospects for Food Delivery Companies. We also cover the thorny subject of when to dump a Stock, and this is in the particular context of what to do when a Profit Warning hits one of our Stocks. As always we cover loads of aspects around Stock Investing and I am sure Listeners will enjoy it – in fact, many people have fed-back on Twitter that it is one of our best yet. If is well worth the FREE subscription, just for the Stock ideas !! (and no, we won’t be refunding any subs for dissatisfied Listeners !!) If you go to the ‘Conkers Corner’ Channel on all the major Platforms, then you should find the full archive of ‘Twin Petes Investing’ Podcasts there. You can find it on Soundcloud and Youtube at the links below: Soundcloud here: https://soundcloud.com/user-479955511/conkers3-wheeliedealer-56-the-gs-of-shipping-sdg-atvi-mdt-ckn-orph-polb-slp-smt-bcn YouTube here: https://www.youtube.com/watch?v=HhR49MIBwGY Last Week Thankfully despite things being pretty quiet, my Portfolio managed to add 1.6% and it is back up at its All Time High. This recovered the hit from the week before which is rather sweet and hopefully, we can scrape through September without too much pain. I am being ultra-cautious and I have a small Short Spreadbet on the FTSE100 as the start of a Hedge, but I suspect that could get stopped-out. I am in no rush to buy anything although there is one Stock I am stalking with regards to adding in my Income Portfolio. Blog Slate It is more than a little frustrating that my health seems to have been going backwards again, but hopefully the new impetus I have injected into the NHS will make a recovery possible – although it might take a while. With this being the case, I am unlikely to be able to do any Educational Blogs for a while but I will try to do the Weekend ones (like this one !!). I will need to update the ‘Monthly Performance’ page for August and I am hoping it will be a gain for August, which looks pretty likely. I am also aware that there is loads of housekeeping and tidying up needed on both websites, but I won’t be able to address all that until I am fixed. With luck I can do that in the Winter along with a new venture that I have planned. Brent Oil Comp All the Charts I show are taken from the excellent SharePad software I use and if you click on the images then they should get a bit bigger on your screen (I recommend you read these Blogs on a big screen rather than just a Fone – there is a lot of detail to be seen). I know some Readers actually look at their Charts on SharePad or whatever method they use as they read through my blogs. If you fancy using SharePad or ShareScope yourself, then you can get 1 month’s Free Data if you go to the ‘Subscribe’ page on their website and then select the Product you want, and then you should see a ‘Promo Code’ box and if you type ‘twinpetes’ into that box, then the discount will apply. You can also get this by clicking on the Adverts that are all over my websites. I get a small payment for introducing you, so thank you very much !! (it’s just a shame I can’t spend it on beer much at the moment…..) https://www.sharescope.co.uk/ I noticed also that SharePad/ShareScope have updated the landing page on their website and there is much better detail regarding the capabilities and features of their software now. In fact, Podcast TPI 50 contains a discussion with the Founder of SharePad/ShareScope, Martin Stamp. Highly recommended and of course you can find that one on the ‘Twin Petes Investing Podcast’ page on WD2. Hurricane Ida hitting Louisiana etc. has boosted the Oil Price, so I thought it would be good to start with that Chart because of its impact on the FTSE100, and I have a small Short Position on the FTSE100 at the moment (see my ‘Trades’ page). I am kicking off with the Monthly Candles for Brent Oil Comp, although please bear in mind that there is one more day of August left, so the August Candle is not yet valid, although I suspect it gives us a very good idea of what the final Candle will look like. My Red Arrow is pointing to the Candle that has shaped up so far for August; this has a sizeable Down ‘Body’ and also points at good Support at $65. Below that there is Support at $60 and then $55 – so really this is quite well supported. My Blue Arrow is pointing to the July Candle, and it could be that this is a Turning Point downwards with the Pivot at $77.9. My Green Arrow is pointing to Resistance at $86.7 and that seems tough to crack at the moment. 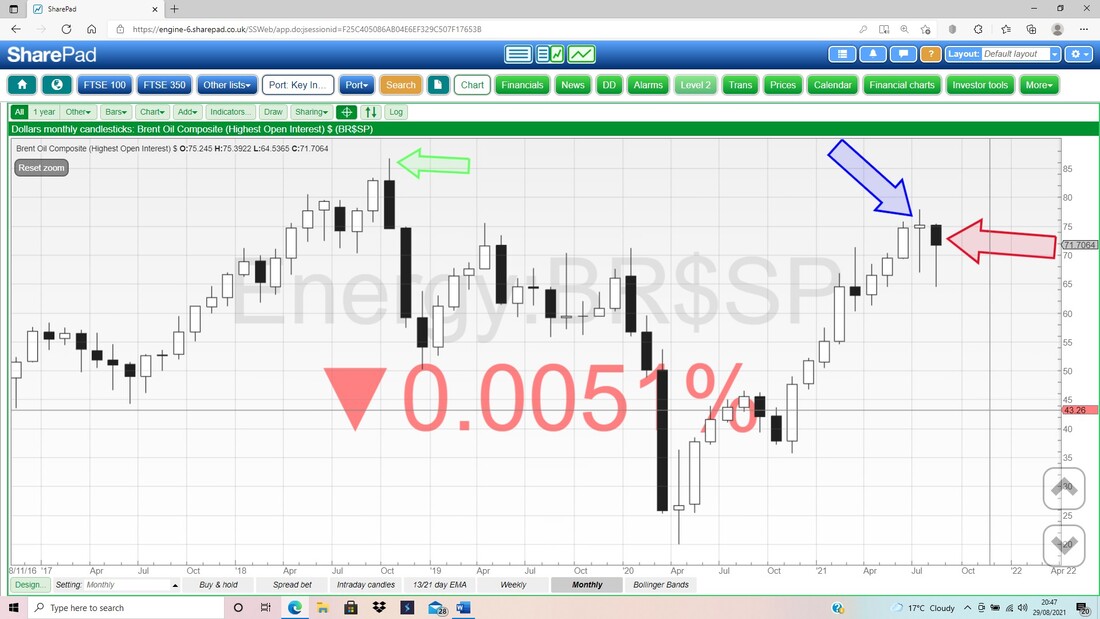
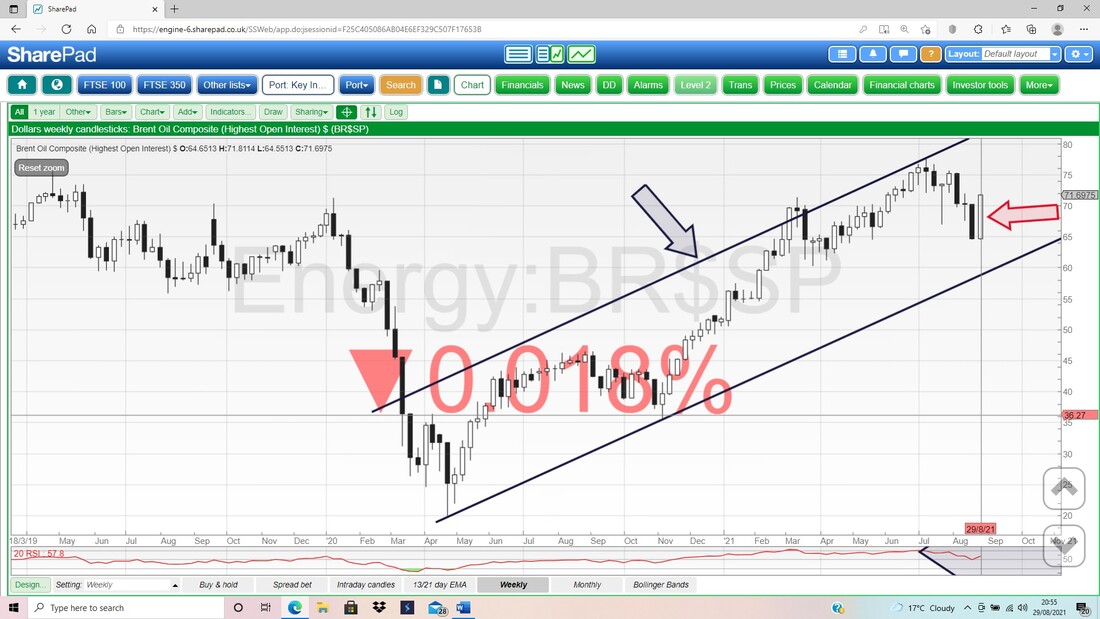
Next up the Weekly Candles for Brent Oil Comp and my Red Arrow is pointing to a nice Up Candle from last week and this looks pretty Bullish to me. My Black Arrow is marking a Top Resistance Line that I have drawn in as a ‘Line of Best Fit’ which is sort of parallel with the Bottom Black Support Line. This could be a nice Uptrend Channel which the Brent Oil Comp Price is following.
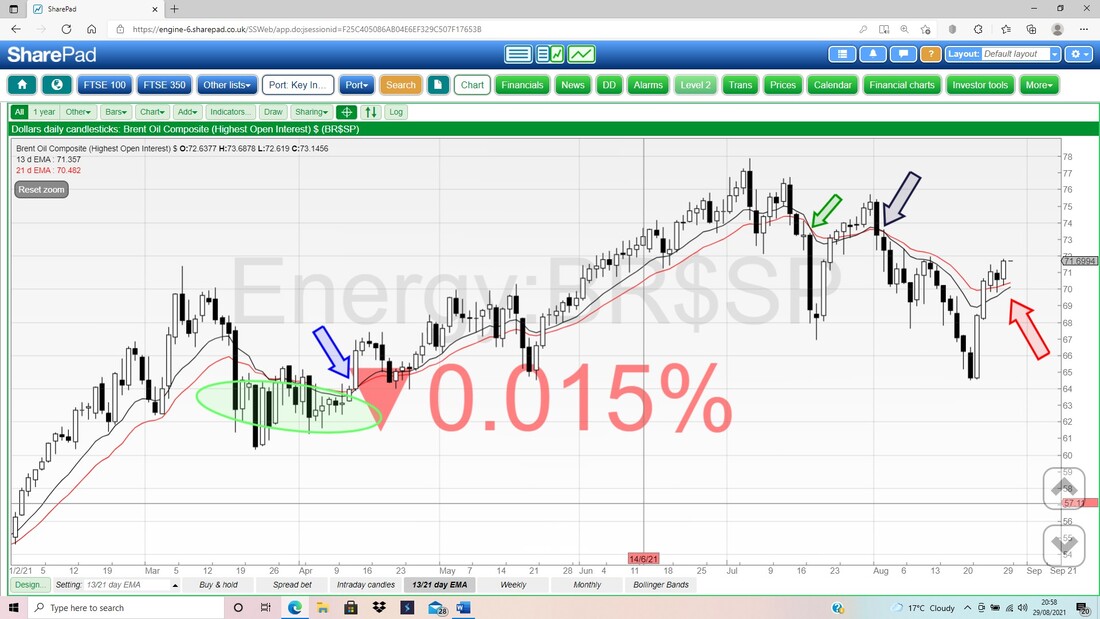
Next up we have the Daily Candles, but I am ignoring them here. My focus instead is upon the Black Wiggly 13 Day EMA Line (Exponential Moving Average) and the Red Wavy 21 Day EMA Line. My Red Arrow is pointing to where we nearly have a ‘Bull Cross’ – if that happens, it is highly predictive of more gains in the next few weeks.
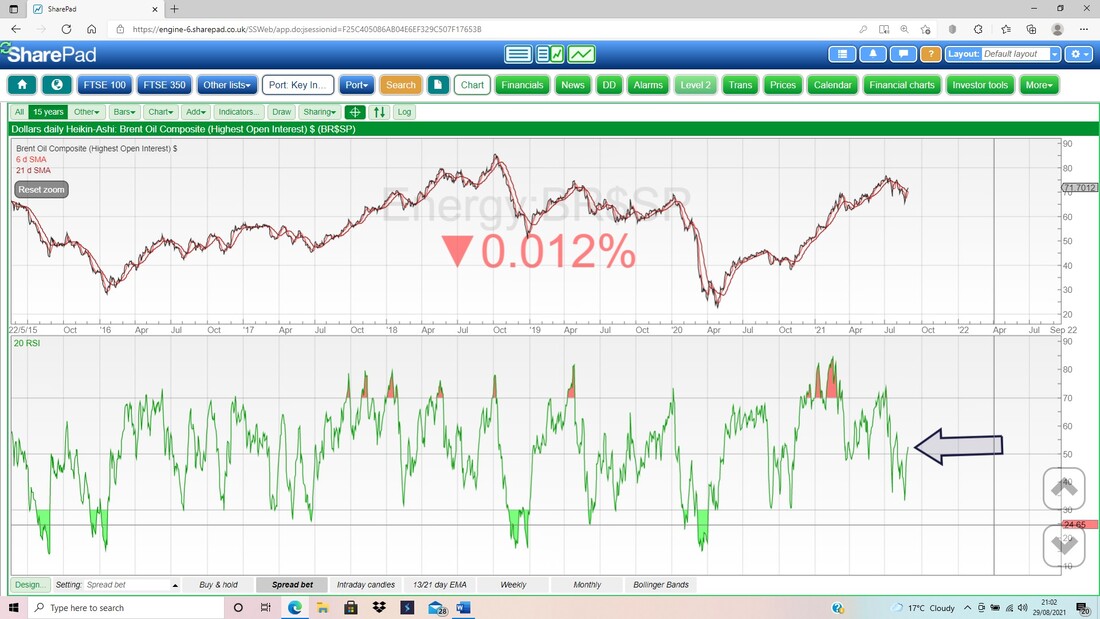
In the bottom window below, we have the RSI (Relative Strength Index or Indicator) for the Daily Brent Oil Comp Chart. My Black Arrow is pointing to a Reading of RSI 52 and this is pretty much at the Neutral 50 level. This means the Brent Price could fall or rise a lot !!
Last up for Brent Oil Comp, we have the Daily Candles and the Pink Zone is marking the Upper and Lower Bollinger Bands. My Blue Arrow is pointing to a nice Up Candle for Friday, and note there is a bit of room up to just below $74 where the Top Band sits.
Below we have the Red Midpoint Line (marked by my Red Arrow) and this is at about $69 and the Bottom Band is at about $64.5. These should be decent Support. 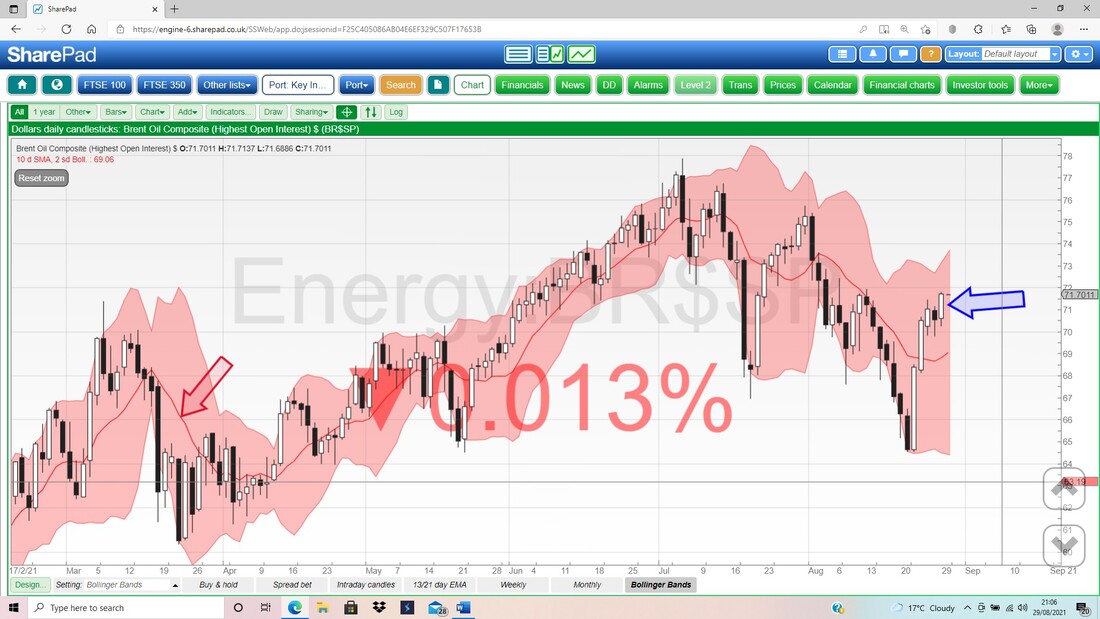
FTSE100
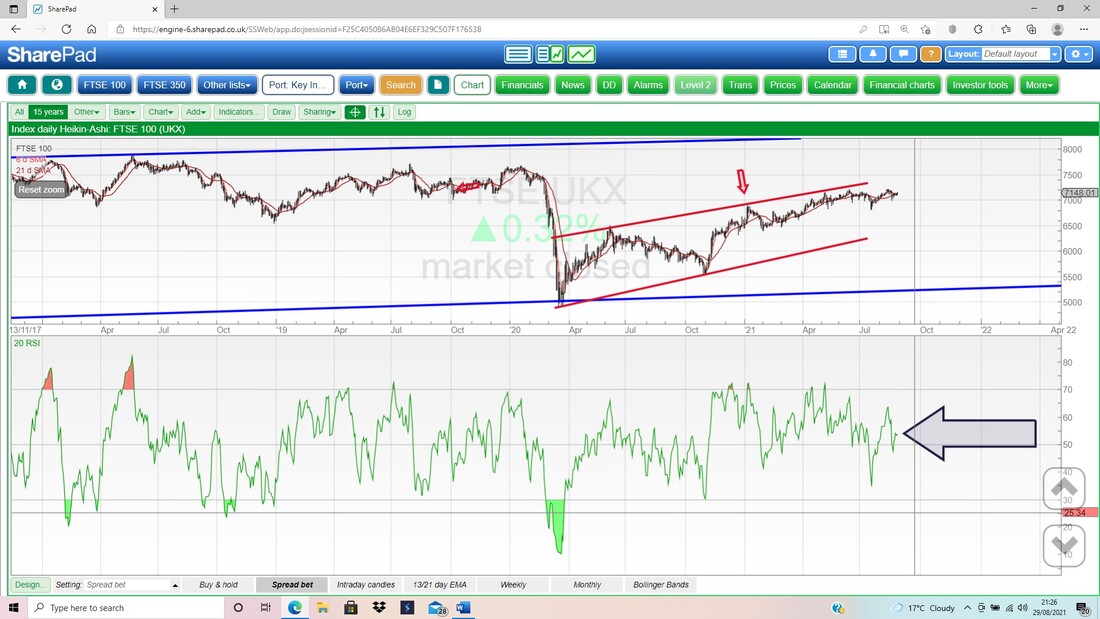
First we have the Monthly Candles although remember August is not yet complete (by just one day). My Blue Arrow is pointing to a small Up Candle that has formed for August on the FTSE100, and this is bashing up against Resistance at 7224. My Stoploss on the Short I have running is just above this level. To the downside, there is decent Support from 6813. My Red Ellipse is highlighting a big Zone of Resistance and this runs up to the All Time High (ATH) which is at 7903. September tends to be a very weak month, which is why I have Shorted the FTSE100 to Hedge my Portfolio a little. It is only a Small Position so if my Stop gets triggered, I am not overly bothered. 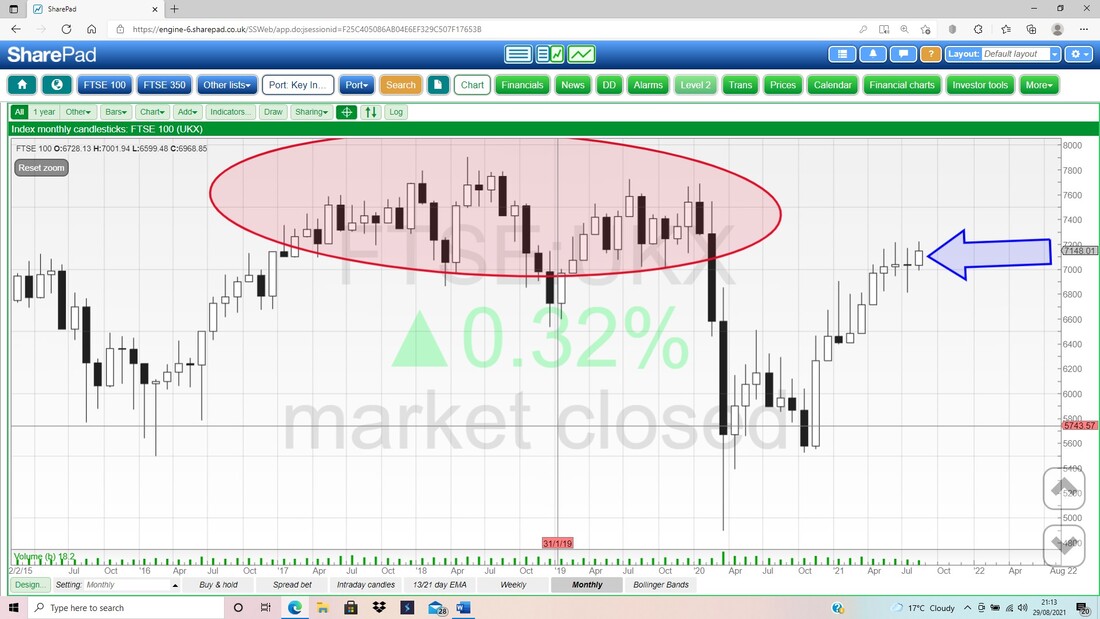
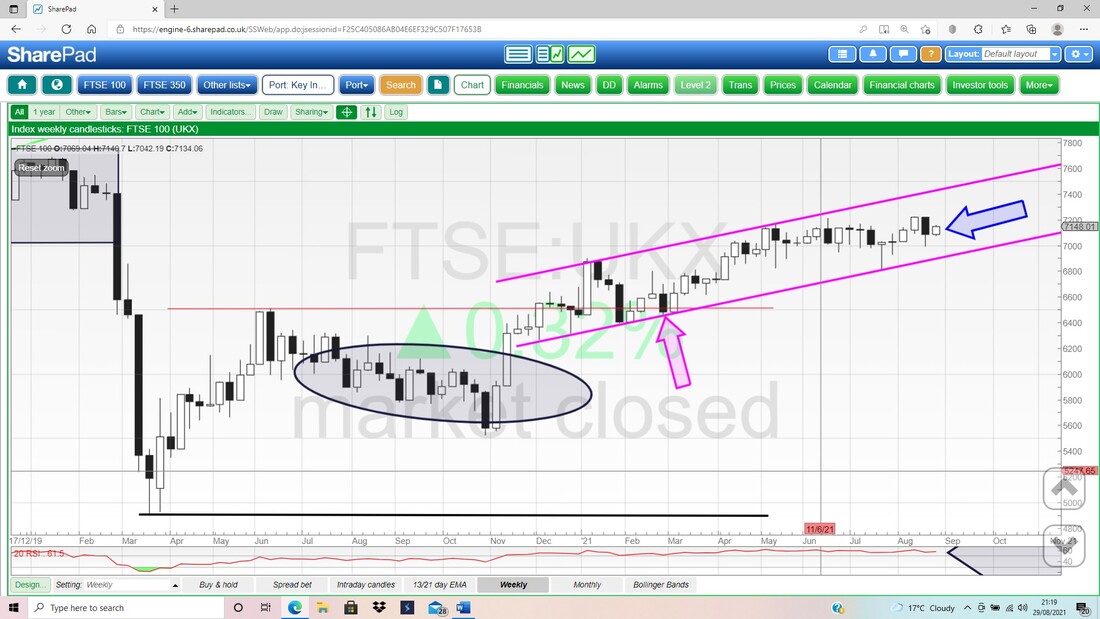
Next we have the Weekly for the FTSE100. My Blue Arrow is pointing to a small Up Candle from last week and this is a Doji really; which tells us not very much about the direction. Note how the Candles are nicely within my Parallel Pink/Mauve/Purple Lines, which form a nice gently sloping Uptrend Channel. Note also there is good Support at 7000.
Next I am looking at the 13 and 21 Day EMAs again. My Red Arrow is pointing to a Bull Cross and note this is still ‘in force’.
Note how I have changed the format to OHLC Bars (Open, High, Low, Close) rather than Candlesticks, this is because it is easier to see the EMA Lines, but I must say I think OHLC Bars suck. 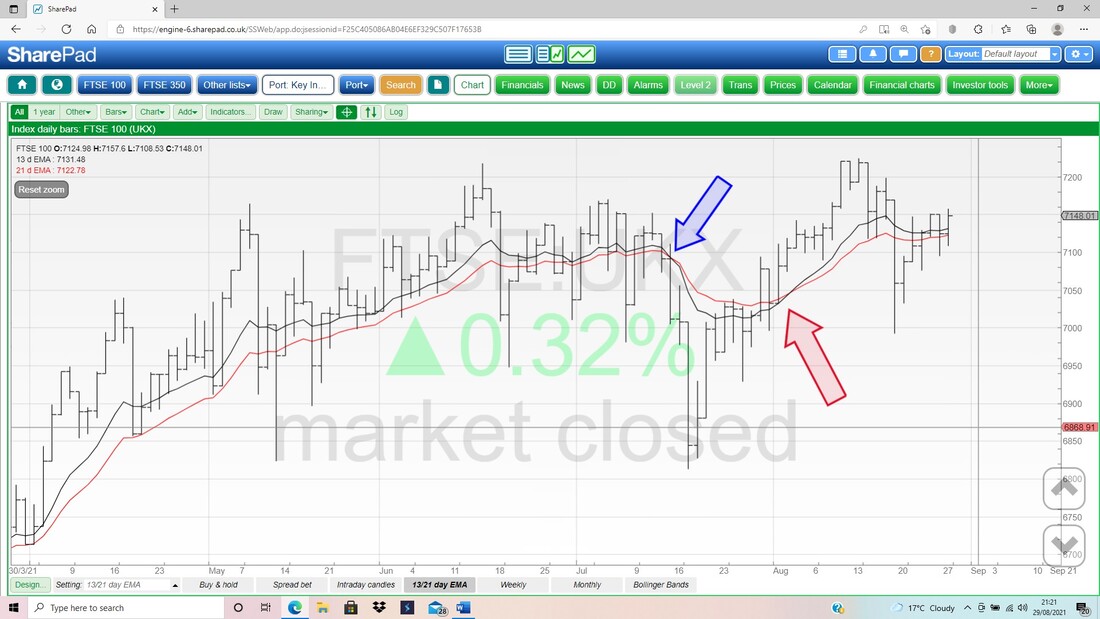
In the bottom window below, we have the RSI for the FTSE100 Daily, and on a reading of RSI 54 this is pretty much Neutral.
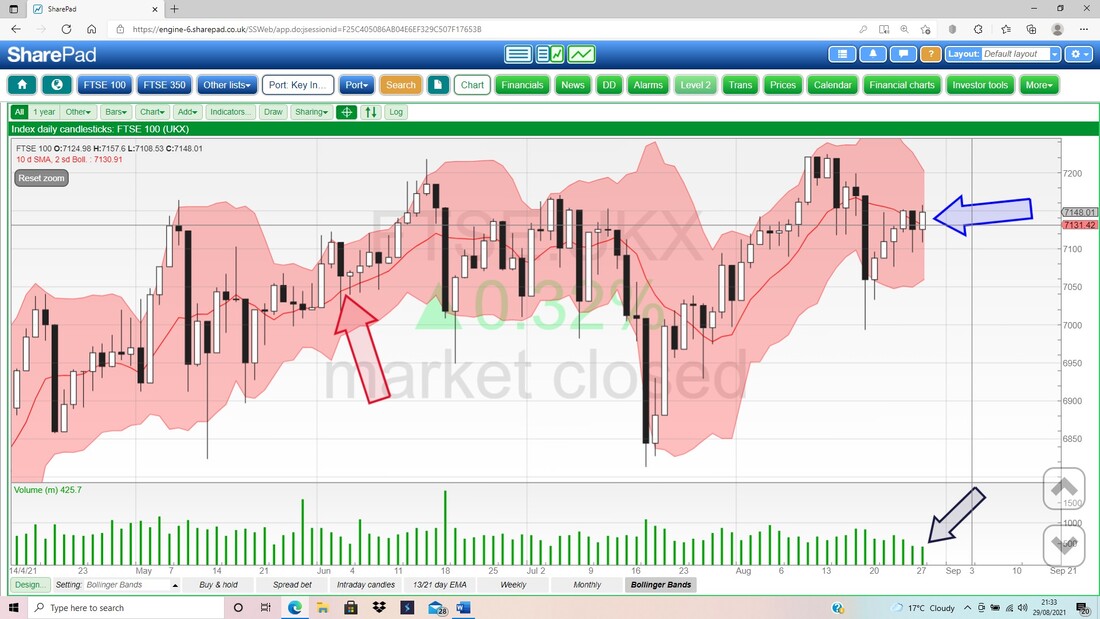
My Blue Arrow on the next Chart is pointing to a small Up Candle for Friday, and this means the FTSE100 didn’t really move much last week and it is pretty much wiggling around the Bollinger Bands Red Midpoint Line (Red Arrow).
My Top Band is at 7200 and the Bottom Band is at 7060; these should be Resistance and Support respectively. In the bottom window, look where my Black Arrow is, that the Volumes are a farce.
S&P500
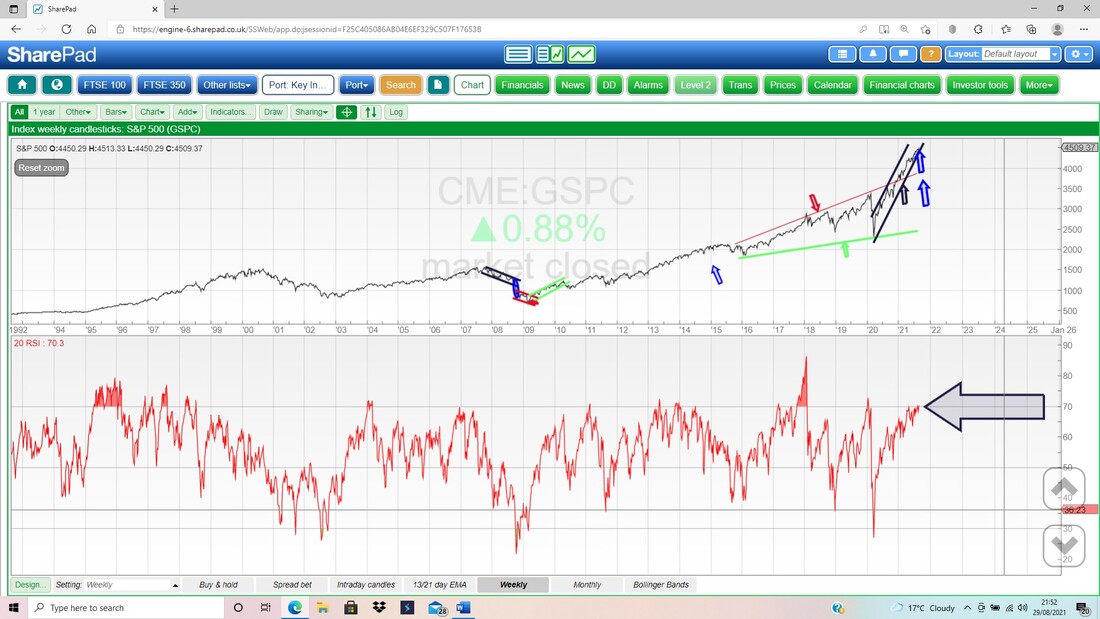
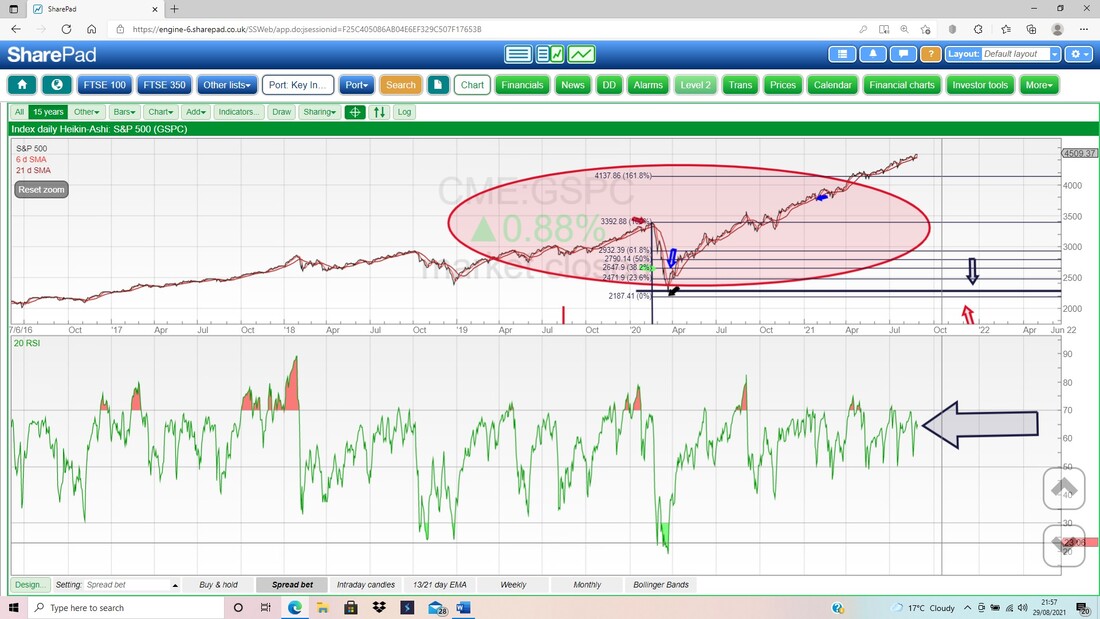
There’s some weird differences on Bank Holidays in the next week or so. In the UK we obviously have our Bank Holiday Monday on the 30th August, when this Blog should be published on my website WD2, but in the US, there Bank Holiday is the Monday, one week later. This could mean low volumes and strange markets for a while. First up the Monthly Candles for the S&P500 (yet again, remember there is one day left to go to make the August Candle valid – although at the time of finishing this Blog on Monday 30th August, the Market is trading). My Blue Arrow is pointing to a reasonable Up Candle for August and this seems Bullish to me. What does strike me about this Chart though, is that the rise is extremely steep and almost parabolic. That strikes me as very fragile and suggests there could be a full-on correction at some point. 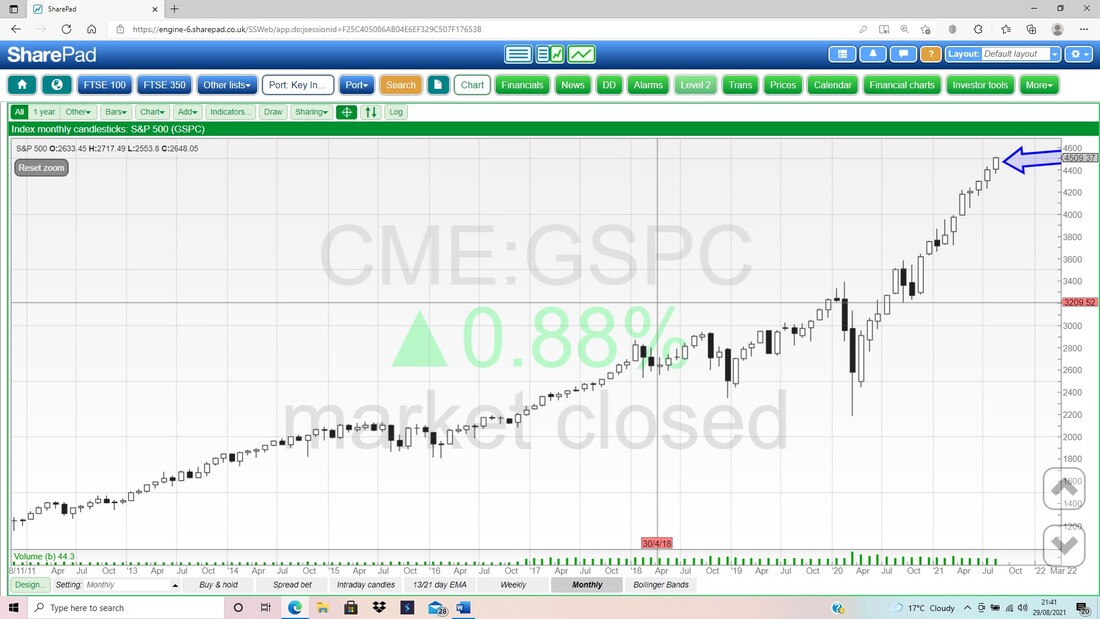
Next the Weekly Candles for the S&P500 and my Blue Arrow is pointing to a Small Up Candle and this hit a New ATH last week. This is Bullish behaviour.
I have done a cheeky bit of line-fitting here and moved the Bottom Support Line of my Uptrend Channel (the Black Lines, Black Arrow) down a little to fit better. It is a bit naughty but I think it is valid here. To the downside, there is decent Support around 4200 and then 4000. 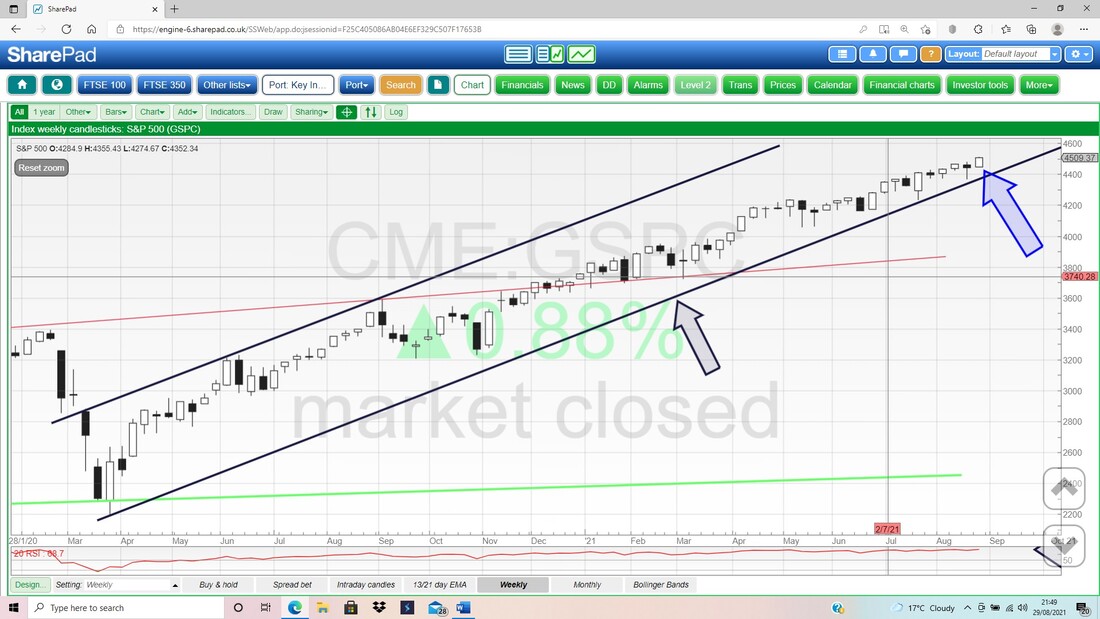
In the bottom window below, we have the RSI for the S&P500 Weekly. On a Reading of RSI 70 where my Black Arrow is, this is over-bought but not really extreme. It suggests a bit more upside is possible but the days are numbered on this Rally without some sort of Consolidation move; which means sideways or down a bit.
Next in the bottom window we have the RSI for the Daily S&P500. My Black Arrow is pointing to RSI 65 and this is quite high, but not extreme. I interpret this as meaning the S&P500 could rise a little more in coming days and not get over extended.
Finally, tonight we have the Daily Candles for the S&P500 with the Bollinger Bands. My Blue Arrow is pointing to a nice Up Candle from Friday and there is a little bit of space up to the Top Bollinger at about 4530. The Midpoint Line (Red Line, Red Arrow) is at about 4460 and could be Support, and the Bottom Line is at 4390.
OK, that’s it for this week. If you are coming to the Bash, I will see you very soon !! Cheers, WD. 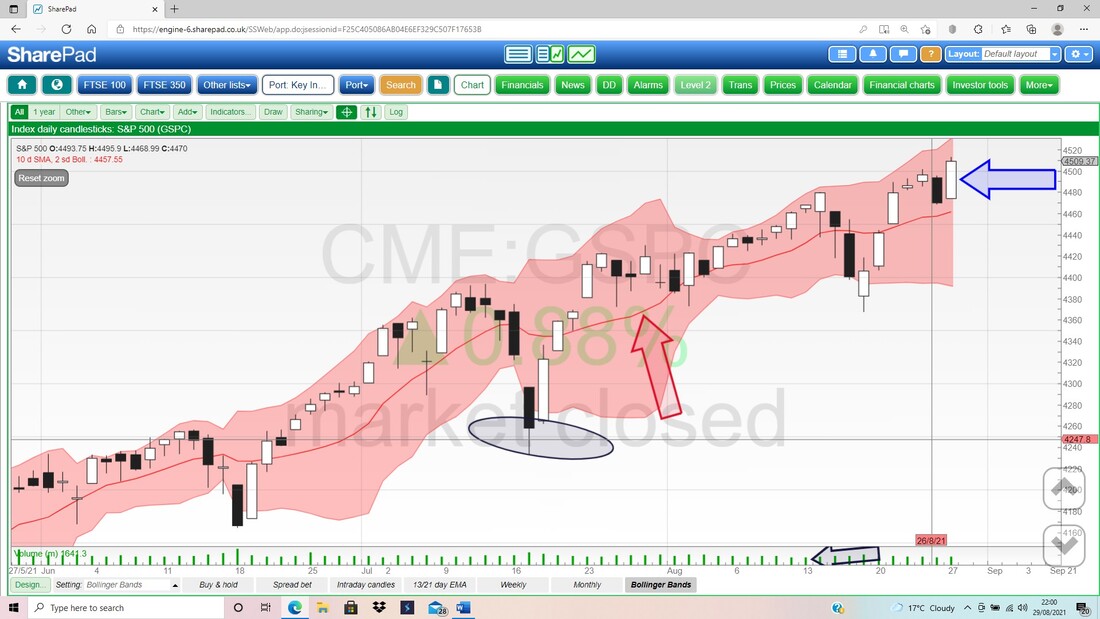
0 Comments
Leave a Reply. |

Stocks & Markets WheelieBlogsThese tend to be more Markets and Stocks related and timely - the Blog Page on the Main WheelieDealer Website has the 'Educational' stuff (well that's the theory anyway !!). Archives
October 2021
Categories
All
|
