

|
stocks & Markets blog |
|
In the last couple of weeks we have seen quite a good rally and Stocks have done pretty well. I am not moaning because I have done quite well out of it myself but I just can’t see this lasting and I wonder if the sell-off at the tail end of the week just gone is a precursor to something more significant.
I have mentioned this a lot in various places and just this afternoon on Twitter I was outlining why I am seeing a Pullback as highly likely quite soon. I simply cannot see how we have a rally in November and December like usual, unless we have had a Sell-off beforehand which points to Autumn and more specifically, September which is historically the worse month.
The simple reality is that Markets do not move up in straight lines and complacency seems very high to me at the moment, and I just cannot envisage Markets rising from now all the way through to December 31st without some sort of correction just to calm everything down and to let a new tranche of Buyers come in at attractive prices.
When I go into the Charts later I will probably show some Technical concerns around this, but in essence the following points highlight my current mindset of caution:
Of course a Sell-off might not happen and I am relaxed with regards to whatever it does because I am positioned and ready. I am 85% Long with a small bit of protective Hedging in place with a Short on the FTSE100. If we see recent Support from about 2 weeks ago at about 5850 fail, then I will Short the FTSE100 more. If that doesn’t happen and the Markets keep going up, then my Stoploss will kick in and I will be positioned Long 100% and ready for the move up. New Podcast TPI 29 On Friday we issued TPI 29 and you can hear it at the Link below on Soundcloud. If you use Apple or Audioboom or Spotify etc., then go to the ‘Conkers Corner’ Channel and you can find it there. We cover loads of educational stuff on this one and I think it is right up there with our best offerings so far: https://soundcloud.com/user-479955511/conkers3-wheeliedealer-29-compounding-investing-winners-adm-loop-swg-boo-5g-loop-midw WheelieBash 2020 An extremely pleasant recent visit to the White Hart at Winkfield involved a chat with Phil the Landlord about what we could do for the WheelieBash this year, in light of all the Lockdown Rules etc. Fortunately, we will be able to do something but numbers have to be restricted to 30 in case the weather is unusually dodgy and we are all forced inside where of course ‘Social Distancing’ is harder to do. At the time of typing this we have a few places remaining so if you want to come then make sure you grab your slot – the best way is to DM me on Twitter or to send me an email at [email protected]. Oh, I am sure it would help if you knew the date and we are going for Saturday 5th September. You can see more about the White Hart here: https://www.thewhitehartwinkfield.co.uk/ As usual attendance is FREE and you just need to rock up when you like (I will probably get there about 12 noon ish) and you can stay as long as you fancy. We tend to get a great crowd with a total mixture of ages and skill levels and Newbies in particular will feel right at home and no one judges anybody or anything like that - it is a superb atmosphere of like-minded people who are all trying to do their best to take on the Markets and extract some dosh out of them. It is very much a shared endeavour and an almost unique opportunity to meet up with many outstanding Investors and Traders who are more than willing to share their knowledge and experience. The White Hart is not far round the corner from Legoland and not far from the centre of Windsor and there are Hotels in many nearby locations even in good old Slough, and in previous years several people have travelled from far-flung places and made a weekend of it. There is a Car Park at the back of the Pub but it is pretty small really and has a horribly tight passageway to get to it. You might be able to park across the road in front of the Church and I am sure you can park further into Winkfield village. If you go to the ‘Events’ page which is somewhere on my websites (I think it is on WD2 so you should be able to find it from the Dropdown Menu up above this Blog you are reading) you can see pics from WheelieBashes of previous years and I am sure that even with the limitations that we must follow, it will still be a very worthwhile and fun event. Last Week Quite a solid week for me with a gain of 0.8% on my Portfolio and now it is down 1.6% since January 1st so I have nearly got back to breakeven. It would be lovely to see that but with my concerns about a drop coming soon it might be difficult to achieve in the short term. Having said that, despite my concerns of a drop, I still think Markets will be higher at December 31st but it is just about how we get there with a constant move up being extremely unlikely. As I mentioned above, I am 15% Hedged and not doing much at all at the moment. I am in no mood to buy anything and if I was to sell something for whatever reason, I would probably sit on the Cash until I think we have passed through any turbulence. Blog Slate Last night I made good progress on the Blog about how I time my Buy Trades (I am typing this on Saturday night) and with a bit of luck I am hoping I can publish that later this coming week. I am not sure what I will work on next although in the Podcast above I mention the concept of ‘Reducing your Opportunity Set’ and I think that would be a great topic for a Blog – and funnily enough I have a half-written Blog about this which I created months and months ago but never got around to finishing – so it would make sense to pick that up again. Finally I got around to updating the ‘Monthly Performance’ page on WD1 and that now includes July and I typed a few words around it as well. Today’s Offering from the Blog Index List Gods As usual I have dug out a Blog which I wrote a while back and you can find the full list of all Blogs on the ‘Blog Index List’ page that I have written over the years of doing the WD thing, and most have links to the Blog you want. https://wheeliedealer.weebly.com/educational-blogs/i-cant-buy-that-ive-missed-the-boat I see other Traders/Investors doing this all the time (not buying after a big move up) and it is certainly something to get your head around. Right, time for some Charts…….. Brent Oil Composite As always, the Charts I show are Screen Grabs from the excellent SharePad software that I use and if you click on each image they should get larger and clearer for you to see. My first chart below shows the Daily Candlesticks for Brent Oil Composite and my Black Arrow is pointing to where we have had a succession of ‘Doji’ Candles which just show a sideways move and lack of decision either way. My Blue Arrow and Blue Line are showing Horizontal Resistance at $46.24 and this is a crucial Level and if we breakout above this, I would expect $50 to be on the cards very soon. Such a move would be good for the FTSE100 and the DOW I suspect. To the downside, we need to watch Support at $41.79 which comes from the Hammer Candle on 30th July. If that fails it could get a bit ugly. My Green Arrow is pointing to a Bull Cross between the Black 13 Day EMA Line and the Red 21 Day EMA Line (Exponential Moving Averages). This is still ‘in force’ and we need to watch this for signs of a Bear Cross which would suggest downside ahead. 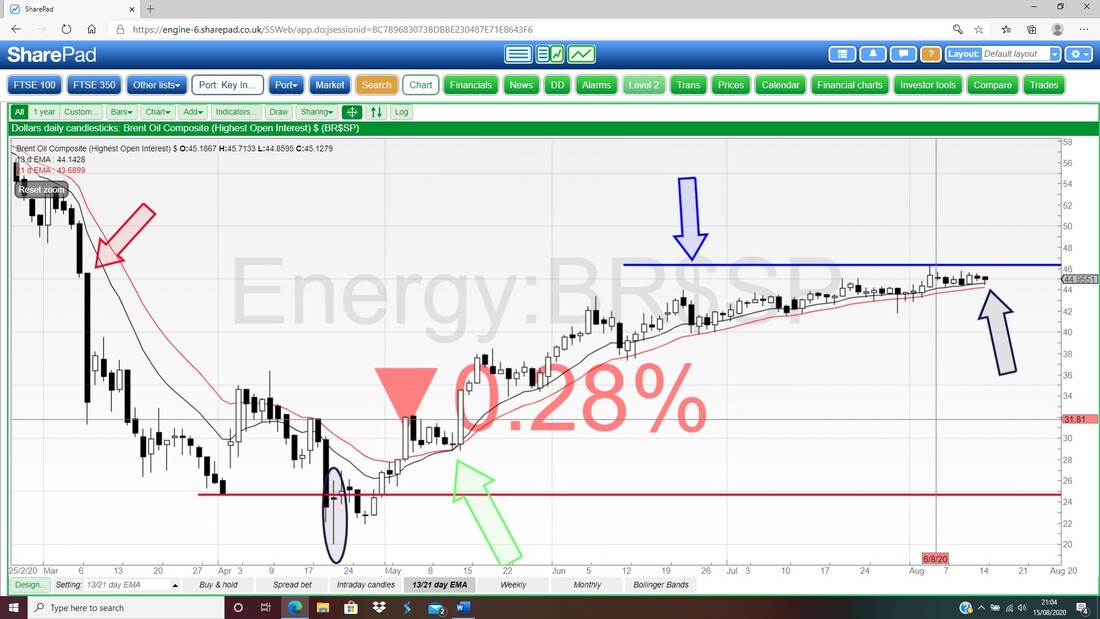
S&P500
I am showing the S&P500 because it is probably more representative of what the US Indexes are doing and it is a bit of a mix between the Nasdaq Tech stuff and the more boring huge Megacaps which make up the DOW with just 30 Stocks in it. First up the Monthly Candles which actually don’t look Bearish at all. My Blue Arrow is pointing at the Candle for July and note how this ‘over-rode’ the Candle for June which was actually Bearish looking with a ‘Bearish Shooting Star’ Candle which didn’t come to fruition. You have to ignore the White Candle that follows the one where my Blue Arrow is – that is the one shaping up for August and is not valid until the Close on the 31st August. Obviously the next 2 weeks of August are crucial and if we get a Bearish Candle that will suggest the trouble I am sensing for September is on the way. 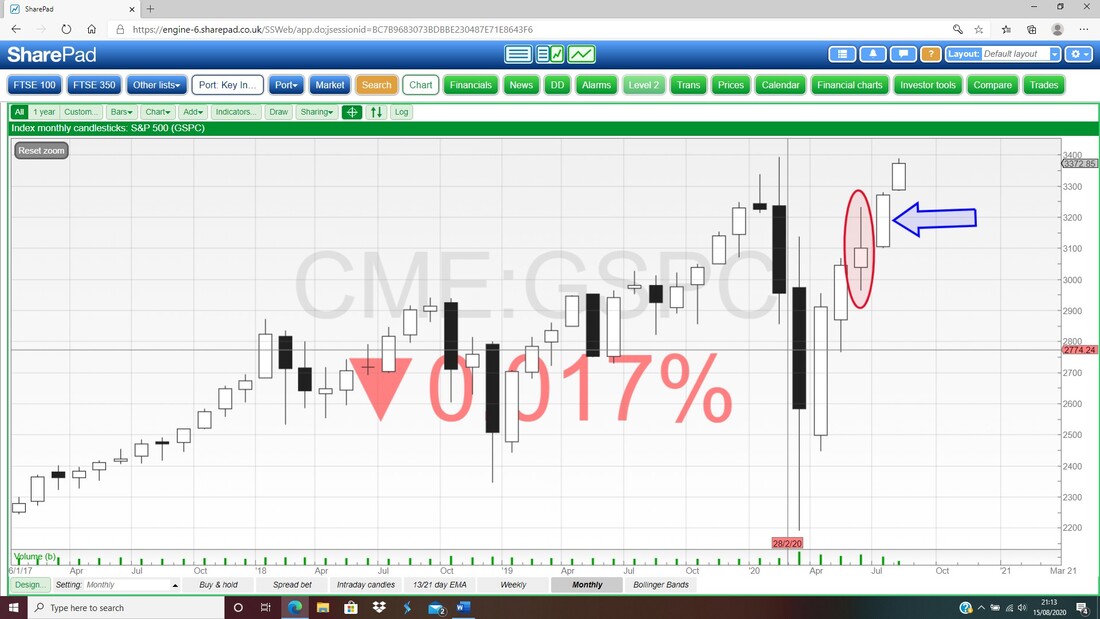
The next Chart has the Weekly Candles for the S&P500 and my Blue Arrow is pointing to the Candle for last week and this is a Doji which shows things were choppy and neither Bulls nor Bears really were in charge. My Black Ellipse over to the left is showing the All Time High at 3394 and we are very near that now. If the Price can get above the ATH in a convincing manner, then we should see more gains as a consequence of the Breakout. If that happens it would suggest my concerns of a Sell-off are reducing a lot.
To the downside there is Support from my Black Line at 3233 and my Red Line at 2965. 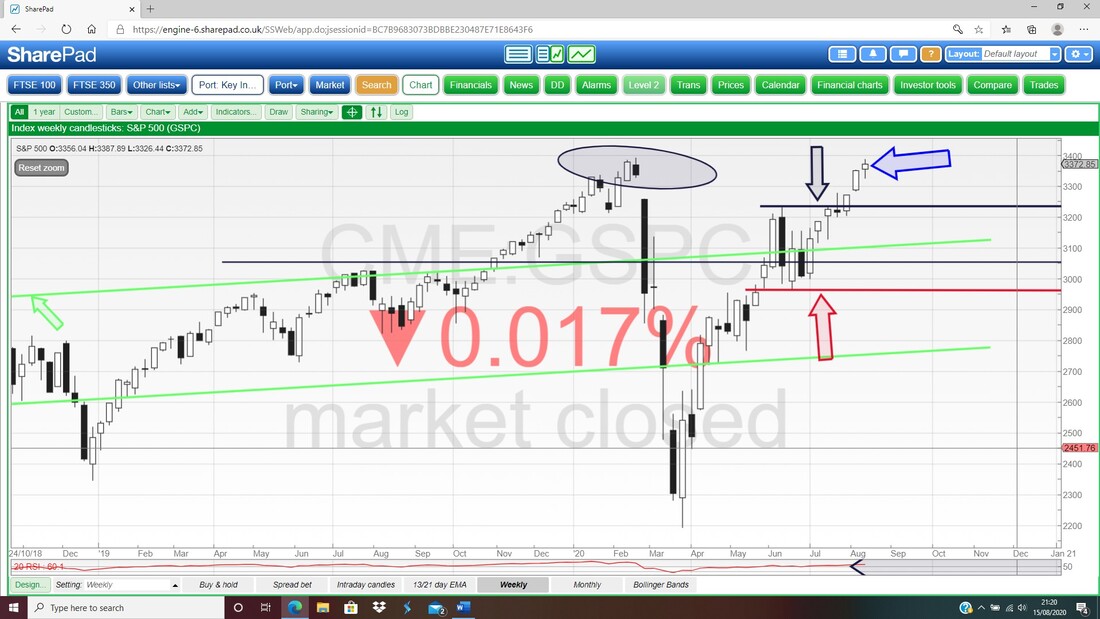
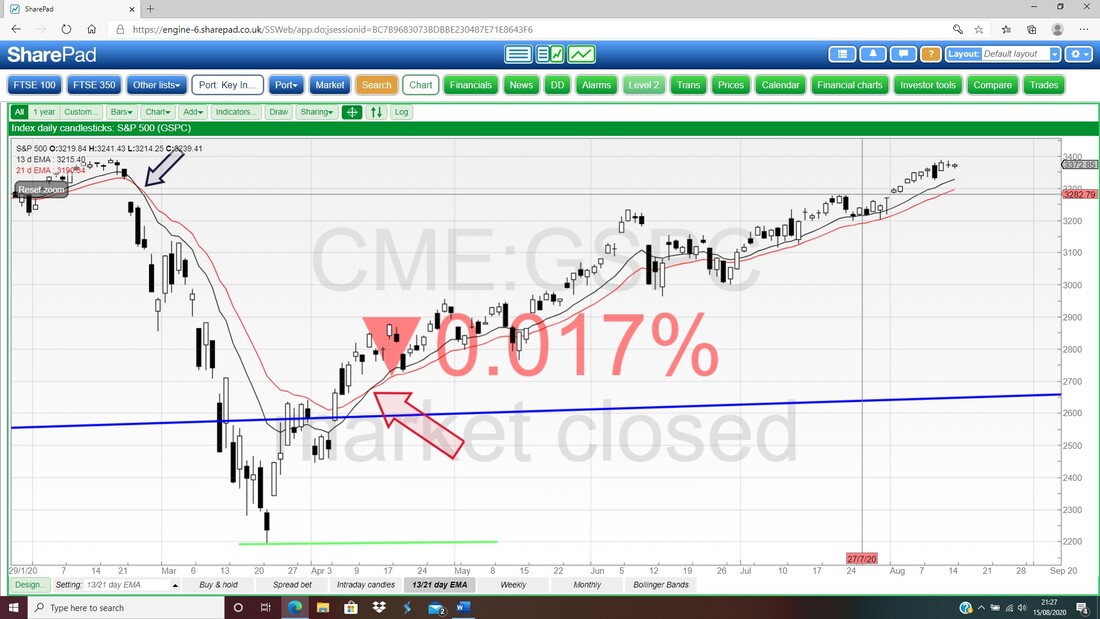
In the bottom window on my Screen below we have the RSI for the Daily on the S&P500 (Relative Strength Index) and on a Reading of RSI 70 this is a very high level and it would make sense for Markets to fall away from here. However, that does not necessarily mean a big drop but some sort of drop is looking very likely on this evidence. It is over-bought.
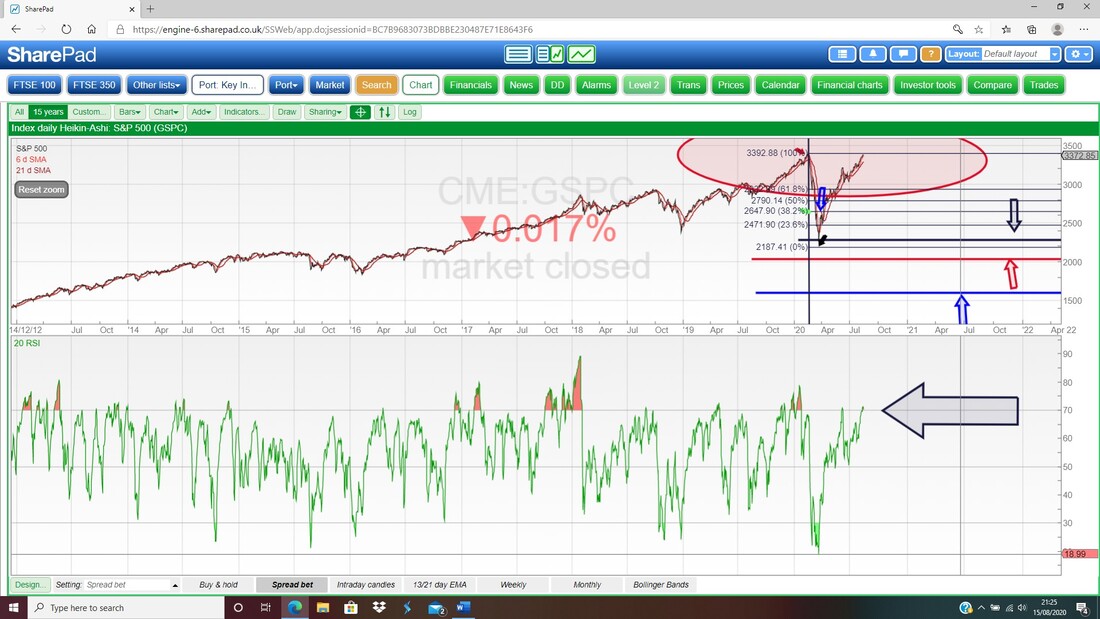
The next Chart is very important. At the moment we are very much in Bull mode on the 13 and 21 Day EMAs after the Bull Cross where my Red Arrow is. We need to now be alert for a Bear Cross which is like where my Black Arrow is. If that happens then it is most likely there is big trouble to come.
Dow Jones Industrials Index DOW
I won’t show much on this but we must be aware of what the Monthly Candles are saying on the Chart below. As usual you need to ignore the last Big White Up Candle and my Red Ellipse is marking a Bearish Shooting Star for June and then in July (where my Black Arrow is pointing) we had a Doji Candle which did not negate the Bearish Shooting Star. I suspect the difference to the S&P500 is simply explained by the weighting of big Tech Stocks to the S&P500 as the Nasdaq has continued its Bull Run. This also tells us that we need to watch the Nasdaq closely for signs of trouble. On the DOW, we need to now see how the Candle for August shapes up and if we get another Bearish Shooting Star that will not be good. 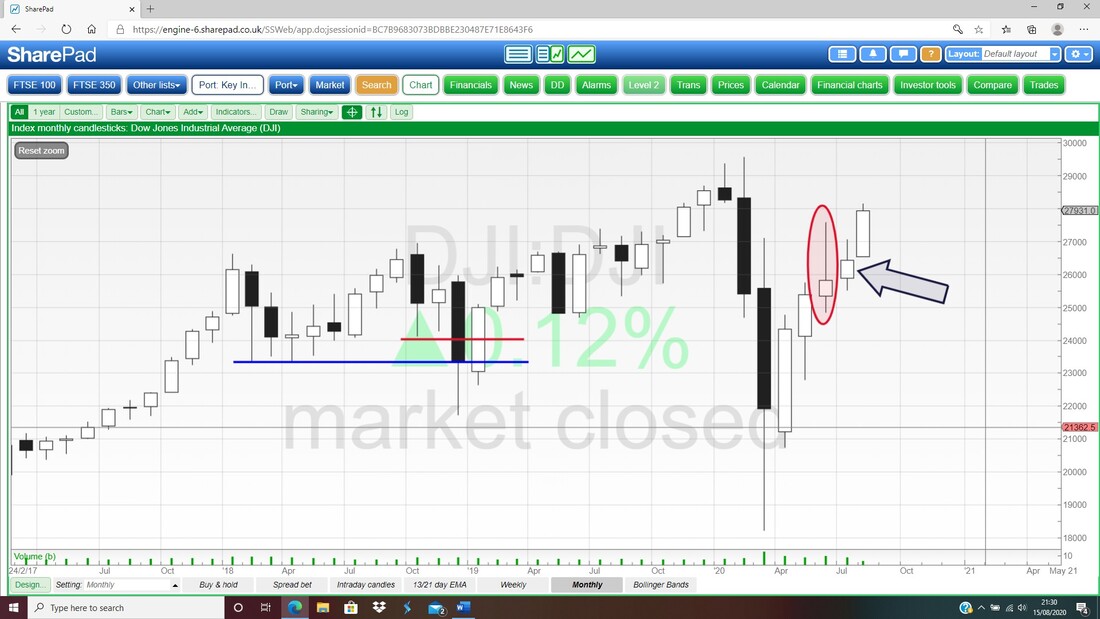
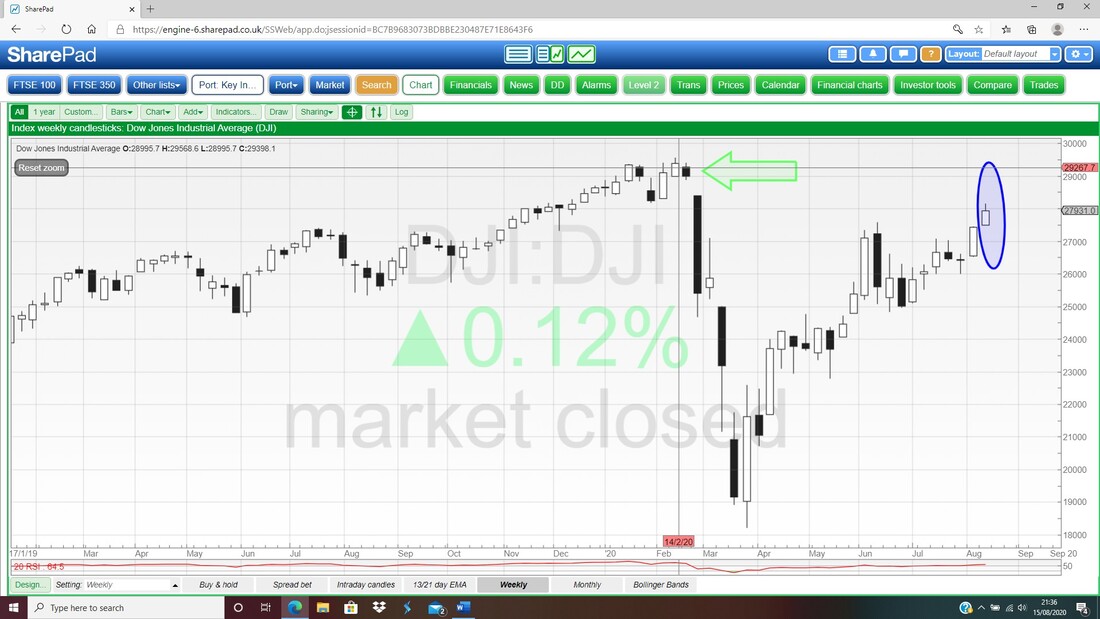
Next up the Weekly Candles for the DOW and my Blue Ellipse is showing a nice Bullish Up Candle from last week. My Green Arrow is pointing towards the All Time High up at 29568 and we really aren’t far from this.
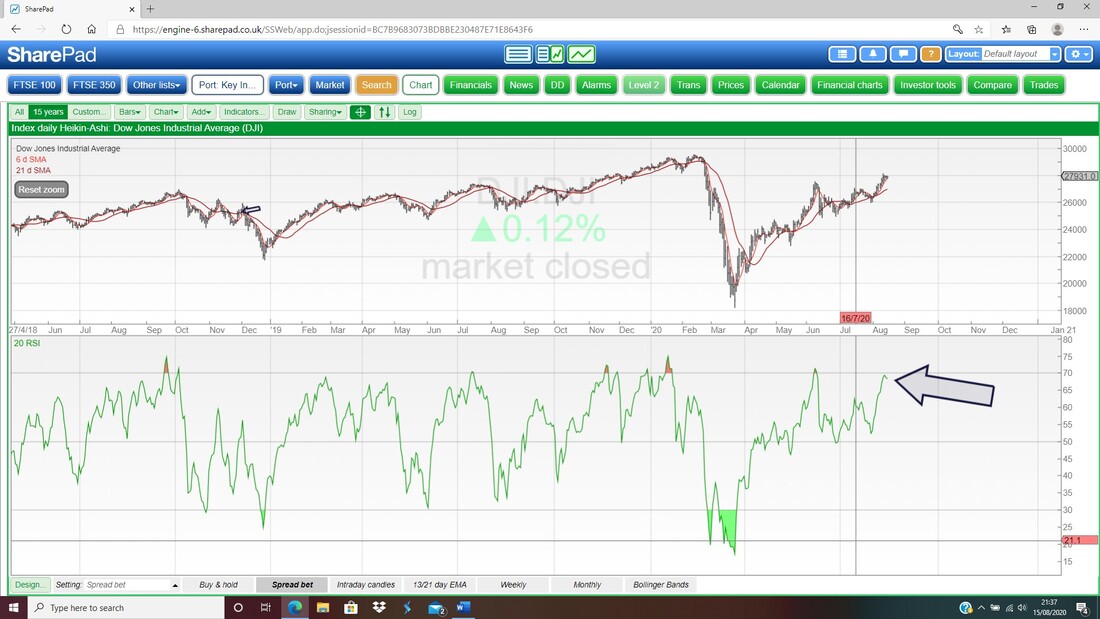
In the bottom window on my Chart below is the RSI for the DOW Daily and on a Reading of RSI 68 where my Black Arrow is this is very high and turning downwards.
Nasdaq Composite
My Chart below has the Weekly Candles for the Nasdaq Comp and where my Red Arrow is I am pointing to a Doji Candle from last week and this is perhaps a Bearish ‘Hanging Man’. Something to watch. I won’t show the Monthly but it is Bullish at the end of July. However, need to see how August forms up. 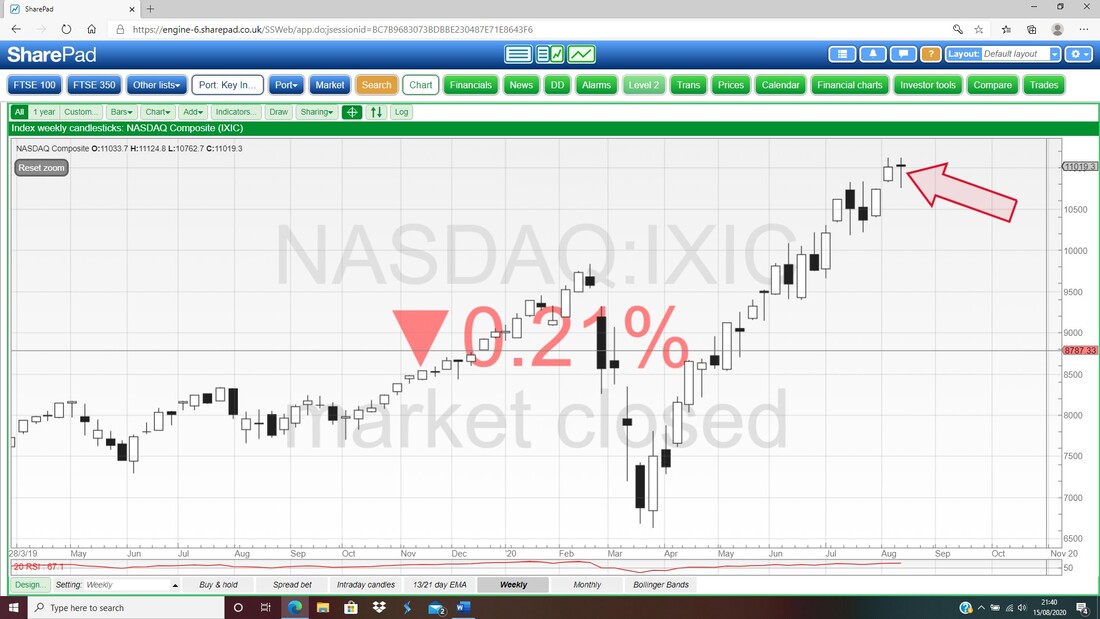
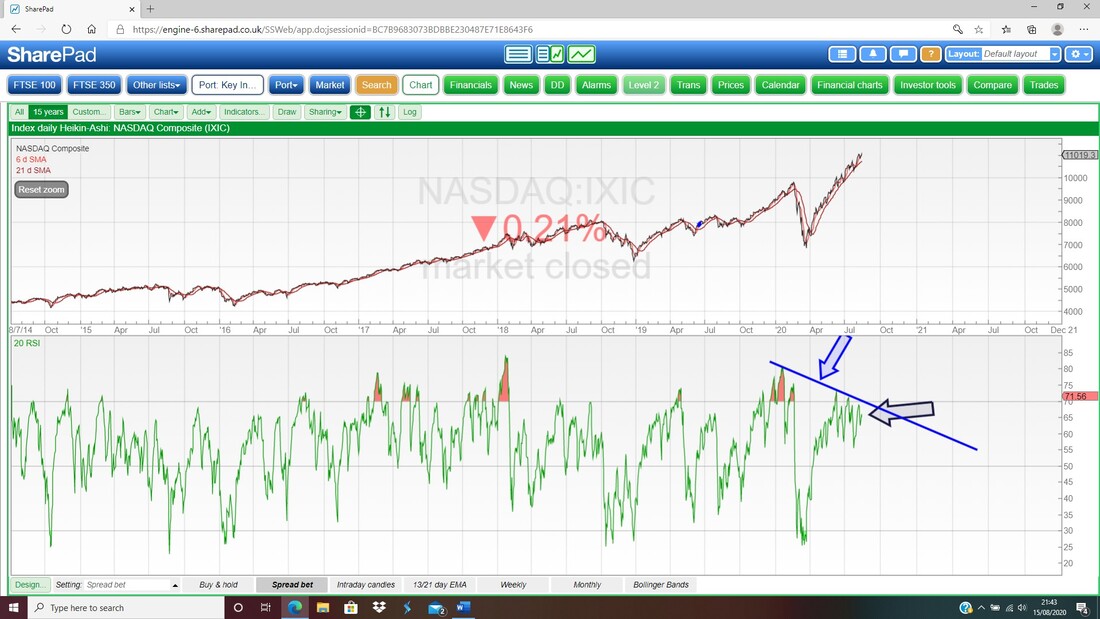
The next Chart is interesting. In the bottom window we have the RSI for the Daily on the Nasdaq Comp and in last weekend’s Charts Blog I showed the Blue Line with the Blue Arrow which I pointed out was a possible ‘Bearish RSI Divergence’ where the RSI was falling as the Price rose up. Note how that is still playing out and where my Black Arrow is we have a reading of RSI 65 now and it is falling.
FTSE100
First up the Monthly and this ain’t so great. My Red Arrow shows a big Down Candle for July and this came off a Bearish Shooting Star for June and even the Candle that is shaping up for August doesn’t look pretty !! We need to see how August plays out but this alone is good reason to be cautious. 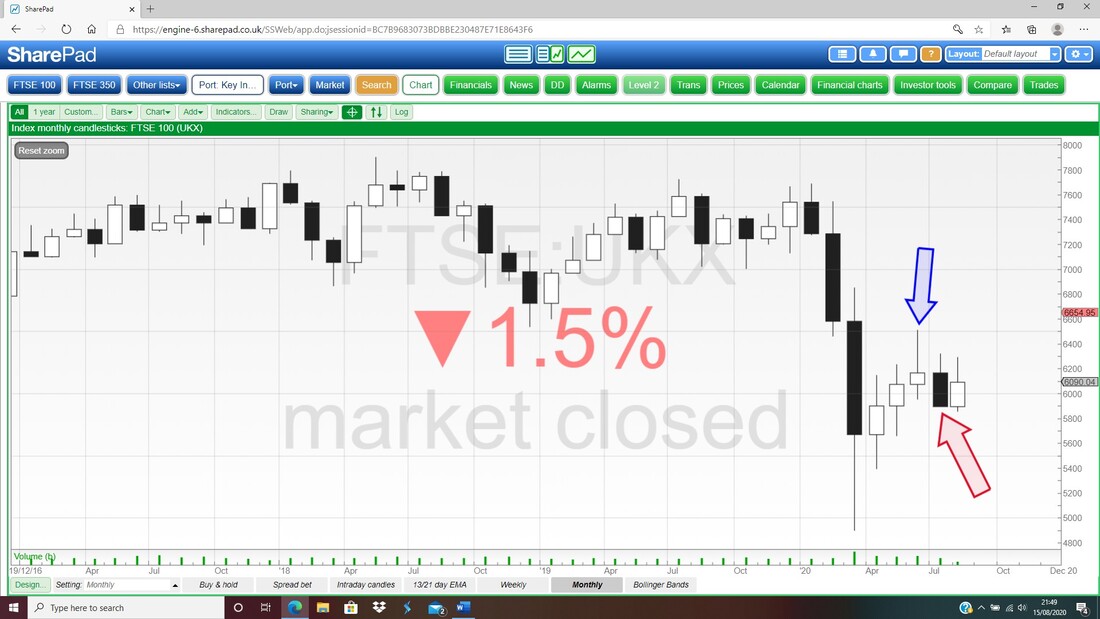
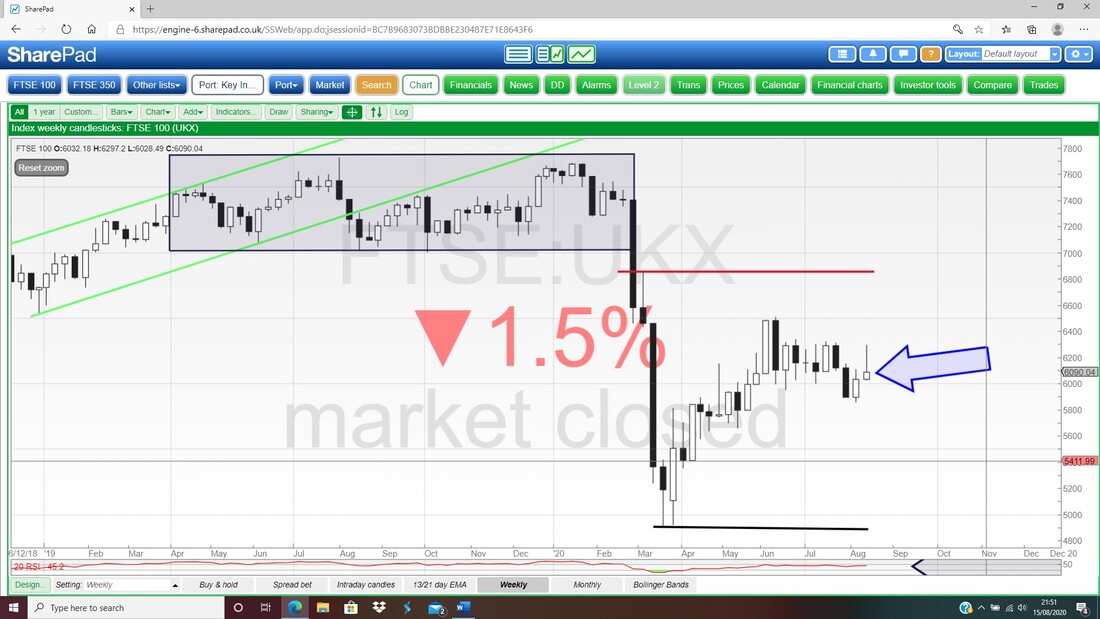
Another problem on the Chart below. My Blue Arrow is pointing to a Bearish Shooting Star for last week on the Weekly for the FTSE100. OK, the context is not all that ‘textbook’ but the inability to hold Highs is never a good look.
On the next Chart we have the Daily Candles and my focus here is really on the 13 and 21 Day EMAs. Where my Black Arrow is we had a ‘Bear Cross’ and if you look closely where my Green Arrow is, we were nearing a ‘Bull Cross’ where the Black 13 Day EMA crosses over the Red 21 Day EMA, but it looks like they are just going to miss (that is Bearish).
My Blue Arrow is pointing to the recent Low at 5857 and this is my Trigger Point to go Short more if that fails in a convincing manner with a Close below it. Right, I have probably scared you all enough now so I am finishing here. As usual in the coming week I will no doubt be Tweeting out how I am seeing the Indexes every night around 10.15pm or so. Good luck for the coming week and remember to stay calm and plan ahead carefully. Cheers, WD. 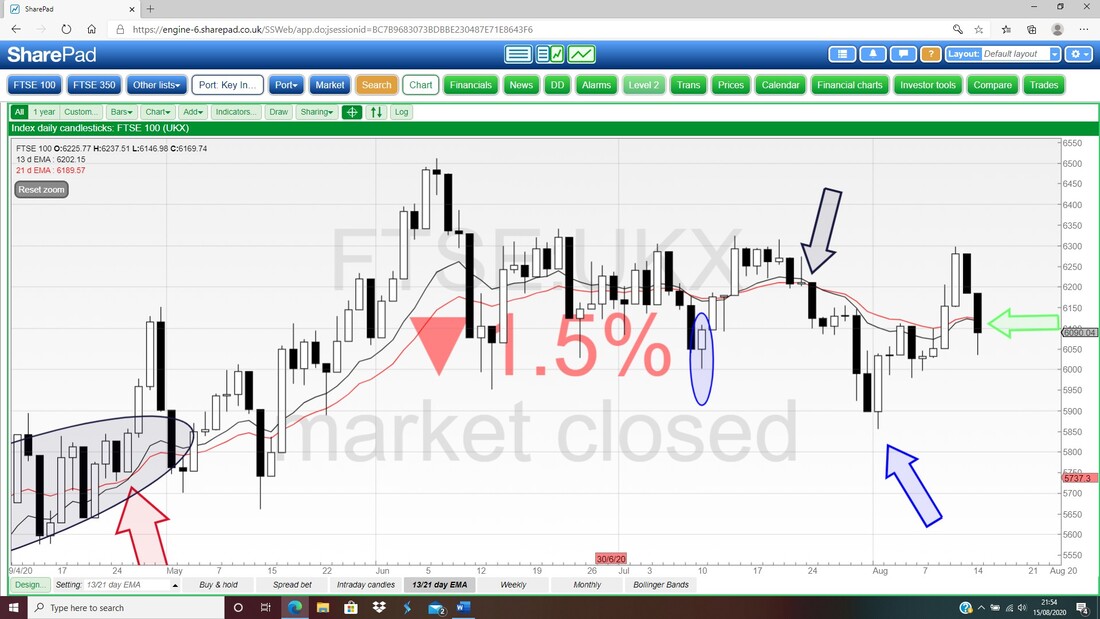
2 Comments
Lee
8/16/2020 04:54:39 am
Another great read, thanks Wheelie. I'm starting to understand your blogs more now rather than skimming through wondering what the hell you are talking about with RSI & 13/21 day EMA's etc :-) Looking forward to the blog about how you time Buy Trades.
WheelieDealer
8/23/2020 11:24:00 am
Hi Lee, Thanks for the feedback and great to hear it is starting to make a bit more sense !! (maybe you could explain it to me LOL). Leave a Reply. |

Stocks & Markets WheelieBlogsThese tend to be more Markets and Stocks related and timely - the Blog Page on the Main WheelieDealer Website has the 'Educational' stuff (well that's the theory anyway !!). Archives
October 2021
Categories
All
|
