

|
stocks & Markets blog |
|
I’m typing this starting text on Sunday afternoon after writing all of the Charts bit on Saturday night. I’m well pleased that I did it this way because I was feeling pretty good last night, but today it is not too bad but definitely worse than I would like.
If you are a bit behind, I have had some sort of problem in my abdomen area for 6 months and 4 Doctors have been baffled as to what the problem is; until finally a trip to A&E when I felt extremely bad a week or so ago, came up with the idea that it could be down to excess Stomach Acid burning my Stomach Wall. Sounds horrible.
Unfortunately, the only easy way to figure out if this diagnosis is right, is to crack on with the ‘solution’ and hope that after a few weeks everything gets better. It seems like a patchy improvement at the moment with me feeling pretty good some afternoons but at other times it still stings a bit.
I have been given the drug Lansporazole and have to take one pill every morning. Then I need to radically improve my diet – cutting out rich and fatty foods and all the Junk and in essence just eating Fish and Vegetables !! On top of this, there is no Tea & Coffee (apparently caffeine is a problem) and I am pretty much drinking water and mint tea if I get really bored with it. I tell you, if the Stomach problem doesn’t finish me off, then the tedium of the diet will definitely be the end of me. I blame Lockdown for driving me to wicked ways with Chocolate, Cake and Peanuts by the hand full. I’ve got to go to Stoke Mandeville Hospital on Thursday for an MRI Scan and hopefully that won’t spot any significant problems, and ‘simply’ adjusting my diet and taking the pills for a while will sort it out. After 6 months of pain, I really could do with feeling ‘normal’ again. As I mentioned, I am not feeling great now so I need to write this quickly and do the proof read and then get the Blog uploaded to the Website. I will just bung a few things in quickly. Last Week My Portfolio got hit 1.9% which is a bit painful. Much of that damage was down to On The Beach OTB which got hit because of the fears around which destinations in Europe will actually be open this Summer and because OTB themselves extended their ‘No Sale’ window. I am still a bit cautious as May and June can be a bit iffy and this could be exacerbated by the incredible run up that Stocks have had. There definitely seems to be a lack of enthusiasm for Tech now which really wouldn’t like Inflation and potential Interest Rate rises and this turns the focus more onto old-fashioned Stocks in traditional industries. I am cool with this because I hold a fair bit of Tech but I certainly hold plenty of traditional Stocks that are looking decent value – even after the big gains. As I mention in the Charts bit, I have a tiny Short Position on the FTSE100 but it is so small it is quite immaterial. However, if Markets move up strongly it won’t cost me much to close it out and if Markets start to look bad, then I can add to it. I might even Short the S&P500 instead or as well. Podcast TPI 48 This week we should get down to recording a New Podcast, TPI 49, (strewth, we have nearly done 50 of these !!) and that will be out next weekend. In the meantime, the most recent one is obviously TPI 48 and you can hear it on Soundcloud here: https://soundcloud.com/user-479955511/conkers3-wheeliedealer-48-spreadbetting-dogecoin-doge-aal-brwm-dgoc-shi-fdm-itv-glen And you can hear it on YouTube here: https://www.youtube.com/watch?v=83OsC8km-Ak As always you can find the ‘Twin Petes Investing’ Podcasts on pretty much all the big platforms, and you will find them at the ‘Conkers Corner’ channel on the likes of Apple, Audioboom, Spotify, YouTube, Overcast, Google+ and probably a few others. You can shout at that Alexa thing as well to find it. You can also go to the ‘Twin Petes Investing Podcast’ page on my Website WD2 and there are all the details there and these sort of nifty ‘widget’ things which allow you to play the Podcasts directly from my Website page. FTSE100 I will start with the FTSE100 purely out of selfish and unscrupulous self-interest, because I have a tiny Short Position on it (see my ‘Trades’ page on WD1) and I want to get some insights into what I should do with this Short. Thinking about it recently, I might do another Short using the S&P500 if I see a need to – it should have some influence from the Nasdaq but not so much to be hugely choppy and volatile like the Nasdaq can be at times. I am also starting with the FTSE100 because I am typing this bit on Saturday Night and I don’t know how long my stomach problems will feel ok and allow me to type. If this is cut short you will know why. I want at least to analyse the FTSE100 even if I cannot manage anything much else. All the Charts I show are taken from the excellent SharePad software I use and if you click on the images then they should get a bit bigger on your screen (I recommend you read these Blogs on a big screen rather than just a Fone – there is a lot of detail to be seen). If you fancy using SharePad or ShareScope yourself, then you can get 1 month’s Free Data if you go to the ‘Subscribe’ page on their website and then select the Product you want, and then you should see a ‘Promo Code’ box and if you type ‘twinpetes’ into that box, then the discount will apply. You can also get this by clicking on the Adverts that are all over my websites. I get a small payment for introducing you, so thank you very much !! (it’s just a shame I can’t spend it on beer at the moment…..) https://www.sharescope.co.uk/ I noticed also that SharePad/ShareScope have updated the landing page on their website and there is much better detail regarding the capabilities and features of their software now. First up we have the Daily Candles and the EMA Lines (Exponential Moving Averages) for the FTSE100. If you look at the Green Arrow, this is pointing to a ‘Bull Cross’ between the Black 13 Day EMA and the Red 21 Day EMA. That is still ‘in force’. This is significant – it tells me that having a Short Position is not the best idea for too long. Experience (by fire and pain) tells me that trading against the Signal from the 13/21 is not a great idea. My Blue Ellipse is marking a Big White Up Candle from Friday and note how this swung up off a Hammer Candle from Thursday and the Low here was 6823, which now becomes very important Support. To the upside, the FTSE100 needs to get over the sort of Shooting Star Doji which my Green Ellipse is marking, and this means Resistance at 7164. From this Chart alone, you could easily conclude that things are great and the FTSE100 can keep on rallying. It may well do that, but we need to look at some other Charts to really get a good steer on what is most likely to occur. Remember, Charting is NEVER an exact science and what we are doing here is using Technical Analysis techniques to weigh up probabilities and to determine the most likely outcomes. 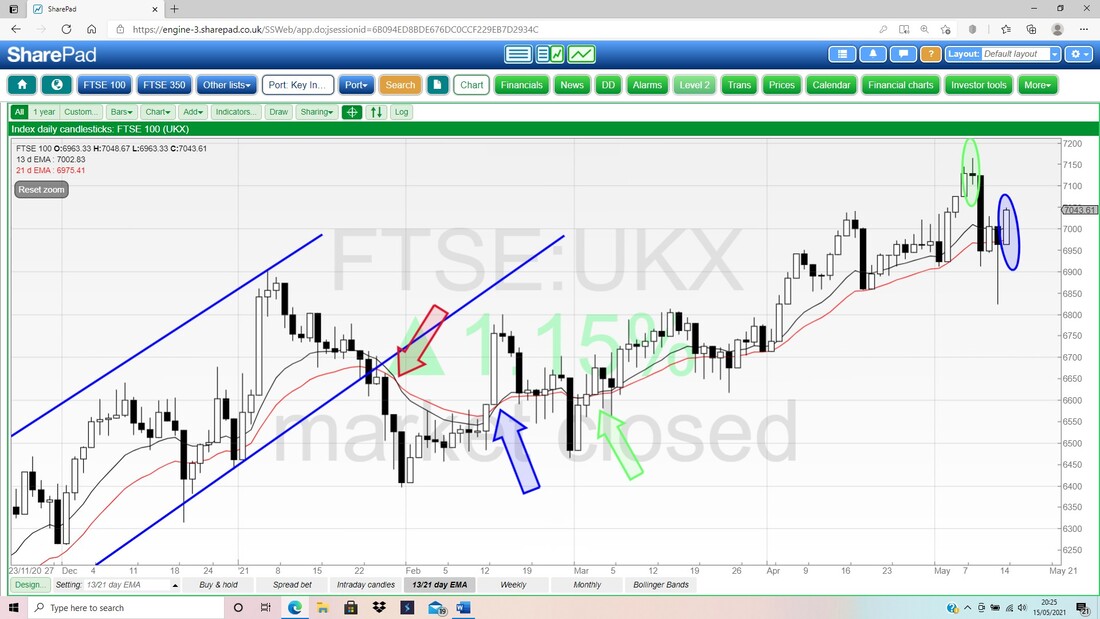
My Blue Arrow below is pointing to a potential ‘Bearish Hanging Man’ Candle from last Week (these are Weekly Candles of the FTSE100) and this could mean a drop back is on the cards. However, the context of this Hanging Man is not great in that a more steep up move beforehand would increase the predictive power of such a Candle.
The Mauve/Pink/Purple Line that I have pointed at with a similar colour Arrow, is meant to mark a potential Support Line and I showed this Line a few weeks ago firstly. If you imagine a parallel Line to this up above, then that would form an Uptrend Channel, and on that basis, we could be up at the top of such a Channel. My Black Rectangle marks a potential Resistance Zone and my Black Ellipse marks potential Support. 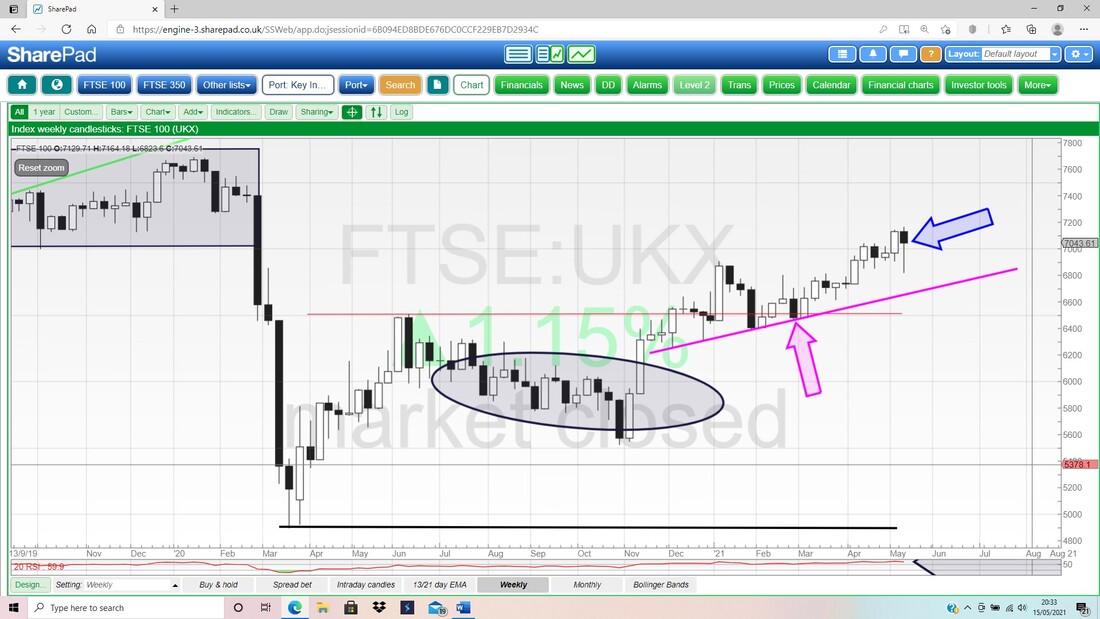
In the bottom window on the Screen below, we have the RSI (Relative Strength Index) for the Weekly FTSE100. My Black Arrow is pointing to a level of RSI 60 which doesn’t seem all that high by the standards of many other Asset Classes and Timeframes. However, if you look to the left you can see that in the recent past, the FTSE100 has actually turned down from such levels, or at least gone sideways.
For the avoidance of doubt, I cannot know at all and this is purely guesswork, but my working assumption is that if we do get a Fall it will not be too extreme and it is likely more a precursor to a Sideways Move where we meander up and down in a Sideways Range for a few months. That would be no shock in the usually turgid Summer period and after such strong moves up in the Markets. 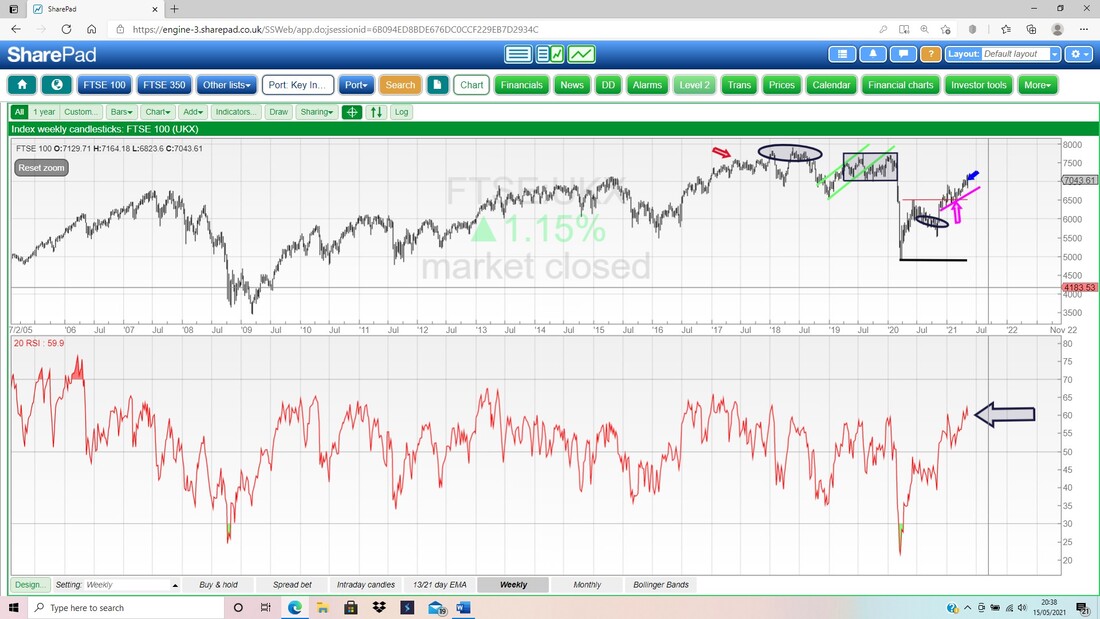
In the bottom window below we have the RSI for the Daily FTSE100. On a reading of RSI 57 this is not at all high and is no impediment to the FTSE100 rising more.
In the Upper Window on the Screen below we have the Daily Candles for the FTSE100 and the Pink Zone marks the Bollinger Bands. My Blue Arrow is pointing to that White Up Candle I showed earlier, and note it has got above the Red Bollinger Midpoint Line (Red Arrow) and that is a good achievement. The Upper Band is at 7160.
In the Bottom Window we have the Volume Histogram Bar things and my Black Arrow is pointing to the Volume from Friday. Bulls want to see a big increase in Volume on an Up Day but in this case the Volume is pretty light. However, Volumes are often low on a Friday so we cannot give a huge weighting to this potential Signal. Note on the Thursday when we got the Hammer Reversal Candle, the ‘Tail’ of the Hammer went below the Bottom Bollinger Band during the sell-off in the morning. Such moves outside the Bands can often be useful Trading Signals for the Day Trading mob. 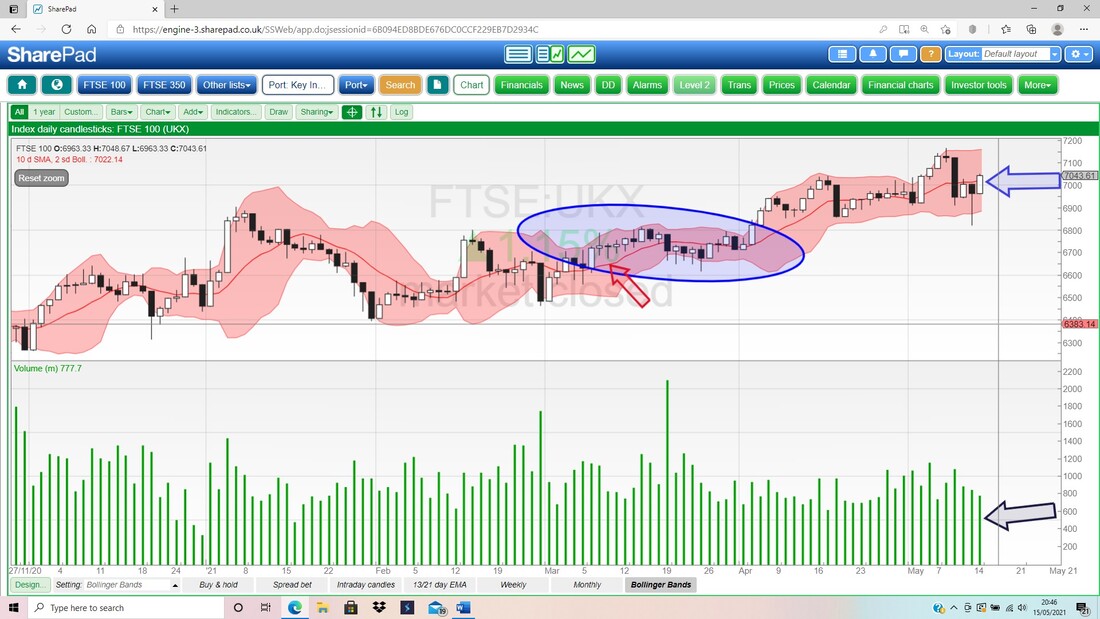
Brent Oil Composite
This one has quite an influence on the FTSE100 so I wanted to get a peek at it. Below we have the Daily Candles for Brent Oil Comp and my Black Arrow is pointing to a Bull Cross between the Black 13 Day EMA Line and the Red 21 Day EMA Line. This is still very much in force and suggests the Price of Brent Oil Comp can go higher. My Red Arrow is pointing to a decent White Up Candle from Friday and there is clearly strong Resistance around $70 (not least because it is a psychological number) and if it can get through this then it needs to crack $71.4 from where my Black Ellipse is. To the downside, there is Support at $66 and $64. My Green Ellipse marks a nice Zone of good Support. 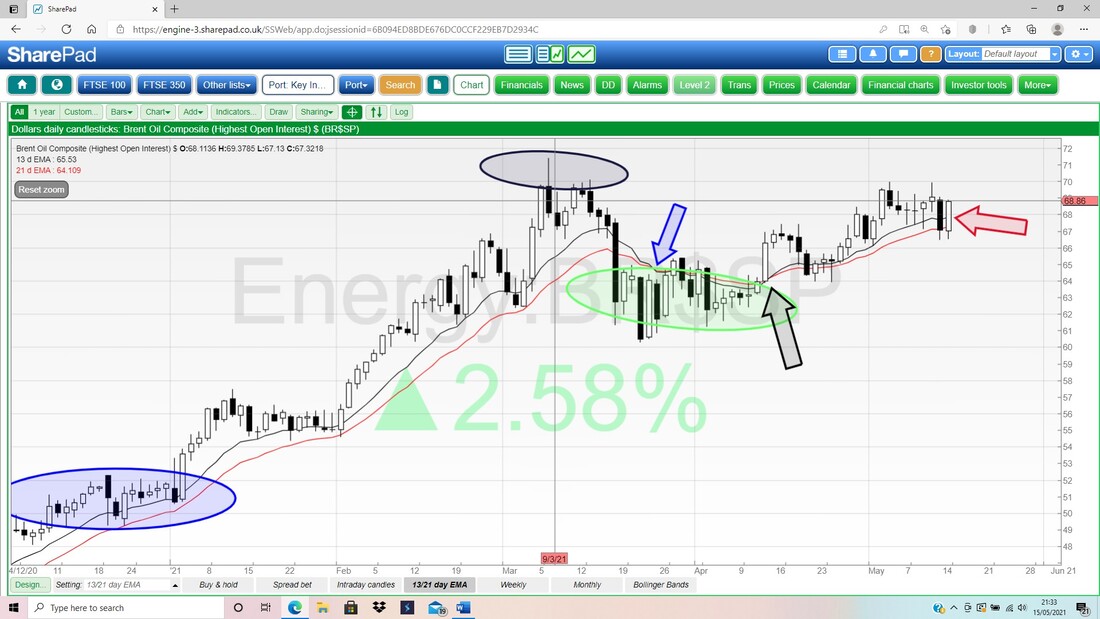
S&P500
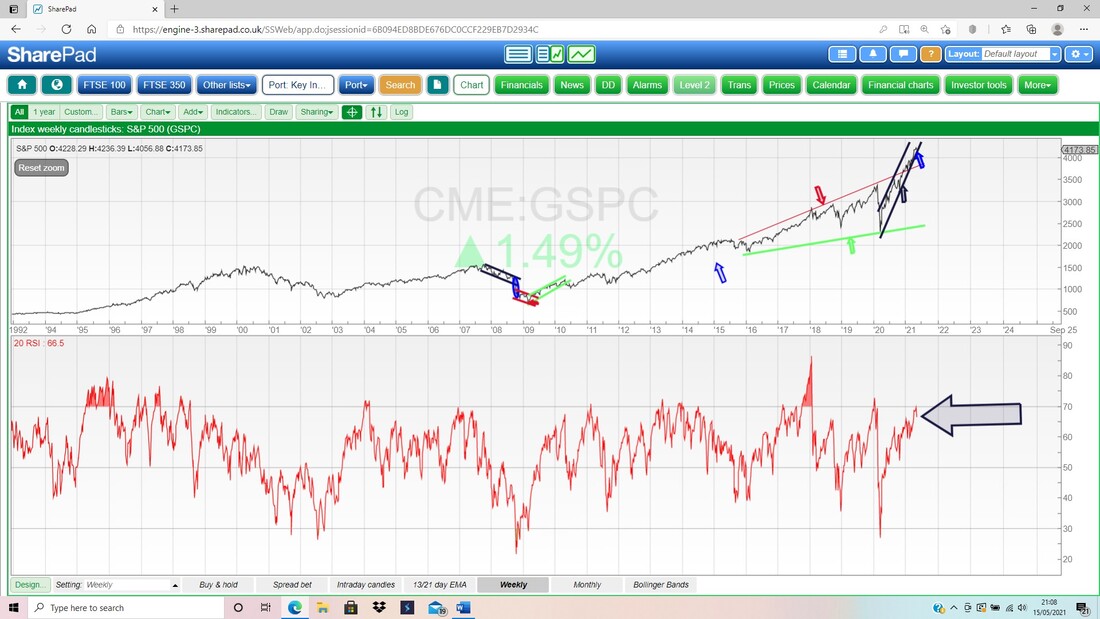
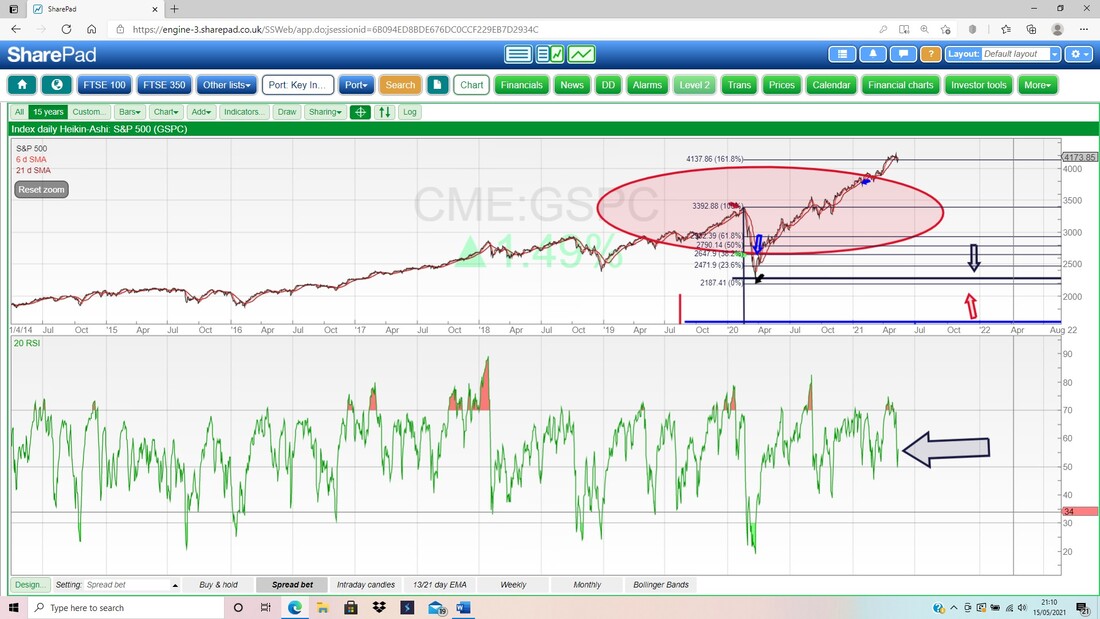
Firstly the Weekly Candles. My Blue Arrow is pointing to a potential ‘Bearish Hanging Man’ from last week but it is not a great example, and therefore may not be all that predictive. The Low of last week was at 4056 and this must hold as Support and the High from the previous week is 4238 which is also the All Time High (ATH) and needs to be got through. My Black Arrow is pointing to the Bottom Support Line of an Uptrend Channel and the S&P500 got near this last week. It is quite difficult to draw this Line – you can move it just a little and it looks like the Candle from last week was a nice fit with the Uptrend Channel. No matter, it is just something to be aware of and whatever happens, we are in trouble if that Support Line fails badly. 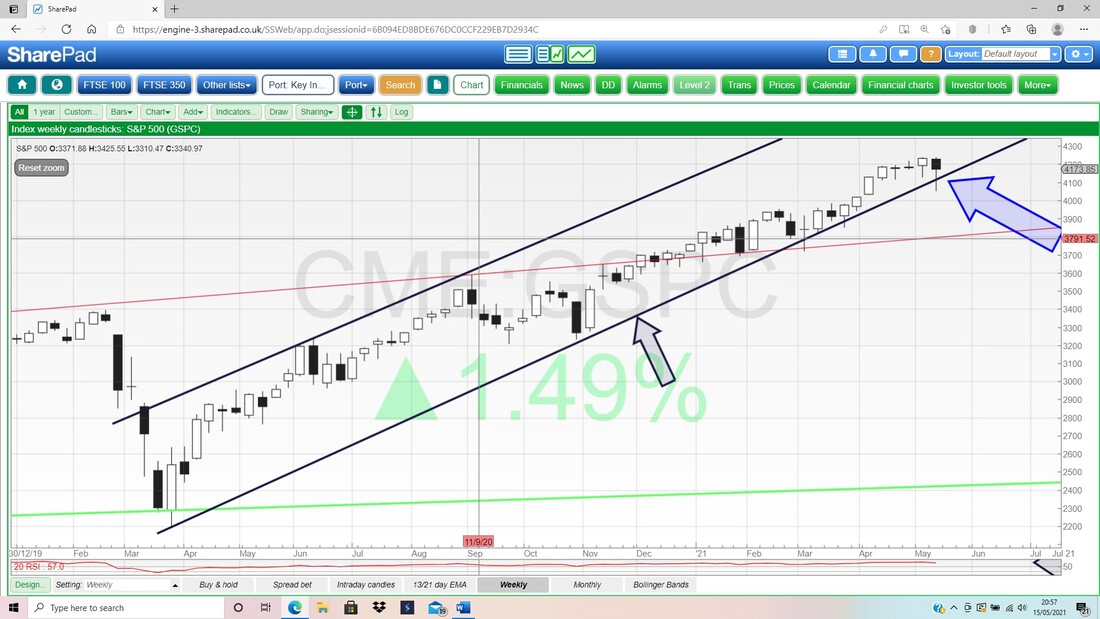
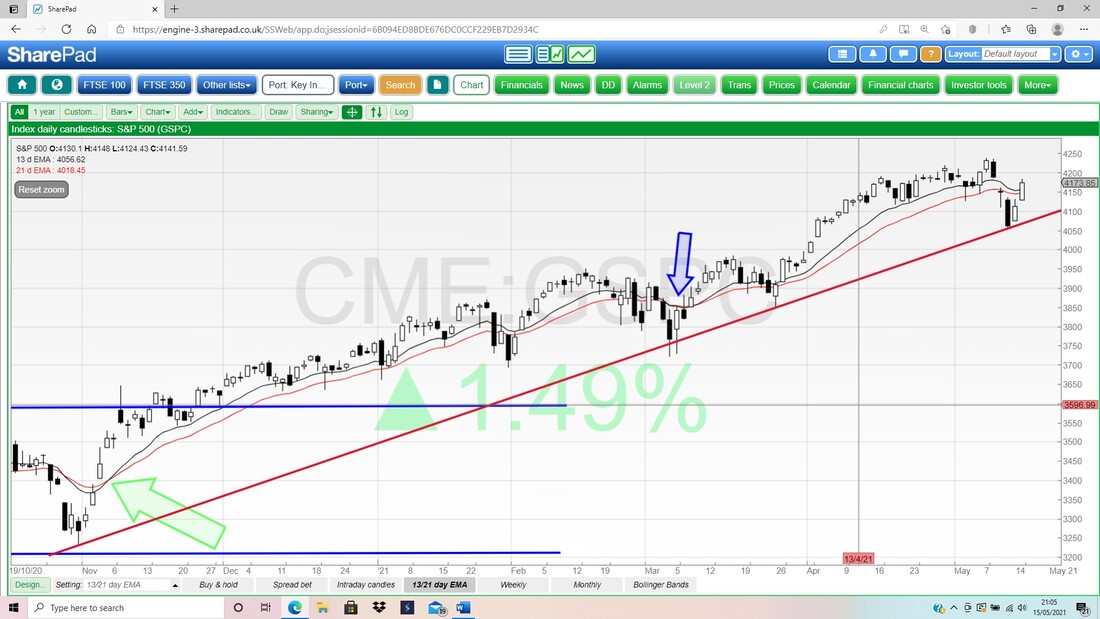
On the next Chart I am interested in the Black 13 and Red 21 Day EMA Lines. We had a Bull Cross back where my Green Arrow is and then where my Blue Arrow is the Lines got very near one another but barely crossed over, and it looks like we might get a repeat of this. That would be a good thing for Bulls.
In the bottom window on the Screen below we have the RSI for the Weekly S&P500. On a Reading of RSI 66 this is pretty high and we could easily see the S&P500 drop back a bit to unwind this high RSI level or perhaps go Sideways for an extended period.
Next in the bottom window we have the RSI for the Daily S&P500. On a Reading of RSI 56 this is around the Neutral 50 level and suggests the S&P500 is not overbought, nor oversold in any meaningful way.
Next we have the Daily S&P500 Candles and the Bollingers. My Blue Arrow is pointing to a nice White Up Candle from Friday and this looks quite promising. However, it only just sneaked above the Red Bollinger Midpoint Line (Red Arrow) and this could mean it runs out of puff very soon. It is vital to keep pushing up.
My Green Ellipse is marking a ‘Bullish Harami’ 2-Day Candle Pattern from Wednesday and Thursday, and look how this predicted the move up on Friday (I hope I spotted this on any Tweets I sent out Thursday Night !!). The High of Friday was 4183 and it must get above this, and then we have the All Time High at 4238 and the Top Bollinger Band is at 4255. To the downside, 4056 must hold as Support. 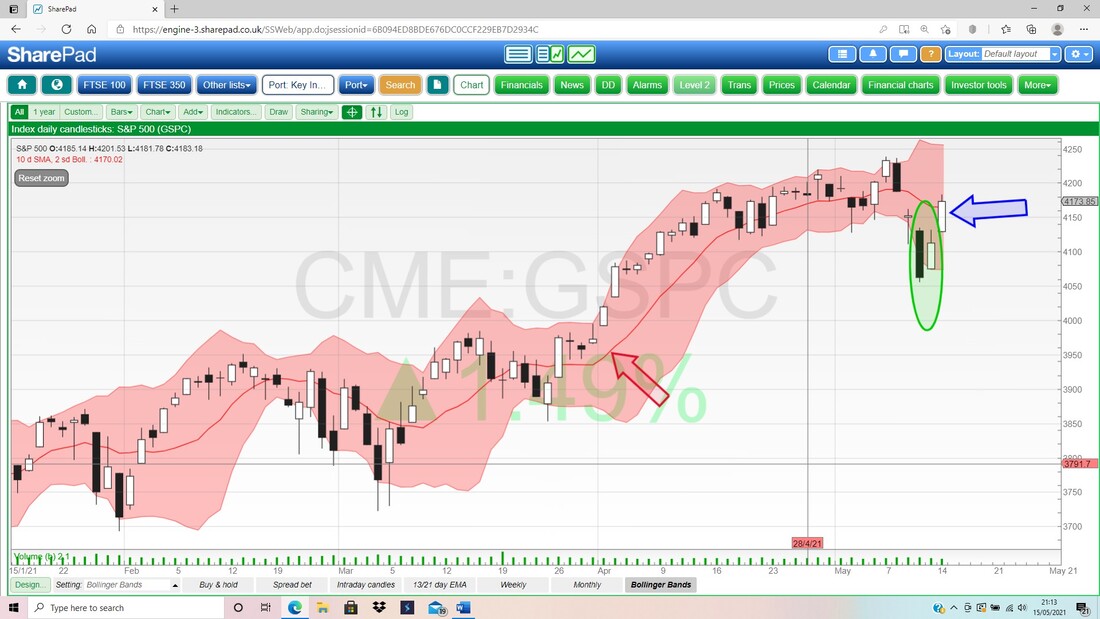
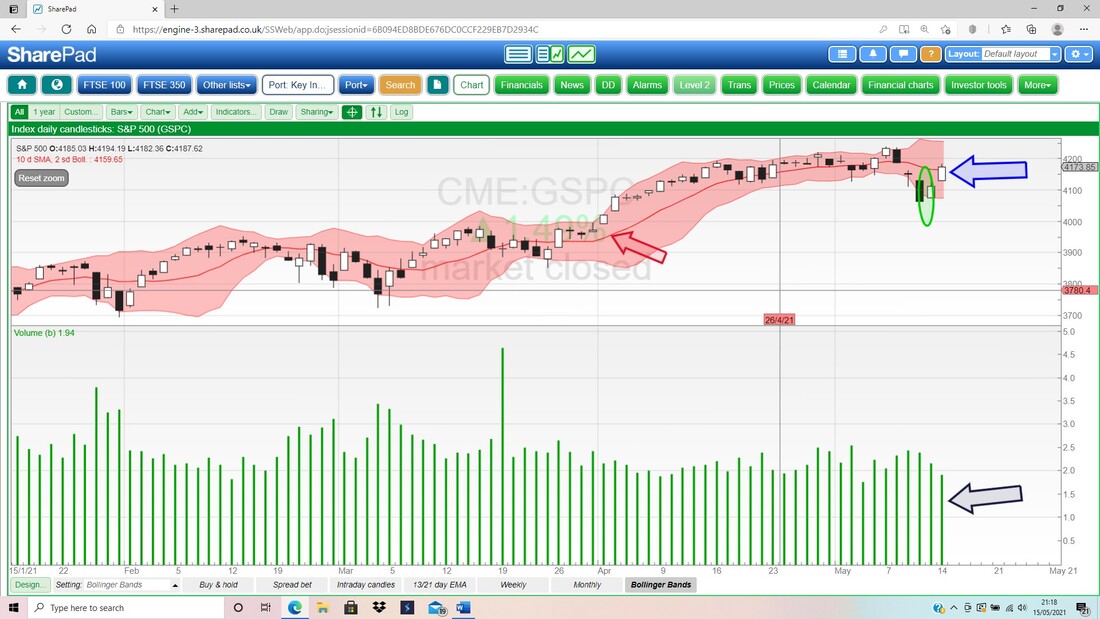
In the bottom window on my next Screen we have the Green Histogram Bars that mark the Volume. Again the Volume for Friday was pretty unimpressive and this is not great for the Bulls. Low Volume shows a lack of serious commitment and it is very plausible that the Bears were just taking a day-off after a lucrative week.
GlaxoSmithkline GSK
I noticed this the other day whilst looking at the tiny Chart on my ADVFN App which I use every day on my Fone. My Chart below shows a Downtrend Channel over about 1.5 years and my Black Ellipse is trying to point out how it might have escaped this Downtrend Channel by breaking out of the Red Resistance Line (marked by my Red Arrow). It needs to Breakout over 1388 which is the Intraday High from 15th April 2021 to really look nicely Bullish. Also look at the Dark Blue Wiggly 50 Day Moving Average Line and the Lighter Blue Less Wiggly 200 Day MA. These are lining up a Bullish ‘Golden Cross’. I hold GSK myself in my Income Portfolio and it clearly faces ‘interesting times’ ahead with the split and suchlike. OK, I will finish things off there. Have a good week and try to get out and about and away from that infernal screen. In return, I will try to keep off them goddamn peanuts !! Cheers, WD. 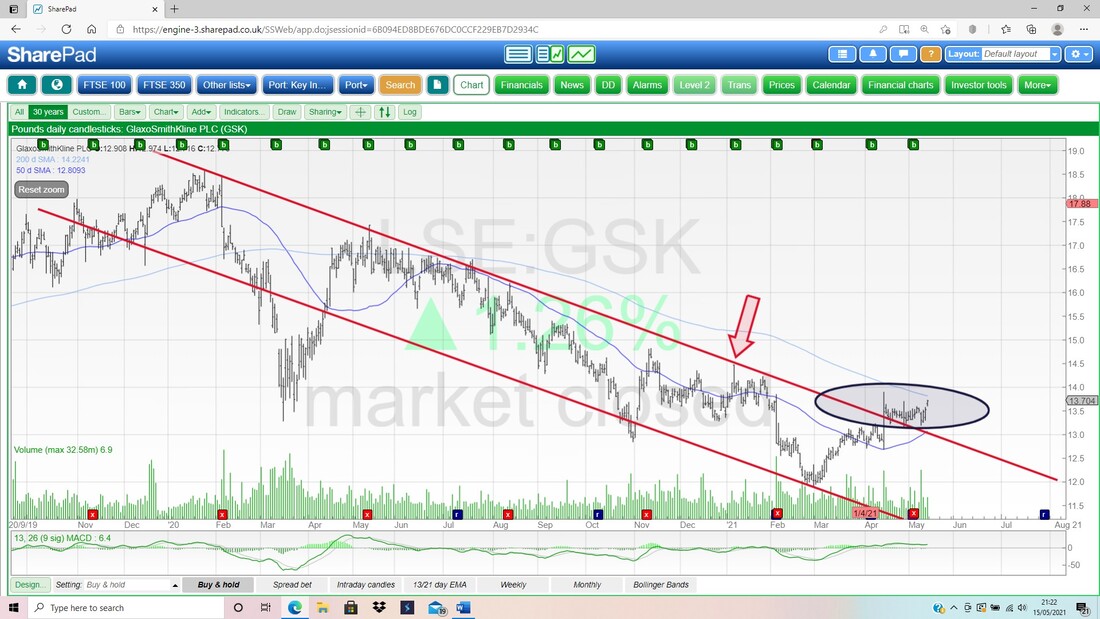
2 Comments
KevinS
5/16/2021 11:19:38 am
Hi Pete, glad you've got a diagnosis (even if its not 100%) and things seem to be on the up.
WheelieDealer
5/24/2021 01:45:42 pm
Hi Kevin, Thanks for the kind words and encouragement. I am most definitely getting better so things are on the up (a hugely welcome relief after 6 months of feeling not right). Unfortunately the MRI which I did last Thursday is unlikely to shed much light on my Stomach issues (I am sure it is down to poor diet) but ideally I should have such Scans done on a reasonably regular basis so it is good to have it in the bag. I have no idea when the Consultant will actually speak to me though. Leave a Reply. |

Stocks & Markets WheelieBlogsThese tend to be more Markets and Stocks related and timely - the Blog Page on the Main WheelieDealer Website has the 'Educational' stuff (well that's the theory anyway !!). Archives
October 2021
Categories
All
|
