

|
stocks & Markets blog |
|
Peter C3 and myself had been planning to have a ‘Guest’ on an episode of the infamous, award breaking, ‘Twin Petes Investing’ Podcast for ages and never really got around to it; until C3 had this genius idea to coincide with our Xmas output, of having a sort of opportunity for a Listener to appear in a future episode with us.
The basis for choosing who was going to attend was based on a simple Tweet response to explain why the Listener enjoyed Investing, and then we looked through the responses and chose one that stood out for the deep meaning within it and the simplicity of the message. Anyway, we had never spoken to Ryan before (although we have both interacted with him textually on Twitter) and of course we ran a huge risk of picking someone who really wouldn’t make an enthralling episode.
So you can imagine how pleased we were once we got stuck into recording the Podcast on Wednesday evening and we were totally blown away by how engaging and inspirational Ryan turned out to be. It was hugely enjoyable to interact with someone who is reasonably new to Investing, but who has clearly put in a lot of focus and determination to learn how to make money and control risk and he clearly has a passion for the great game. I recommend that any younger Readers/Listeners make sure they take the time to listen to what Ryan has to say, and I’m pretty sure anyone who listens to the Podcast will be able to relate to what Ryan has been through and the journey he is undergoing.
I find it particularly pleasing to talk to a younger chap who is committed and dedicated and prepared to put in the hard yards to ultimately make his Family’s and his future much more pleasant. Needless to say, I talk to countless numbers of newer Investors and Traders and there is nothing more frustrating for me than those who won’t put in the effort and who want the rewards but are not prepared to work for it. You have to be 110% committed or you will not succeed. You can find Ryan on Twitter at @illgetugadget which I’m guessing has some connection to Dick Dastardly !! You can hear the latest Podcast TPI 40 here and as usual it has all the normal educational and stock stuff with the addition of the segment with Ryan in the middle: https://soundcloud.com/user-479955511/conkers3-wheeliedealer-40-isa-millionaire-twlo-ihcu-kgf-slp-av-jmg-fran-stem-sap That’s on the Soundcloud Platform but you can find TPI 40 under the ‘Conkers Corner’ Channel on loads of other Podcast Platforms like YouTube, Spotify, Apple, Overcast, Audioboom and plenty of others. If you talk to Alexa or Siri or say “hey google” or whatever you use, you can probably find it by that method as well. I have used that myself several times. Last Week After the booming start to 2021 I guess it was only to be expected that we would need to give a bit back and I was very pleased to get to Thursday with my Portfolio pretty much unchanged; but then that all fell apart on Friday and I ended up down 0.7% for the week. It is not too bad just a bit irritating when I have got used to seeing my Portfolio just keep nudging up !! As always, I will look at the Charts later in this blog, but as I see it the Price movements of last week have just been a necessary Consolidation after the Markets had got overbought (and highly overbought in some cases) and we needed to see some of the ‘heat’ come out before we can keep moving on up. No doubt there will be a proper Pullback at some point soon, but I doubt that will happen until maybe later in February or in March/April which are historically the time for a bit of a drop. I am obviously watching the Index Charts intently and looking for indications that a big drop is coming, but as it stands there is nothing that is getting me concerned. It is worth bearing in mind also that it is Martin Luther King Day on Monday and the US Markets are shut, and that in itself could have contributed to the negativity on Friday; a mate told me it was the Options Expiry day on Friday also which can cause some gyrations. So my Strategy remains the same as usual – I am pretty much 100% Invested and looking for a need to Hedge via Index Shorts if I get worried. There are a few Stocks I want to buy more of and I need to focus on getting my Spreadbet Portfolio better ‘mirrored’ to my Share Portfolio – but that is something I intend to make sure happens this year because I am letting ££££s slip away that I could be grabbing. I have some Cash to invest in my Income Portfolio and I am thinking about that also (if you listen to the Podcast then we talk about a specific Stock for this Portfolio.) Something I mentioned to a mate earlier this evening was that I try to keep at the forefront of my mind the concept that in the big picture, Markets tend to rise for 6 Periods (call that Years or Months or something) and only fall for 1 Period. So on that basis, if we are looking to go Short, then the odds are actually strongly against us and we are probably wrong. On that basis, we should only be Short when we have an extremely strong conviction that the Markets are going to take a dive. Shorting Indexes should be used sparingly for Hedging purposes (obviously it is different if you are a Day Trader). Our natural bias should always be to the Long side. Blog Slate Thankfully I seem to be getting over the health problems that have dogged me for weeks and weeks, and I actually managed to crack on with the ‘Scores on the Doors 2020’ blog on recent evenings and it is pretty much finished but needs a good proof read and some tweaks here and there. I hope to nail that by Tuesday Night and I think Readers will find it useful and informative as usual. After I have done that one, my plan is to start on a ‘Buy Rationale’ blog and I might do Lok ‘n Store LOK first and I intend to do Brand Arkitechs BAR soon also. Those will tie me up for many weeks so I have no idea what I will write after that, but I do hope to keep the Weekend Blogs going as usual, now that I am feeling more up to it and can actually sit at my desk and type away without feeling like cr*p. I updated the ‘Little Black Book’ a few days ago which sits on WD2 and that has lots of Ideas for Stock Investments which need more scrutiny. This is an actual copy of the text in the Book I use myself. I also need to sort out the ‘Monthly Performance’ page on WD1 and once I have the ‘Scores on the Doors’ out, I might turn my attention to that page. No peace for a Wicked Wheelie !! Delving in the Dungeons If you look at the ‘Blog Index List’ on WD2 then the full list of every blog I have scribbled in the last 7 or so years is on there and the relevant ones have Links to them so you can click away and read what you fancy. I was thinking earlier today about the importance of running Winners and how the biggest mistake I have made over and over is to sell great Stocks far too early. This made me appreciate the importance of setting a Target and this blog series should help you think about Targets yourself: https://wheeliedealer.weebly.com/educational-blogs/targets-helping-improve-your-aim-part-1-of-3 https://wheeliedealer.weebly.com/educational-blogs/targets-helping-improve-your-aim-part-2-of-3 https://wheeliedealer.weebly.com/educational-blogs/targets-helping-improve-your-aim-part-3-of-3 In the Podcast we also talked about getting an Edge – this Blog is on that subject: https://wheeliedealer.weebly.com/educational-blogs/what-is-your-edge OK, enough of my waffling, let’s check out some Charts……. S&P500 As is the standard way of things, all the Charts I show are Screengrabs from the top notch SharePad Software that I use and if you fancy subscribing yourself, then there are loads of ‘Adverts’ around my websites where you can click on them and you can get 1 month of Free Data. I also get a drink out of it so thank you very much !! If you click on the images they should get bigger on your screen and I recommend you read these blogs on the biggest screen at your disposal. On a Fone it must be very tough to see the detail. As always, it is best to start with ‘Big Picture’ stuff and on the Weekly Candles in my Chart below for the S&P500, my Blue Arrow is pointing to a small Doji Candle from last week and to be honest this doesn’t look worrying to me at all. At worst it might be the start of a small pullback or something but on the evidence here it is not even remotely alarming. Note my Parallel Black Lines which are marking an Uptrend Channel. It is possible that the S&P500 pulls back to the lower Black Support Line and that would mean a move to about 3650 or something. It is not anything over dramatic. 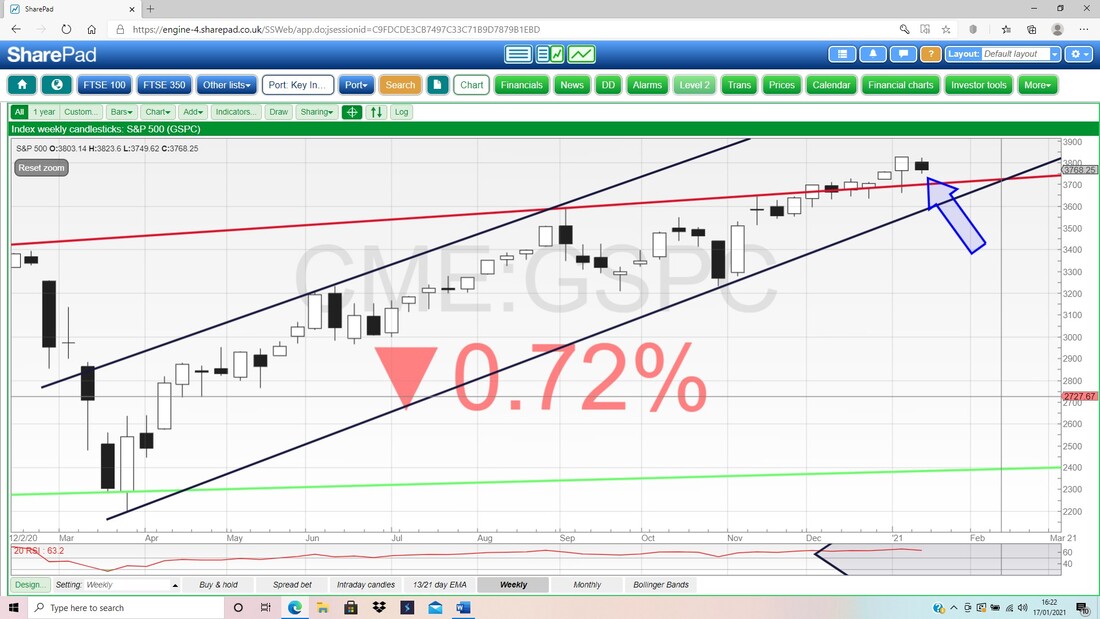
My next Chart for the S&P500 has the Daily Candlesticks and my focus here really is on my beloved 13/21 Day EMA Lines which I find give extremely useful, reliable and timely signals of when the Trend is changing in a very good, or very bad, way.
My Green Arrow is marking where the Black 13 Day EMA Line (Exponential Moving Average – more recent values are given a higher weighting in the Moving Average calculation) crossed the Red 21 Day EMA Line from underneath and this means we are now in ‘Bull Mode’ - and you can see this is still the case (it would end when the 13 Day EMA drops below the 21 Day EMA). My Horizontal Line with the Blue Arrow is marking a strong Support Level at about 3600 and above this there is Support at around 3650. The reality is that this a strong market with lots of good Support not far below if any wobbles do happen. 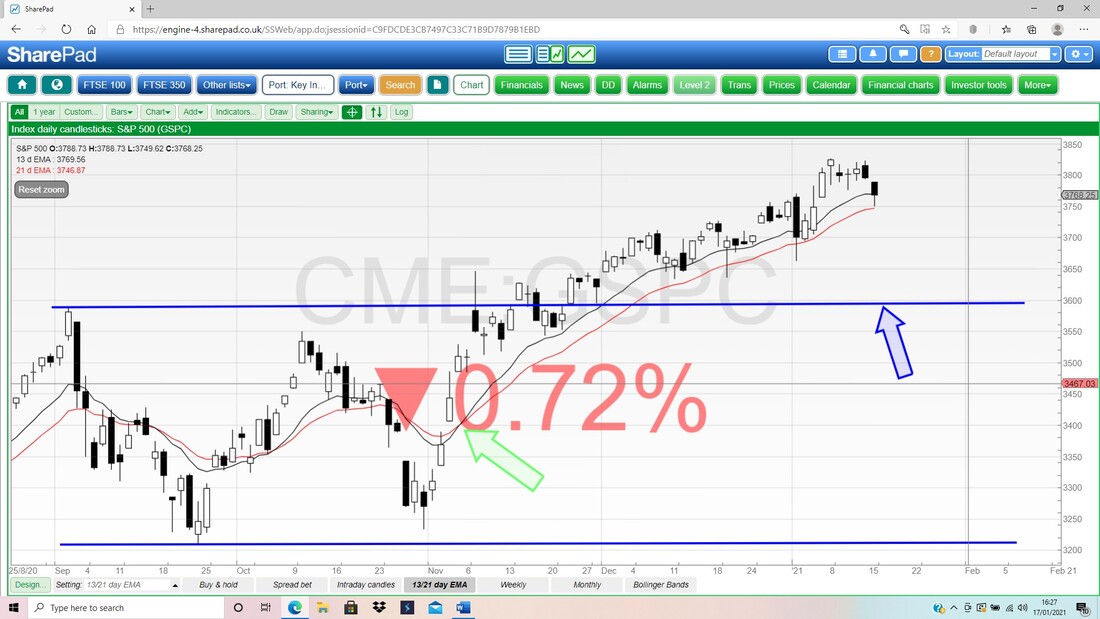
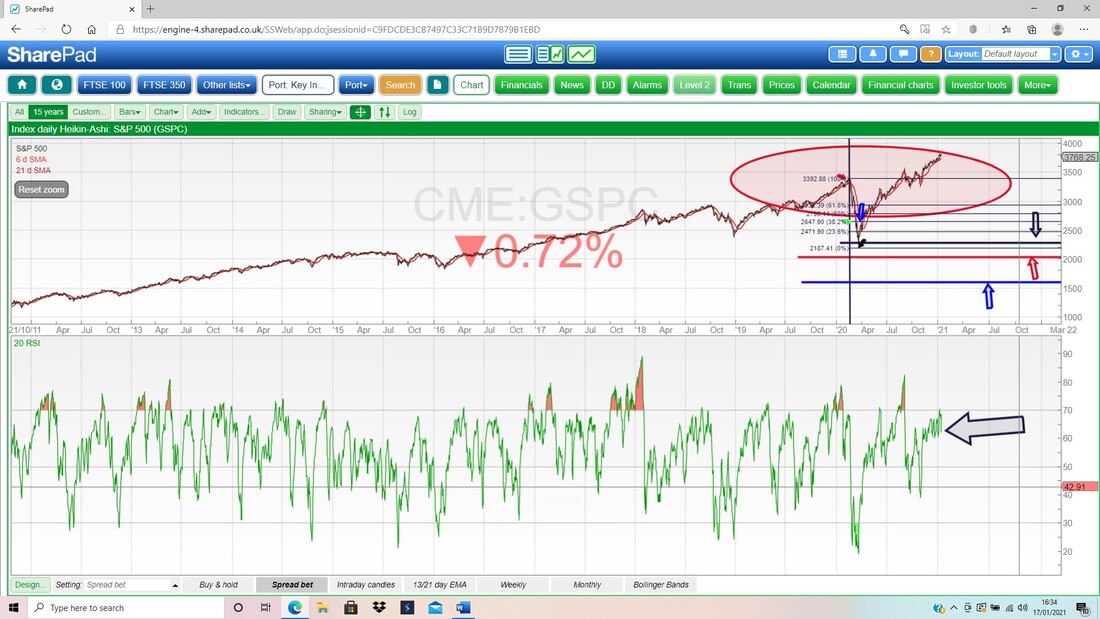
In the bottom window on my next Screen we have the RSI (Relative Strength Index) for the S&P500 Daily. My Black Arrow is rudely pointing at a Reading of RSI 62 and this is not an extreme level although it could drop back a bit more here before we see a rebound. However, other indicators make me think we will rise soon but we shall see.
Finally for the S&P500, my Chart below has the Daily Candlesticks and the Pink Zone marks the Upper and Lower Bollinger Bands (these Bands are calculated based on Standard Deviations but you don’t need to know that, or worry about it !!). My Black Arrow is pointing to where the Market dropped to Support at 3750 on Friday before reversing and Closing a bit higher. The Candle formed on Friday is by no means a classic or pretty Hammer shaped Candle (a Hammer would have a smaller ‘Body’ and a longer ‘Tail’ below) but it is possible that the S&P500 rises off this next week.
My Blue Arrow is pointing to the Lower Bollinger Band which is at about 3700 – this could be Support. Remember the US Markets are closed on Monday for Martin Luther King. 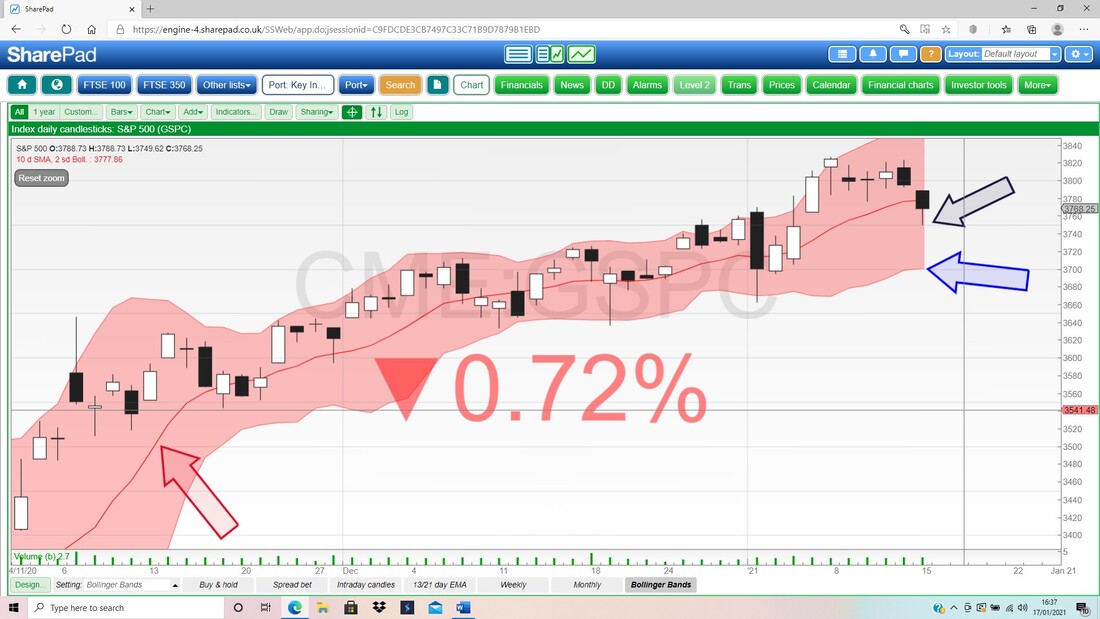
Brent Oil Composite
I’m always interested in what Oil is doing because it has quite an effect on the FTSE100 and the DOW especially and because it tends to be a good indicator of what Stocks and the Global Economy are up to – it is highly correlated with them. I also have a little bit of Oil exposure in my Stocks. On my Chart below we have the Daily Candles for Brent Oil Comp and what I am most interested in here is what those 13 and 21 Day EMA Lines are doing. If you look where my Black Arrow is, you should see we had a ‘Bull Cross’ and look how that predicted an enormous run up in the Price of Oil. At the moment this Bull Mode is still very much in force. My Blue Ellipse is trying to show a Zone of Support from $52 down to about $48 and this suggests that if Oil does drop back, then it will establish its feet again I suspect. My Green Arrow is pointing to a Big Down Candle from Friday and this in itself looks bearish. With the overall generally positive Trend in the Brent Oil Comp Price, I would expect any weakness here to soon reverse and at worst to go sideways. To the upside, there was Resistance established from Wednesday last week at about $57.5. I am not showing it on this Chart, but there is more Resistance at about $60 up to $75 – I will show that in a mo. Be patient you lot !! 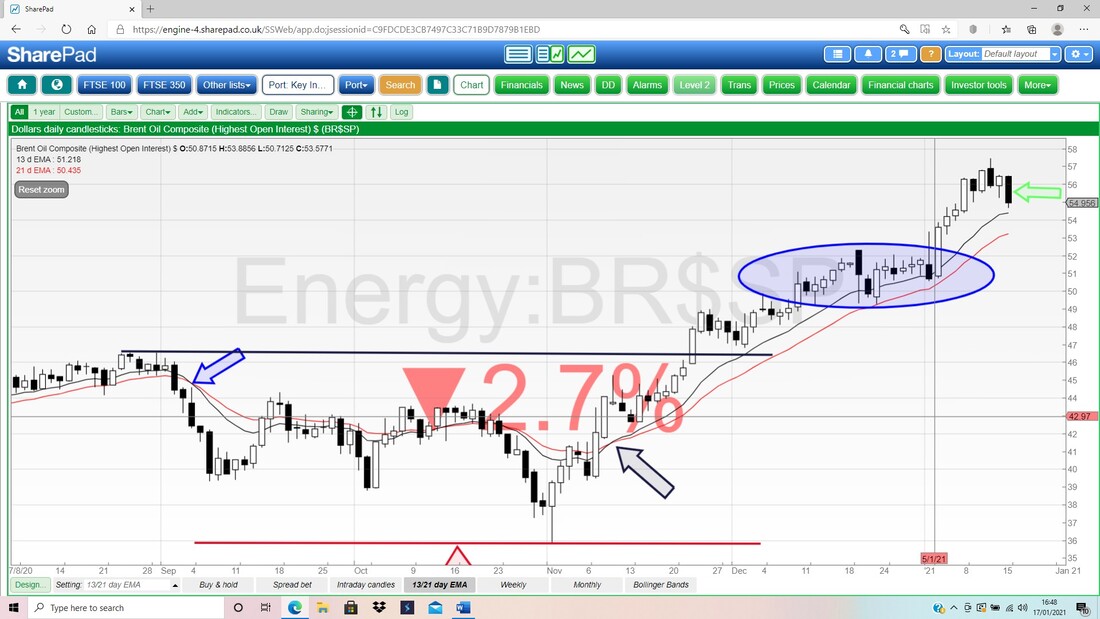
Next up the Weekly Candles for Brent Oil Comp. My Green Arrow is pointing to a Small Doji Candle for last week but it does look a bit Bearish to me and it has a tinge of a ‘Bearish Shooting Star’ with its Long Wick upwards. On this evidence, it looks like we might get a bit of a pullback although as I said before, there is good support not far down.
My Blue Ellipse is marking the Resistance Zone I talked about just now. It is roughly from about $55 to $76. Note also how the Red Resistance Line (I won’t show how this is derived but in the big picture it is just the Peaks joined by a Resistance Line) is coming into play as well. If you have access to a decent Charting Package, then I am sure you can replicate my Line and you will soon see how I got to it. 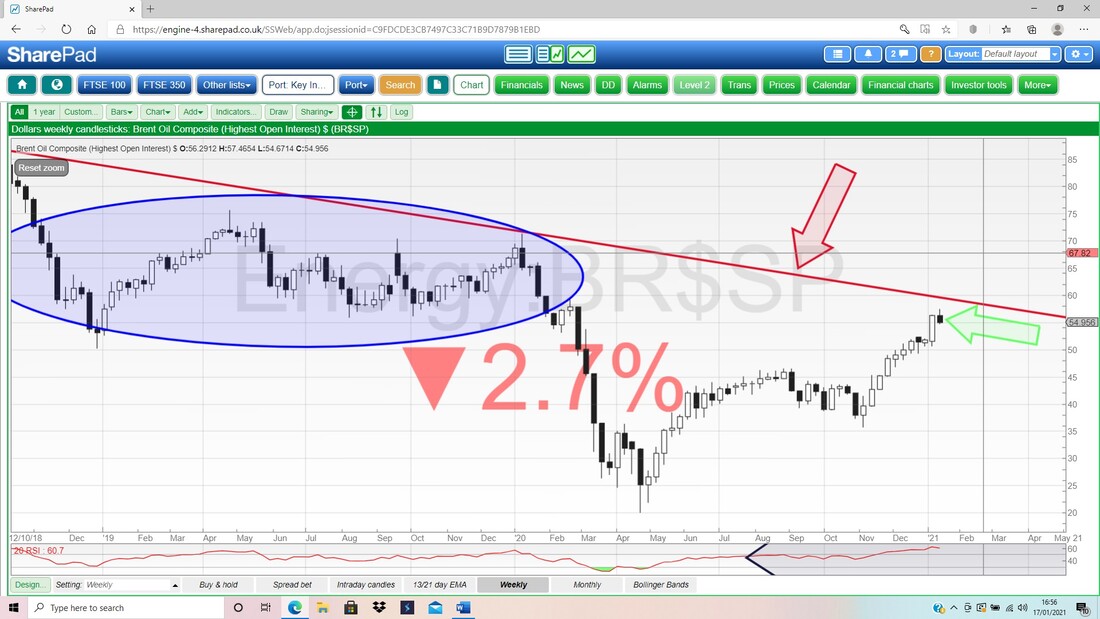
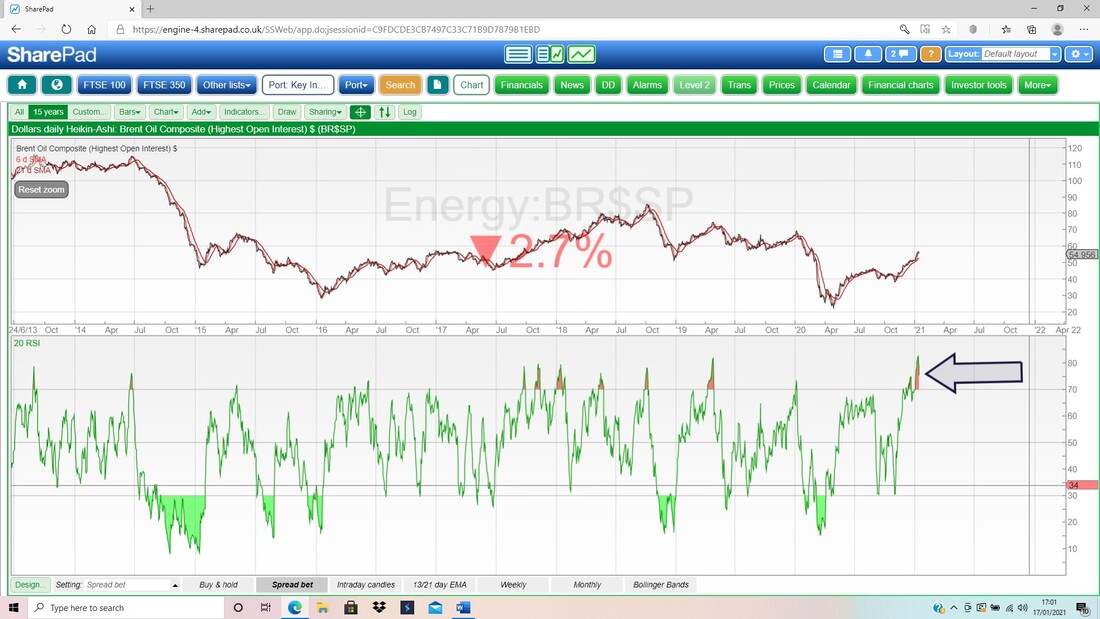
This is another reason for Brent Oil Comp to fall. In the bottom window on my Screen below we have the RSI for the Daily and on a Reading of RSI 75 this is still an extreme Reading and can fall a lot more.
The next Chart might help. This has the Daily Candles and the Bollies and my Blue Arrow is pointing to the Lower Band at $51.50 which may be Support and if you look at the Red Bollinger Midpoint Line (marked by my Red Arrow) then you should be able to see that Brent Oil Closed bang on that on Friday at $55.
An RSI of 75 does not necessarily mean the Price needs to fall but it is an extreme Reading which needs to be unwound. The alternative is that the Price just goes sideways for some time and ‘Consolidates’. 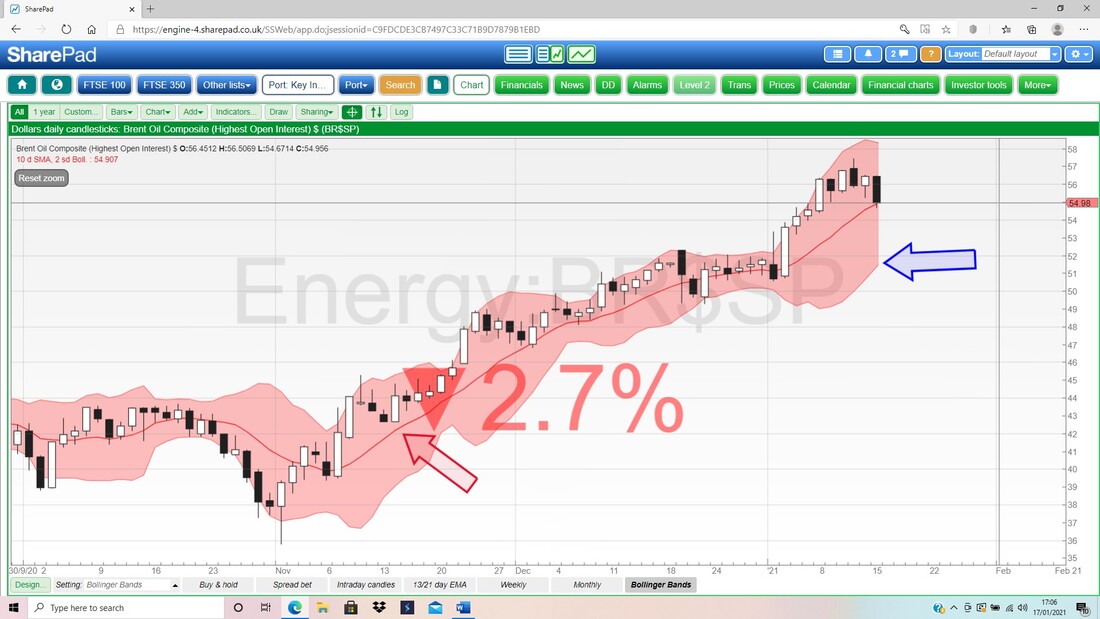
FTSE100
This Chart for the FTSE100 of the Weekly Candles has a lot of useful information contained within it. First up look at my Blue Arrow which is pointing to a Small Down Candle from last week and when combined with the Big Up Candle of the Week before, this looks a bit Bearish to me (‘Dark Cloud Cover’). Support from Friday came at 6676 and below that we have 6460, 6315, 6263 so there is quite a good series of Support to help us out if worries strike. There was a Breakout at my Red Line around 6510 (Red Arrow) and that could act as Support if there is a pullback (“Previous Resistance becomes Support and vicey versey”). Up above my Black Box in the Top Left-Hand Corner marks Resistance from about 7000 up to 7800. In the immediate near-term, a Breakout over 6903 is required. 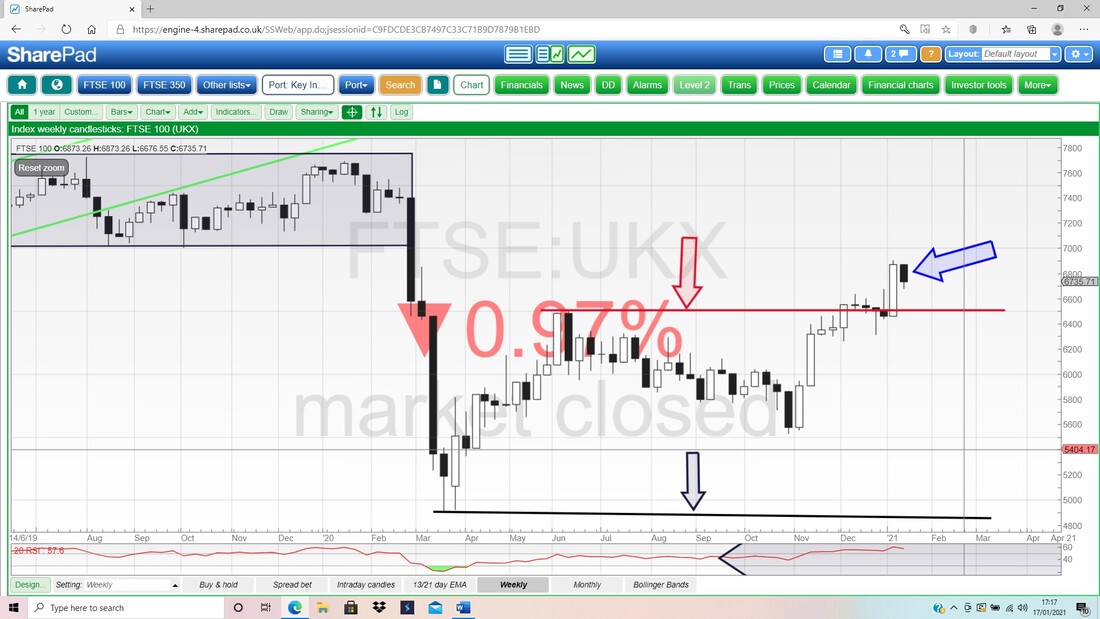
In the bottom window on the Screen below, we have the RSI for the FTSE100 Daily and on a Reading of RSI 63 this is not extreme but it could drop back more. As I mentioned for something else, this doesn’t mean the FTSE100 must drop – it could just perform a load of sideways jiggling to do a Consolidation and calm things down a bit, after everyone got a bit over-excited.
As a general observation, note how yet again when the FTSE100 got overbought (up above the RSI 70 Level) it didn’t take long for weakness to set in and that Level to drop back. RSI is a superb and useful Indicator. 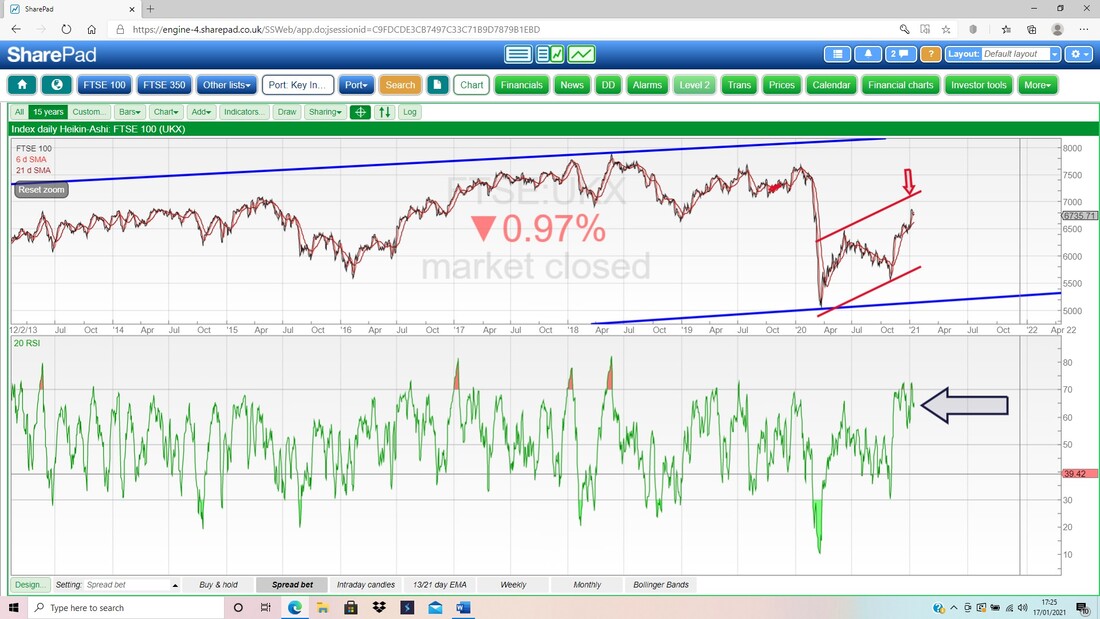
My Black Arrow on the Screen below is pointing to a Bull Cross on the 13/21s and you should be able to see this excellent Signal is still in Bull Mode.
My Blue Arrow is pointing to a Support Line from a possible Uptrend Channel and this suggests there is Support at about 6600. I say “possible” because these are by no means perfect Trendlines. I drew the Top Blue Line with several ‘Touch Points’ so that has some validity, but the Bottom Line I had to do some ‘Line Fitting’ which is not ideal so we need to be careful with what that Line is telling us. 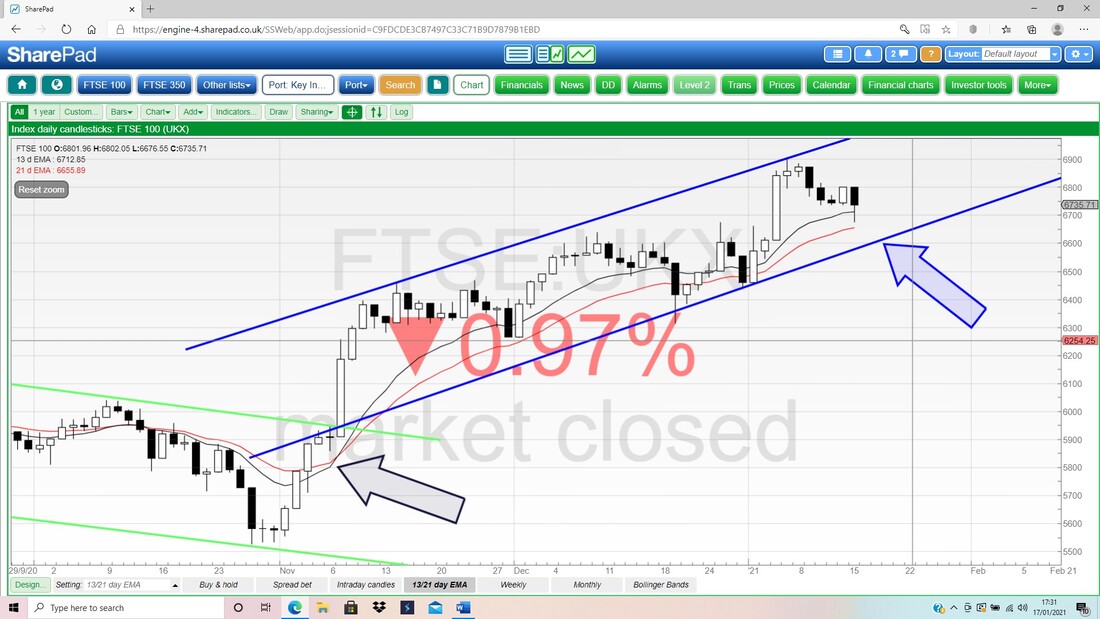
Finally tonight, here is quite a complicated looking Screen but stay calm and I am sure we can get through it !!
I was eager to show the Volume because I had noticed that it has been dropping away lately. This is useful because it suggests the weakness of last week was not backed by a lot of Volume of people aggressively selling. My Black Ellipse in the bottom window is trying to show this, with the Green Volume Bars falling away. Obviously when Volumes are low, we get more exaggerated and unrepresentative Price moves. In the top window, if you can just about see it, you might notice that the FTSE100 Closed on Friday at the Red Bollinger Midpoint Line (as marked by my Red Arrow). OK, that’s it for this weekend – have fun in the coming week and keep sawing away at those Prison Bars with that Nail File – you will be free eventually !! Cheers, WD. 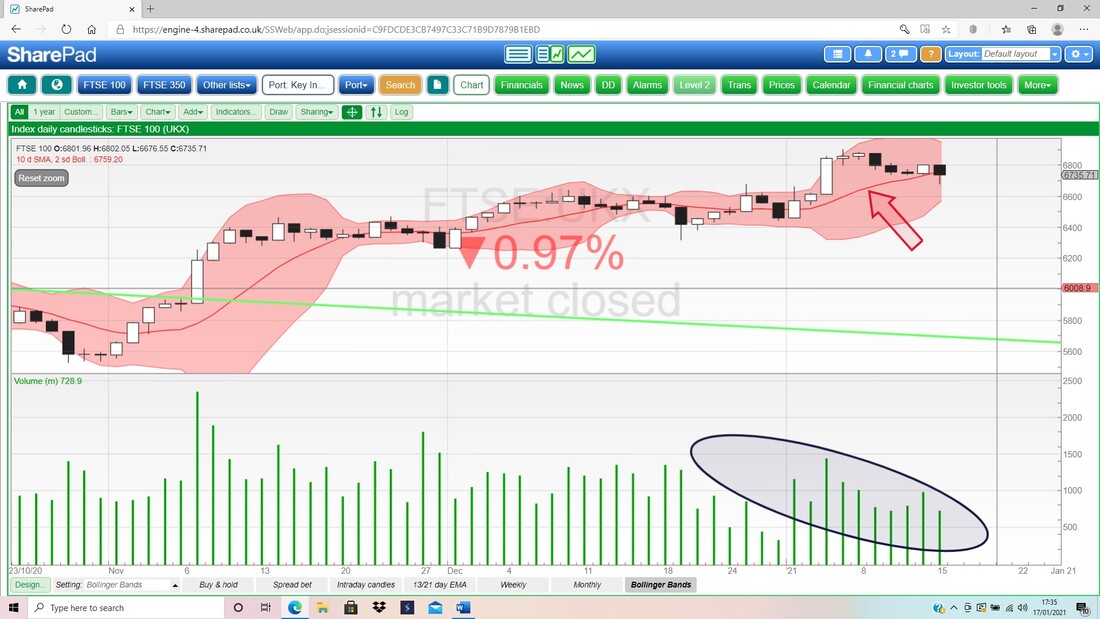
0 Comments
Leave a Reply. |

Stocks & Markets WheelieBlogsThese tend to be more Markets and Stocks related and timely - the Blog Page on the Main WheelieDealer Website has the 'Educational' stuff (well that's the theory anyway !!). Archives
October 2021
Categories
All
|
