

|
stocks & Markets blog |
|
As I seem to be doing far too much in recent times, I was watching ‘All out Politics’ on Sky News the other day (the one that Adam Boulton does in the morning) and someone on there was talking about Theresa May and saying how she had an “Uncompromising willingness to compromise” which did really smack the nail on its bonce.
This coming week will again see Brexit come to the fore in a mega way and we even have a Saturday sitting of Parliament which is extremely rare and the sort of thing that happened in the Suez Crisis, World War 2 and the Falklands War (I think this was the most recent time it happened – in 1982).
There was much excitement in the Markets on Friday with the Pound making a big move up which also started on Thursday and Globally Markets did very well until very late in the day when the US Markets fell off a cliff – it will be interesting to see how this looks on the Charts and it suggests to me that we might get more weakness at the start of the coming week – I will show that later. The bounce did strike me as a bit of a ‘crazy Friday move’ and no doubt there will have been much Short-closing and of course October is notorious for extremely volatile moves.
There were some massive moves in the Smaller Stocks on the UK Market and my Portfolio of Stocks did really well (I am sure everybody’s did really) and it does strike me that many of the Charts on Stocks that I hold in the FTSE250 and Smaller do look a lot better. Many Companies in the Smaller Indexes will be helped by a Stronger Pound because they often do not export much overseas yet they have a lot of imports and these cost more when the Pound is weak. Retailers are a classic example of this and even the ones with International exposure will probably have the majority of their Revenues in the UK and a Stronger Pound will help them on balance. There is no doubt the Markets have got very excited about a Brexit Deal but when you weigh up all the hurdles that are still to be jumped over it is clear that the assumption that a Deal will happen is probably well wide of the mark. OK, it is fair to say that a Deal has become ‘more likely’ and therefore the risk of ‘No Deal’ is reduced, but to totally assume that a Deal is nailed on is probably a stretch. Here are some of the hurdles:
Anyway, that gives a flavour of why it’s probably a mistake to assume a Deal is certain and clearly we are in for a big week on the political front. Throw in all the other problems around the Globe and it does start to look like the bounce on Friday was a bit overdone !! TPI Podcasts on Apple & Audioboom Peter @Conkers3 has done a superb job of getting the 3 most recent TPI Podcasts onto the Apple and Audioboom platforms and if you use these as your preferred way to listen to Podcasts then I suspect you will be very pleased with his efforts. It is a bit of a faff to upload each Podcast File and as a result we have decided not to spend time going all the way through the back catalogue (you can find all of these on SoundCloud) but from now on all new TPI Podcasts will appear simultaneously on SoundCloud, Apple and Audioboom when they are released. We have had lots of requests for this and it has taken a while to figure it out and we decided that the most efficient way to do this was to use the ‘Conkers Corner’ Channel that Peter @Conkers3 already has – so if you go to his Channel you should be able to find the TPI Podcasts very easily. I do not have Audioboom or Apple Accounts but I did a search using ‘Conkers Corner on Apple’ and ‘Conkers Corner on Audioboom’ and it came up easily using my laptop browser. Shout if you get problems but it should be straightforward. If you want to listen to the Podcasts on SoundCloud then there are links on the ‘Podcasts’ page which is on WD2 (the website you are reading this on). Last Week Bit of a strange week of course and my Portfolio struggled all week with it being down 1.25% at the worst point but then we had a big jump on Friday and despite the drag from my Short Positions, my Portfolio ended the Week down 0.1%. With the collapse in the US Markets later on, if I had calculated my Numbers a bit later on Friday night then I would probably have been in positive territory. Anyway, that all comes out in the wash so Monday might get a nice boost for me. I updated the ‘Weekly Performance’ page for September and when doing that I wrote a lot about my Strategy – nothing has changed since I wrote that early last week so nip over there and that will tell all. Mello Chiswick – November 12/13 The next Mello Event is due to take place on Tuesday 12th November and Wednesday the 13th in Chiswick. I intend to be there on the Tuesday afternoon and into the evening and there is a Discount Code going around where you can get Tickets for half price if you are quick – the Code is ML1950 and you can book at the link below: https://melloevents.com/event/ These are without doubt the best Investor Events around and well worth attending. There are usually loads of decent Companies with stands and presenting and it is a superb opportunity to meet up with other Private Investors who are serious about Stocks. Blog Slate I published the second part of the Blogs about not Over-thinking which is on the ‘Educational Blogs’ page on WD1 a few days ago. This week I will probably issue a ‘Guest Blog’ that a mate kindly provided (I am sure you all now him) and this will free up time for me to make more progress on the Blog I am writing about a particular Stock. I have done really well on it over the last couple of nights and it is probably half written so in the week after next I will most likely issue Part 1 of this Blog. I am enjoying writing about a Stock again and doing the Research work and I will no doubt be doing many more of these in the near future. From the Catacombs I was asked by a mate the other day what my ‘process’ for finding Stocks is and I remembered that I wrote a blog about this ages ago. Anyway, here it is and if you look at the ‘Blog Index List’ on WD2 then you can see the full list of all the Blogs I have written in the past 5 years: http://wheeliedealer.weebly.com/educational-blogs/how-i-find-potentially-great-stocks Better look at these Charts before I run out of evening !! S&P500 As always, the Charts I show are screenshots from the excellent SharePad software that I subscribe to and if you click the images then they should get larger so you can see more. I am starting with one of my favourite Indicators which is the 13 and 21 Day Exponential Moving Average Lines and we are interested in when they cross. On the Chart below the Black Line is the ‘fast’ 13 Day EMA and the Red Line is the ‘slow’ 21 Day EMA. Where my Red Arrow is we had a ‘Bear Cross’ and if you look at where we are now, the Lines are still apart and have not done a ‘Bull Cross’ despite the jump up on Friday. My Black Ellipse captures the Bearish ‘Shooting Star’ Candlestick from Friday and the long ‘Wick’ or ‘Tail’ shows how the Price fell back as I mentioned earlier. If the S&P500 had been able to hold the High of the day, then perhaps it would be a lot nearer a 13/21 Day EMA Bull Cross – but as it stands, the Bear Cross from my Red Arrow is still in force here. When you combine that with the Shooting Star it does suggest that Friday’s move doesn’t have legs and falls early in the coming week are most likely. Note there is a ‘Gap’ between the Candle from Thursday and where the Market opened on Friday – I suspect this Gap will be closed in coming days. 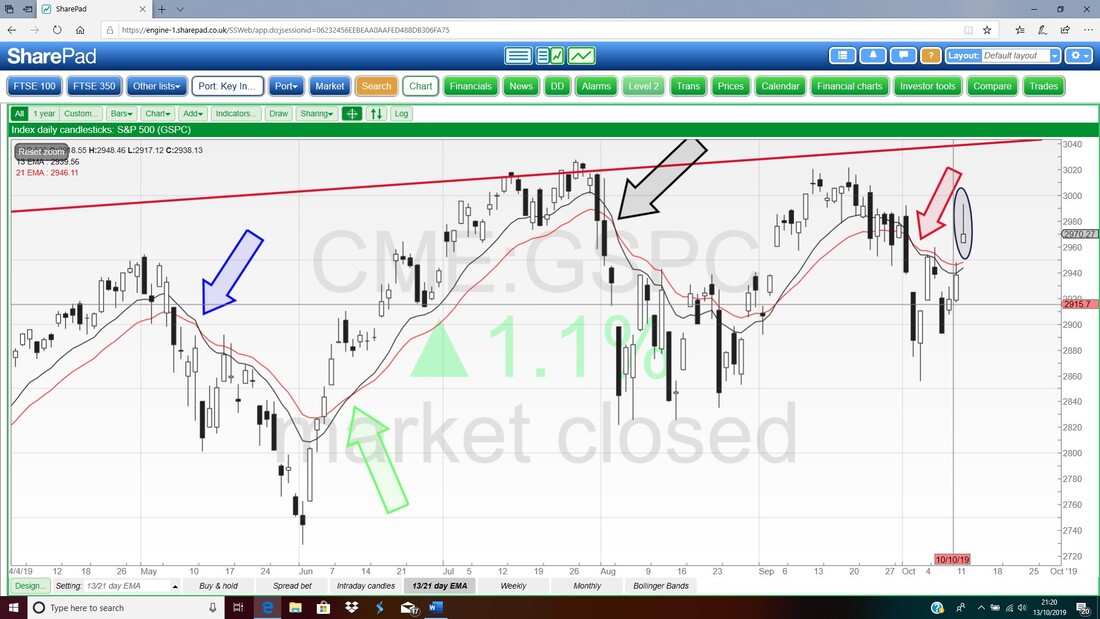
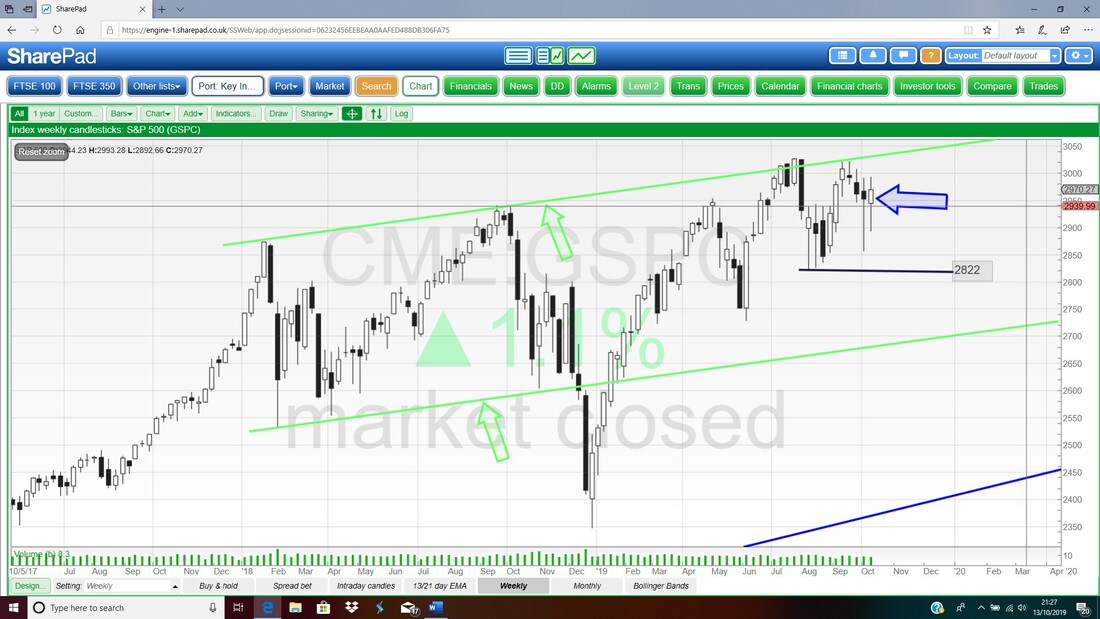
The next chart has the Weekly Candles for the S&P500 and my Blue Arrow is pointing to a ‘Long Tails Doji’ from Last Week and it is positive that it managed a gain on the Week (you can tell this from the White ‘Body’ of the Candle) but it also shows huge choppiness and of course we all know about the Shooting Star Candle from Friday. To me this Candle on the Weekly does not tell me much of use although it is worth noting that the Candle from Last Week has not managed to build much on the previous Week which was actually quite a good set-up for Bulls.
The next Chart has the Daily Candles for the S&P500 with the Pink Zone marking the Upper and Lower Bollinger Bands. My Black Arrow is pointing to the infamous Shooting Star from Friday and note how it hit the Upper Bollinger Band and then fell back. There is strong Resistance here at 2993.
To the downside, we have good Support where my Red Arrow is at 2855 and then just below this we have Support from 5th August 2019 at 2822. Higher Up we have the 2 Bearish Shooting Stars in my Black Ellipses (should that be Ellipsi?) and these look troublesome as a Bearish ‘Double Top’ pattern. 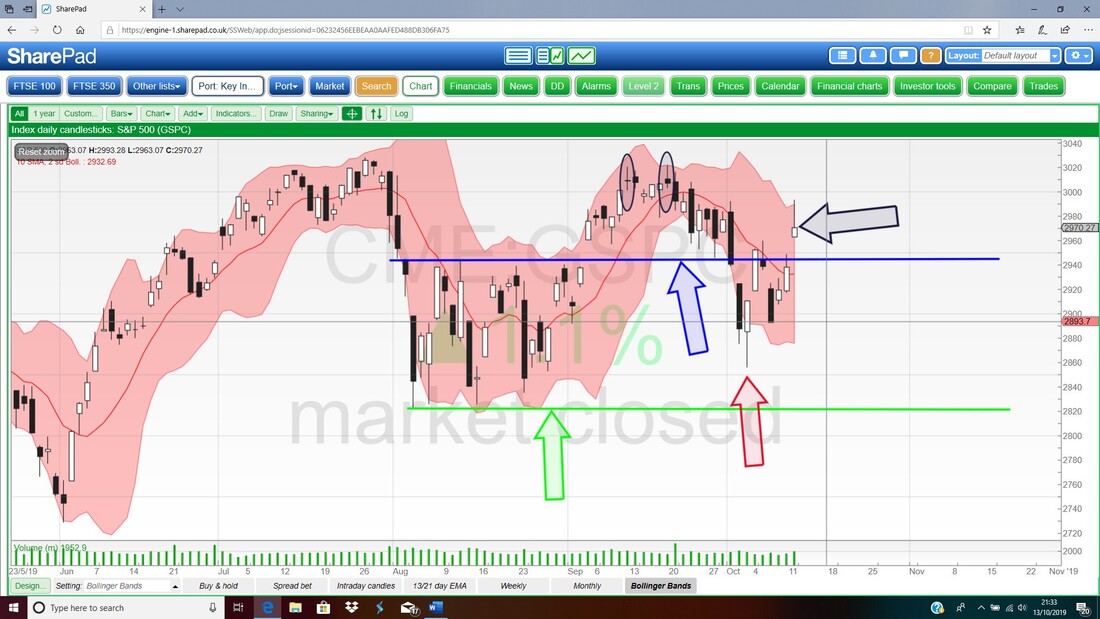
FTSE100
Next we have the Daily Candles for the FTSE100 and again I am focused on the 13 and 21 Day EMA Lines. My Blue Arrow shows a Bear Cross and at the moment the EMA Lines are still quite wide apart and a way from a Bull Cross. The Black Ellipse captures the Up Candle from Friday but remember this Closed before the US Markets tanked late in the evening. 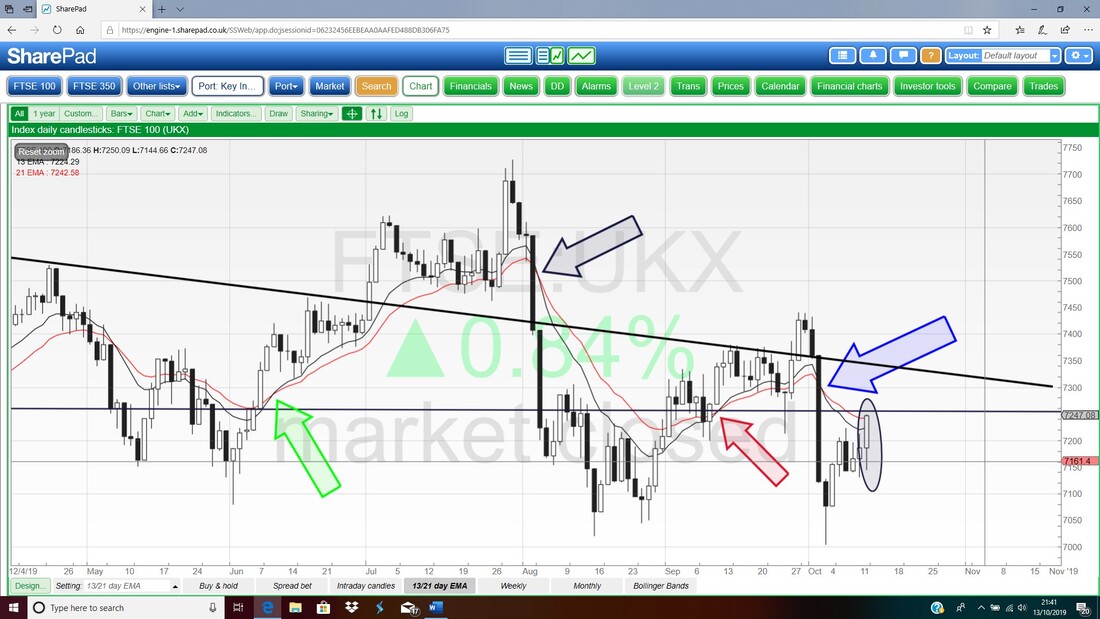
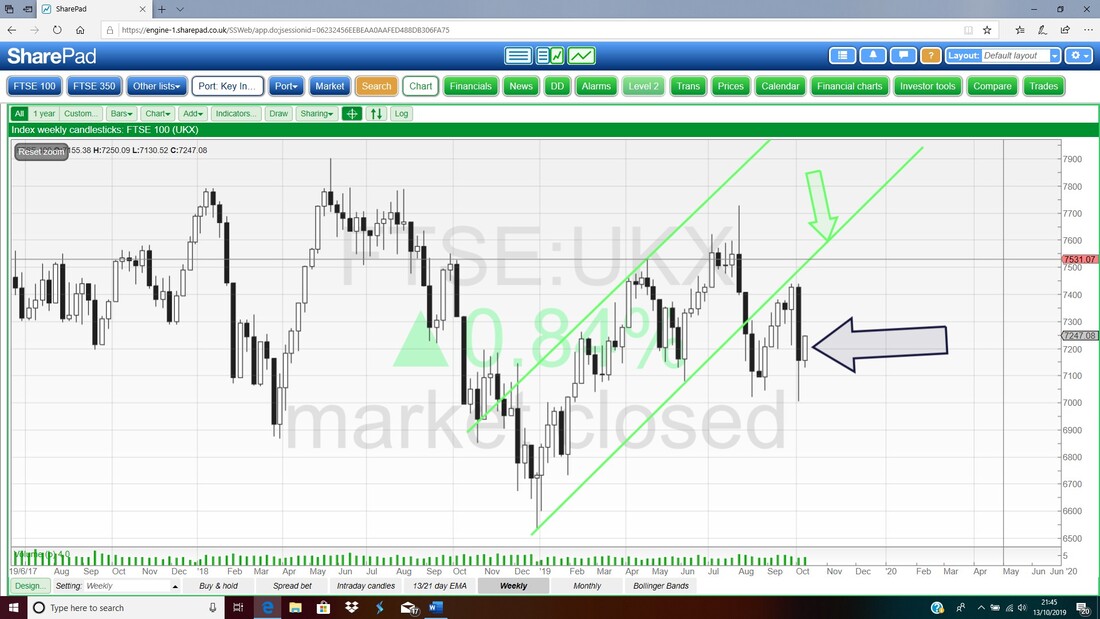
Next up it is the Weekly Candles for the FTSE100. My Black Arrow is pointing to a Small White Up Candle for Last Week and in combination with the Big Black Down Candle from the Previous Week, this could be a Bullish Harami Pattern (the pregnant floozie viewed from the side one). However, that is a generous interpretation really because for a Bullish Harami to really be valid and have a good context, you would need more of a succession of Falling Candles beforehand.
The next Chart shows the Daily Candles for the FTSE100 but this is my ‘working’ Chart so it is very messy and I want you to ignore most of it and just focus on the Arrows as I explain them and their significance. The Red Arrow is pointing at the Darker Blue Wavy Line and this is the 50 Day Moving Average and my Blue Arrow is pointing to the Light Blue Wavy Line which is the 200 Day MA (I hope you can just about make this out). My Black Arrow is pointing to a Bearish ‘Death Cross’ which occurred a couple of days ago and that is of course not ideal.
I find these Death Crosses not massively reliable but it is worth appreciating that all big Bear Markets have one of these in their early stages – so it is not something to completely ignore. 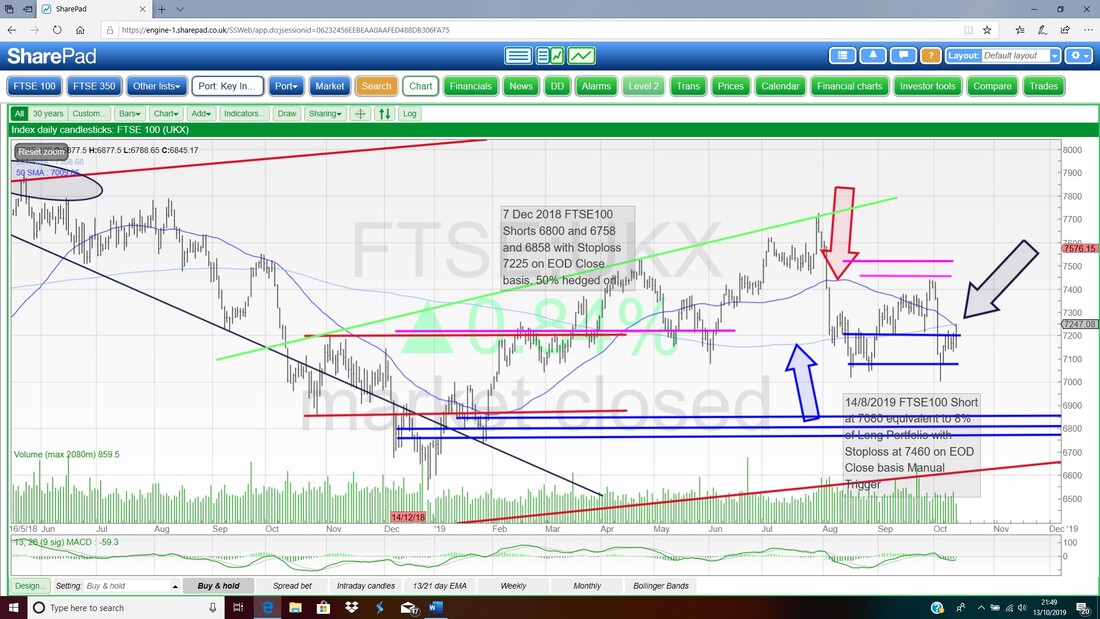
The Chart below has the Daily Candles for the FTSE100 with the Pink Zone showing the Upper and Lower Bollinger Bands. My Blue Arrow is pointing at the Big White Up Candle from Friday and in isolation this looks Bullish (but remember the US Markets dropped back in a big way later in the evening after the Close of the UK Markets).
To the Upside there is Resistance up at the Top Bollinger Band at about 7400 and then from 27th September at 7440. Up above this there is a wide Zone of Resistance as captured in my Big Black Ellipse in the middle of the Chart. To the Downside there is strong Support at 7004 from October 3rd and we can say really that 7000 must hold or it opens up a world of trouble. It’s getting late so I will leave it there. Have a great week and don’t let the Brexit silliness wind you up too much !! Cheers, WD. 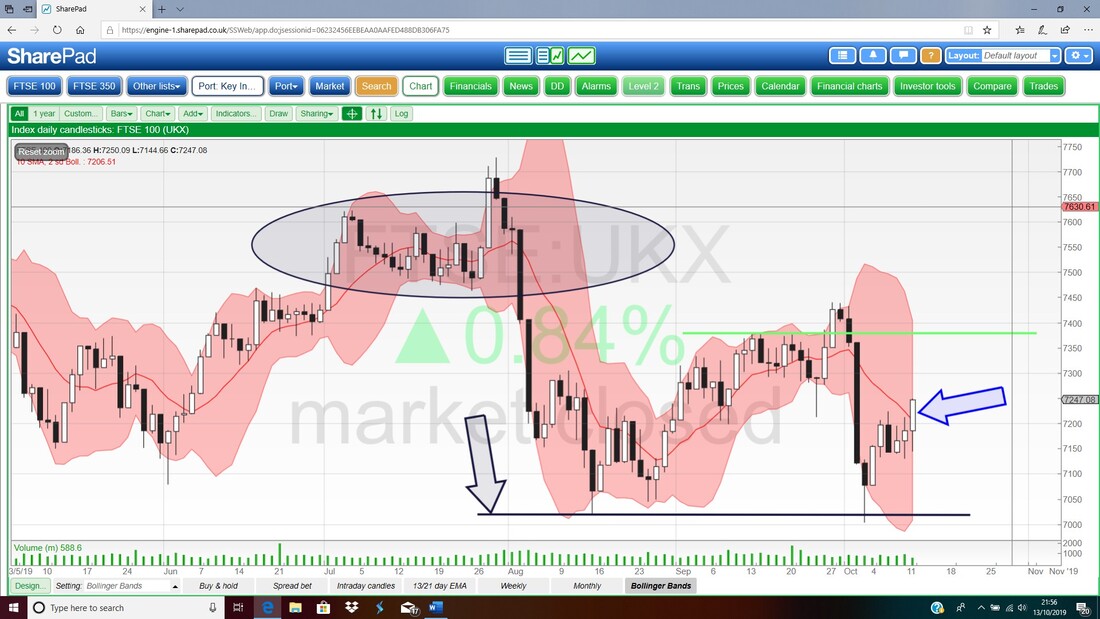
0 Comments
Leave a Reply. |

Stocks & Markets WheelieBlogsThese tend to be more Markets and Stocks related and timely - the Blog Page on the Main WheelieDealer Website has the 'Educational' stuff (well that's the theory anyway !!). Archives
October 2021
Categories
All
|
