

|
stocks & Markets blog |
|
Everybody’s best mate, Donnie Trumpington, has been pushing out the News this Weekend with first the relaxation of restrictions upon Huawei and then the shock visit to North Korea to have a beer with his other strange pal. It’s hard to predict much if any effect on the Markets and perhaps the Huawei News can be seen as a positive in an attempt to patch up relations with China and a step towards sorting a Trade Deal but of course it is early days and we all know how Trumpy has a habit of changing his mind depending on who he last spoke to. The NK News can probably be seen in the same light as a sop towards China and maybe this is a bit positive for Markets but there are plenty of other things that can cause trouble and at this time of year Markets are notoriously moody and we have certainly seen that on Small Cap Stocks this week.
The Month of July is usually a pretty good one (my ancient UK Stockmarket Almanac from 2016 has it as the 4th Best Month and then August is rated as the 7th Best Month – so perhaps we are going into a period when the FTSE100 does well (these ‘Best Month’ figures relate to the FTSE100 but Major Indexes tend to be very closely correlated and rise and fall together) although one caveat to that is that June turned out to be pretty good whereas it is normally extremely bad (2nd Best Month) which of course sets up strength in July. And of course after July and August we get the Worst Month of the year in September.
It is pretty crazy how US Stockmarkets are up near their All Time Highs and it looks highly possible that we will see these broken above in the coming weeks, which of course is very bullish behavior. The thing that really hits me is just how bonkers valuations on many US Tech Stocks have got. I was reading about one the other day, I think it was called Zoom or something which did something related to Cloud Computing I think it was, but anyway it was on a Forward P/E of 5000 !! That is utterly nuts – conventionally we tend to think of something on a Forward P/E around 10 or so as ‘cheap’ and once things get up to about 30 then it is starting to get quite ‘expensive’, and we get odd Stocks with more impressive growth profiles that might get up to 60 or so (but they are very rare and if they disappoint they get butchered). Another way to look at is it that if you have a P/E of 10 it will take 10 years for the Company to earn back your Investment and therefore if it has a P/E of 5000 then it will take 5000 Years to pay back your money !! Of course, the argument is that if a Stock can grow extremely fast, then it can justify the high valuation because the Earnings will compound in future years but the problem is that in reality very few Companies achieve this and even established and highly impressive Stocks like Amazon might ‘only’ be on a Forward P/E of 100 or something (I haven’t checked but I am just trying to paint a picture for you !!). And the problem is that it is not just Zoom but loads of other Stocks that have valuations which are not just through roof but through the Ozone Layer as well. I think it was Uber the other day which admitted that it is unlikely to make a profit for many years. It is simply crazy and I am hearing the same old “Valuations don’t matter” and “This time it’s different” (it never is) nonsense and I am pretty sure a reckoning cannot be far away. And if Tech Stocks get hit then you can expect other Markets to get some flak as well. The Global Economic picture is interesting also, with the US doing pretty well and with The Donald gearing up for his second term as Mr President, the US Economy is likely to get a boost from some fairly relaxed Fiscal Policy in the US and there is talk of Rate Cuts on the Monetary Policy side of things. China is as confusing as ever but is still growing fast although I keep reading that it is nothing special, but the big challenges are in Europe and of course the UK which seem quite troubled. Chris Dillow in the latest Investors Chronicle (page 12) was talking about Data that is expected from Europe this Week and it all looks like it will be pretty soggy. It’s not really clear what Europe’s problem is (apart from over-regulation of course) and I can’t help thinking that the concerns around Brexit are having a negative impact on the Continent and another source of blame could be the issues in the Car Market where Diesels are suddenly driven by Serial Killers yet ‘Green’ replacements are not really ready yet and throw in the general uncertainty and you can understand why no one is rushing to buy a new Car. With Germany, Italy, France and others being major Car makers, this could explain part of the malaise. It is particularly weird because Monetary Policy is still very soft and Interest Rates are on the floor – the theory that this should boost growth has clearly not worked and Europe does seem to be a very moribund region and Youth Unemployment is an utter disgrace at 20% for under 25s. A new Head for the European Central Bank (ECB) is being considered this weekend in the Head of Governments Summit and it will be interesting to see who they choose to replace SuperMario Draghi and this could have a lot of bearing on how Europe does in coming years. They still need to get a grip on the over-regulation though which is simply stifling growth as they turn more ‘Japanese’. In the UK we seem to be in a pretty daft limbo where the charade of choosing Boris as PM is ongoing and it just strikes me we are completely wasting time that would be better spent trying to sort out the Brexit balls-up. I will be astonished if Hunt wins the ‘contest’ and simply cannot see Tory Members (who are massive fans of Brexit) going for a ‘Remainer’ even if he does profess to really want Brexit this time – they took a risk on T May and I can’t see them falling for that one again. Boris is nuts but he is their nut. We have the US Non-Farm Payroll Numbers on Friday which usually give some drama around 1.30pm UK time and the estimate I read in IC was for 150k Jobs to have been created in June which is lower than the 200k that is normally the default. The numbers do seem to jump around though. Last Week A right shocker for me last Week with my Portfolio taking a hit of 1.7% and strangely the damage was from my Stocks misbehaving rather than a hit from my Index Hedges as the Indexes didn’t really do a lot. Air Partner AIR got a hit as worries emerged over the Trading Update which said that things were “challenging” and their Results would be Second Half weighted – this always spooks Traders and it does have a degree of validity as Companies which put out Profit Warnings have often said this before the Bad News finally hits. I don’t have a huge Position in AIR so I am quite relaxed about it as I quite like what they do and the recent diversification with acquisitions in related areas could pay off over time. AIR is very cyclical though so any more trouble in the UK Economy, which is pretty likely, could hit them hard. June has been a tough month for me and my Portfolio has taken quite a kicking which has come from my Hedges going the ‘wrong’ way mostly but I see no reason to change my Strategy of keeping my Risk low and not really doing much. If anything I am more likely to Sell stuff and am not keen to buy any Stocks although there are several I quite fancy. With the Autumn likely to be extremely messy with the historically nasty period for Markets and with Brexit on top and the Economic woes which are kicking around, I think buying anything now is totally unnecessary and just adds to Long-side Risk when I am far happier to wait it out and once we have more clarity on Brexit (whether it is ‘Deal’ or ‘No Deal’) it could be a much better (and safer !!) time to be buying. Blog Slate A few days ago I put out Part 2 of the Hotel Chocolat HOTC Blogs and as it stands now, I am not sure what I will create for this Week !! I want to write something about Live Company Group LVCG but I won’t be doing a really in-depth piece and also I have an idea for a Blog which is more ‘educational’ and is quite easy for me to write I think. That is an important element at the moment because Summer is in full swing now and I am trying to make the most of it and I don’t want to be glued to my Computer too much. For the Week after I am extremely busy with some social stuff and then with the Gaydon Motor Museum Meet-up on the Friday (12th July) where I hope to meet up with a group of Readers and that should be good fun (further down I will stick in a section about this Meet-up and anyone can turn up), so with all that going on I might struggle to get a Blog out – but if I fail to do this, there is a huge archive of previous material that I am sure you can dig through. I will of course be pumping out Tweets like some sort of insane crazy Twitter Banshee. Once the next couple of weeks are out of the way I should have more time to create material so I expect to keep the flow coming and I particularly want to create a series of Blogs about common mistakes that Newbie’s make – that is quite a cliched subject and I have read countless articles about this but as you would expect I am sure I can knock up a lot of stuff which is very different and much more ‘Real’. Gaydon Museum Meet-up You can find out details about this one on the ‘Events’ page and the crux of it is that I will be at the National Heritage Motor Museum at Gaydon just off one or other motorway (it’s a bit below Birmingham I think) on Friday 12th July. Again everyone is invited and you just need to pay the entry fee to the Museum but it is well worth going and we should have a good laugh. Come and join us. I am not too worried about knowing who is coming because it is a huge venue and a public place anyway. Generally these kinds of Meet-ups tend to be smaller with perhaps around a dozen people or so which means that if you are new to investing or anything then they can be a superb opportunity to meet up with the highly experienced and successful Investors who I know are coming along. It is well worth taking advantage of. WheelieBash 2019 You can find out more details about this on the ‘Events’ page which is on WD2 (there is a Button at the top of the main Homepage on the main Website and you are actually reading this Blog on WD2 even if you hadn’t realized so if you go to the top of the Page you should find the Menu to get you to the ‘Events’ page) and it is taking place on Saturday 7th September and I can confirm that it will be held at the same venue as last year - the White Hart in Winkfield which is just outside Windsor. There is a link on the Events page to the Pub and everyone is invited but please contact me somehow if you are coming because I need to keep track of the numbers - we are allowed 60 People and it is pretty likely we will get that I think - the List is filling up fast with 20+ confirmed attendees already and a lot of people at Mello said they are interested and will let me know (and that was not prompted by me). From the Catacombs Here’s one from back in April 2016 (blimey, that is more than 3 years ago now !!) that you should be able to get stuck into. Links to Parts 1 and 2 are right at the bottom of this one: http://wheeliedealer.weebly.com/educational-blogs/for-investors-red-herrings-are-a-poor-diet-part-3-of-3 Enough waffling, let’s check the Charts. S&P500 As always the Charts I will show here are taken from SharePad which I subscribe to and if you click on them they should get larger so you can see more detail. First off we have the Daily Candlesticks for the S&P500 and I am just showing a period going back about nearly 3 months and the focus is on what it looks like is happening now. My Blue Arrow is pointing to an Up Candle from Friday and this looks like the S&P500 is turning up again after peaking out short-term where my Black Arrow is pointing to a ‘Shooting Star’ Candle and then it fell back for a few days and is now pushing up again. That Shooting Star hit a new All Time High (ATH) which is at 2964 and it looks highly likely that this will be broken-over very soon. 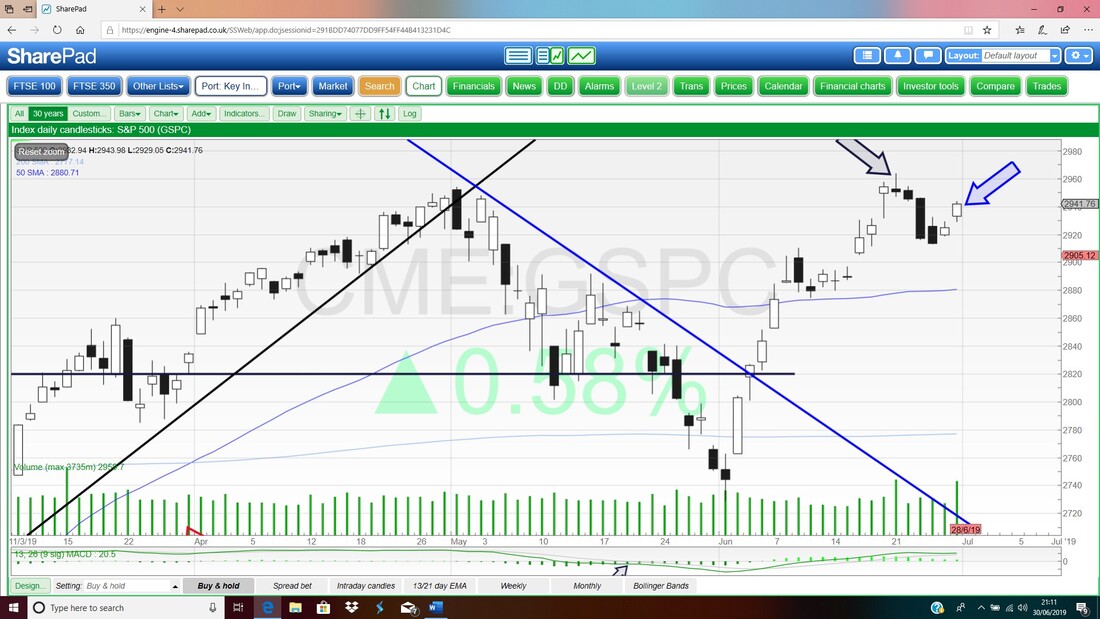
In the bottom window below we have the RSI (Relative Strength Index) for the S&P500 Daily. Where my Black Arrow is the reading is RSI 60 which is not particularly high so it has ‘room’ to push on up to test that ATH. However, if you look to the left and all the recent history of the RSI, it is pretty usual for it to top out around RSI 70 which is usually seen as the ‘Overbought’ level so it could easily take out the ATH and then drop back before perhaps trying to move higher again.
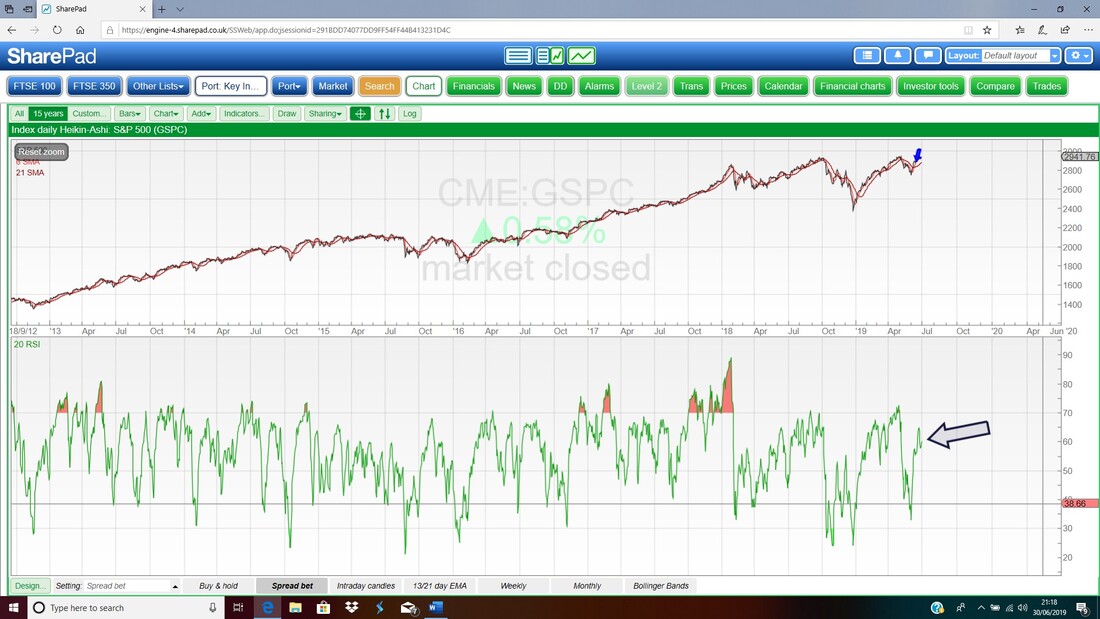
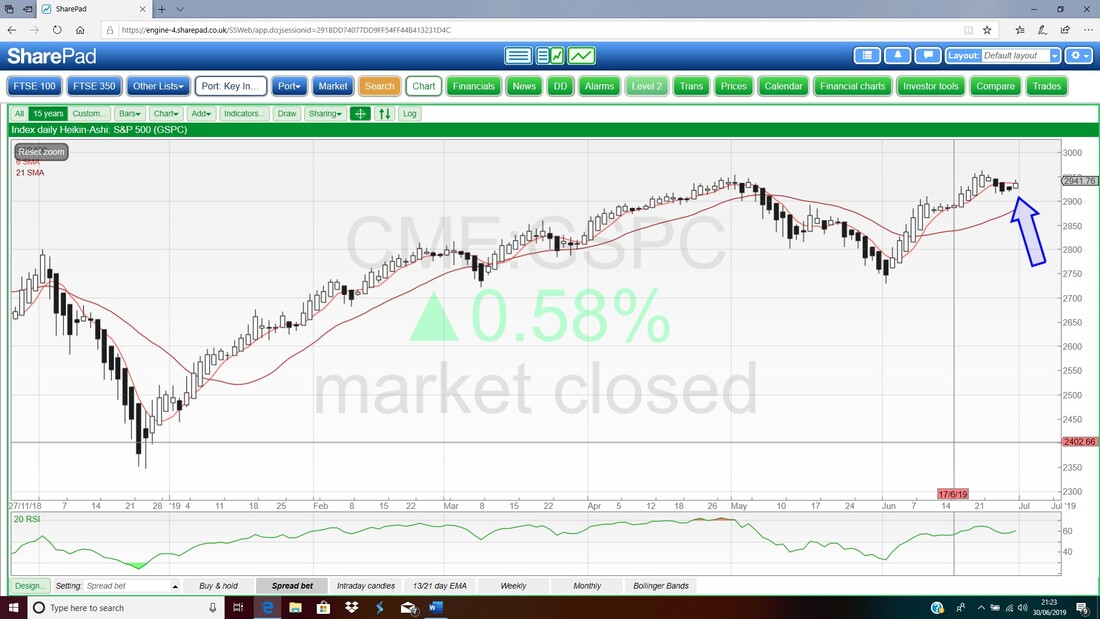
In the upper window on the ScreenShot below we have the Daily Heiken Ashi Candlesticks. These are very different to the ‘normal’ Candlesticks I show and are interpreted in a much more simple way. Where my Blue Arrow is, the HA Candles have turned White from Black which is bullish.
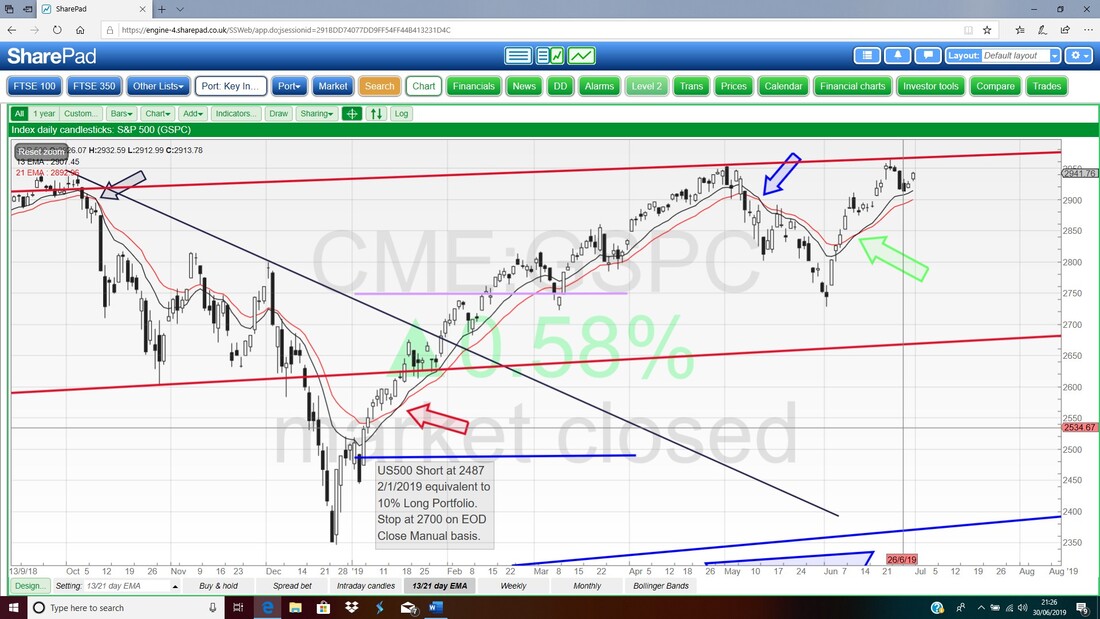
On the next Chart, we have the normal Daily Candles but what I am focusing on is the Crossovers between the Black 13 Exponential Moving Average Line and the Red 21 Day EMA. Where my Green Arrow is there was a Bullish Crossover and this in effect means the S&P500 is in ‘Bull mode’. If you look back where the Red Arrow is we had a similar occurrence and I tend to find this a very reliable Predictor that we are likely to see gains ahead over several Weeks. For this to change we would need a Bearish Cross which is like what happened where the Blue Arrow is.
This is a bit less Bullish. Here we have the Weekly Candles for the S&P500 and my Red Arrow is pointing to the Candle which was created last Week and this could very well be a ‘Hanging Man’ which after a rally, can indicate a Turn so it drops back again. If you look at the Chart we had a rally for 3 Weeks before this Hanging Man so the context fits this textbook theory.
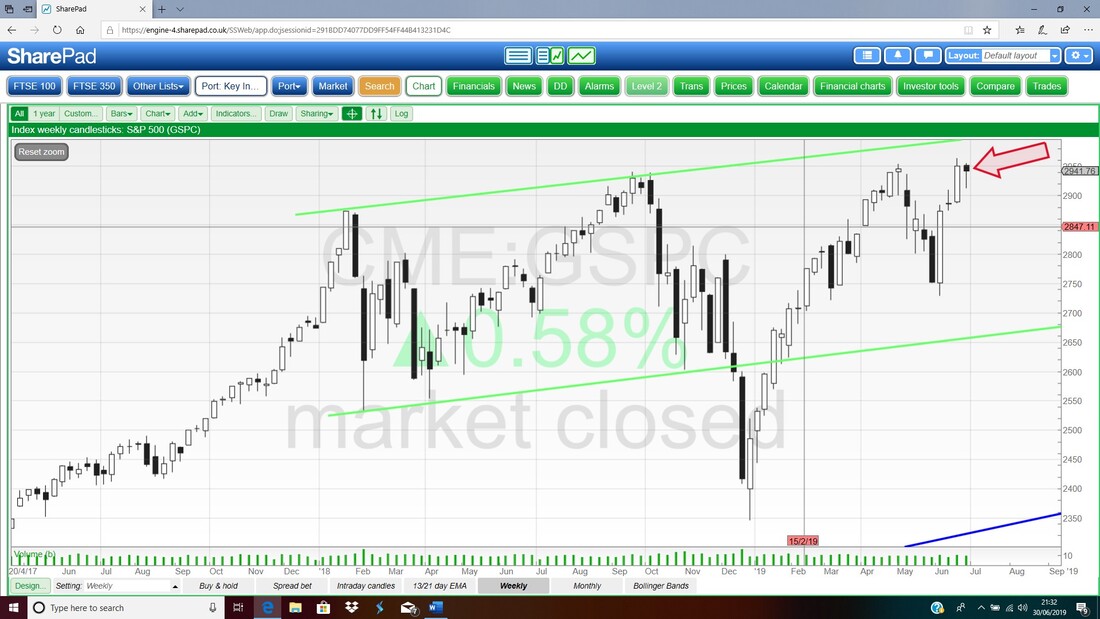
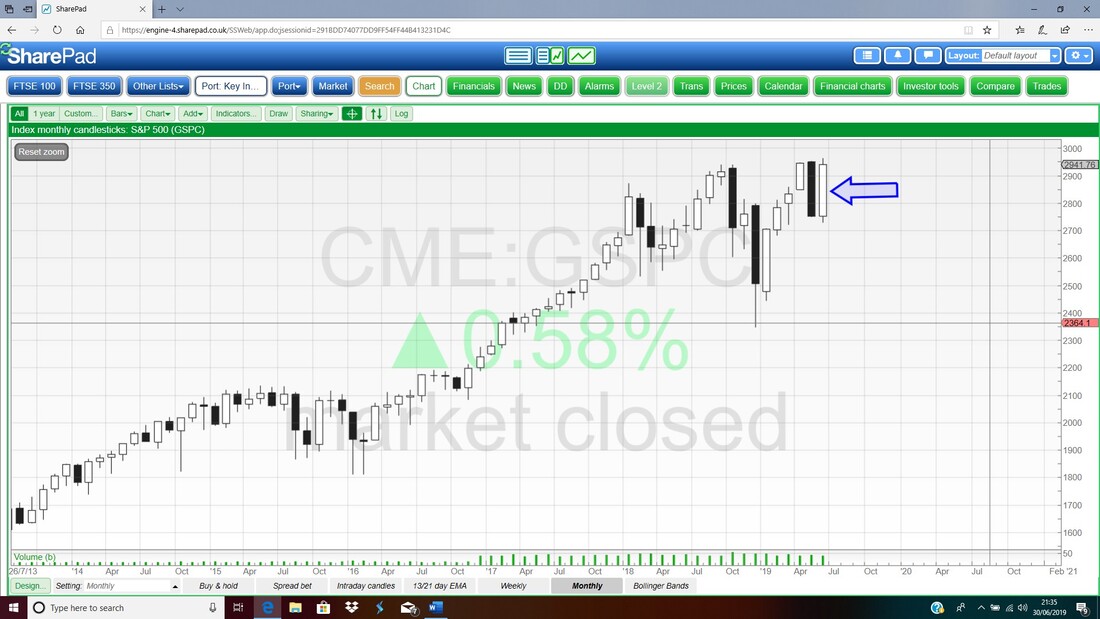
This next Chart is Bullish though. Here we have the Monthly Candles and the Candle for June is fully valid now because June is a 30 Day Month. After the Big Black Down Candle of May we had a Big White Up Candle for June (where my Blue Arrow is) which is pretty much of equal size and avoids a much nastier scenario where June could have built on the poor performance in May to create a Downtrend.
Nasdaq Composite Index
I was mentioning the bonkers valuations on many US Tech Stocks earlier in this scribbling and it makes sense to see what the Nasdaq is doing in technical terms. My Chart below has the Daily Candlesticks for the Nasdaq Comp going back about 2 and a half months. My Red Arrow is pointing to the Candle from Friday and it is interesting that it is a bit different to the Candle we saw on the S&P500 and it has a bit of a Tail downwards. In this context I think it can be interpreted in a similar way to the S&P500 one but it is interesting that whereas the S&P500 is not far off the ATH, the Nasdaq has a bit more work to do. First the Nasdaq needs to take out the Resistance from the recent Peak where my Blue Arrow is at 8089 and if it cracks that level, it needs to take out the ATH which is where my Black Arrow is at 8176. Something else to note though is down the bottom of the Screen where my big Green Arrow is. This is pointing to a big Volume Bar and this could have some significance although I am not sure what it is !! It seems strange that we should get a Volume spike on a Friday – there could simply be a ‘technical’ reason for it like Options Expiry Day or something like that. In all other respects the Nasdaq Comp is pretty much the same as the S&P500. 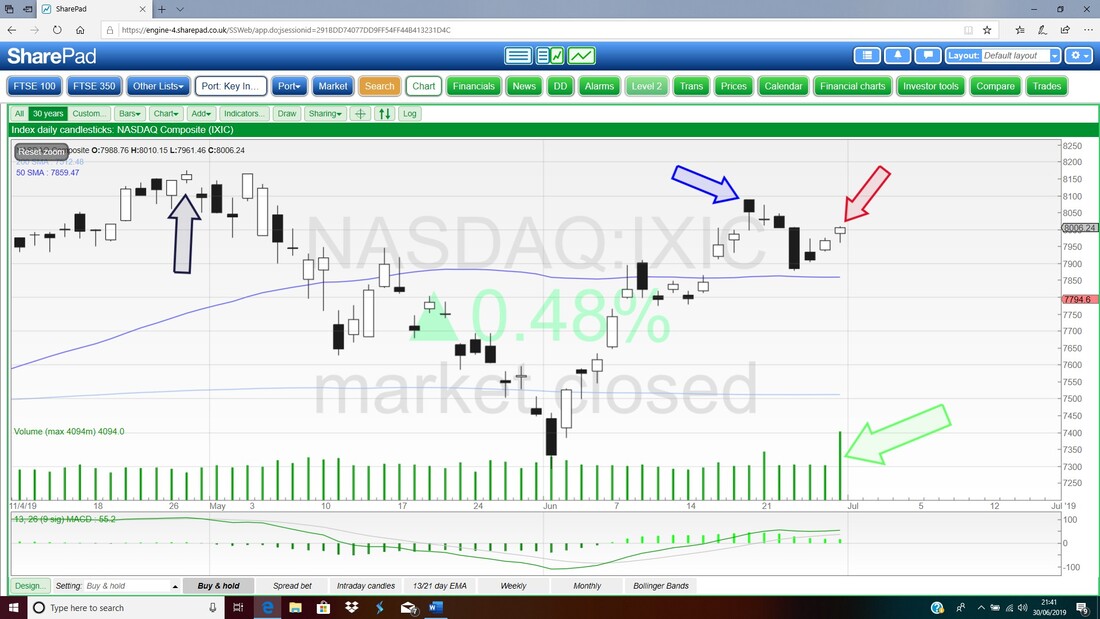
Dow Jones Industrials Index
Next we have the similar timescales as I showed on the S&P500 and the Nasdaq Comp for the DOW. My Black Arrow is pointing to yet another Candle this time for Friday and this is less confident than that on either the S&P500 or the Nasdaq. On the DOW it is clear that the Bulls and Bears had quite a battle on Friday and neither really had the upper hand. This suggests some hesitancy whereas the S&P500 in particular looks more bullish. The DOW only has 30 constituents and they are all huge Mega-Companies so it can do some different behaviours now and again and it is probably more influenced by the Oil Price whereas the S&P500 is more susceptible to movements on Tech Stocks. The ATH on the DOW is at 26952 but before attacking that, the DOW needs to get over the ‘Shooting Star’ Candle where my Blue Arrow is at 26907. As with the Nasdaq Comp, if you look down at the ‘Volume’ Bars, my Green Arrow is pointing to another big Volume Spike. I just looked back at the S&P500 and that has high Volume from Friday but not as noticeable as on the DOW and Nasdaq Comp. On all the other Indicators/Signals I look at, the DOW is similar to the S&P500 and Nasdaq Comp. 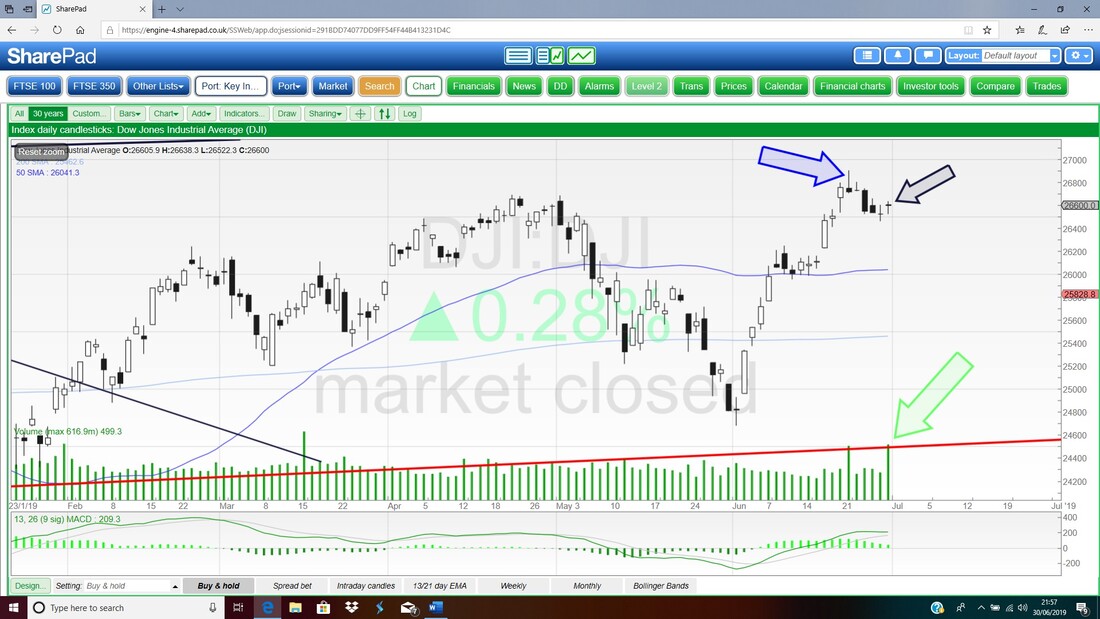
FTSE100
I’m starting off with the Exponential Moving Average Crosses that I tend to really like; this is more because I want to draw your attention to the Black Downtrend Resistance Line (pointed at with the Black Arrow) which I will talk about on the next Chart. My Green Arrow is pointing to a Bullish Crossover between the 13 and 21 Day EMAs and obviously we are still in this ‘Bull mode’. 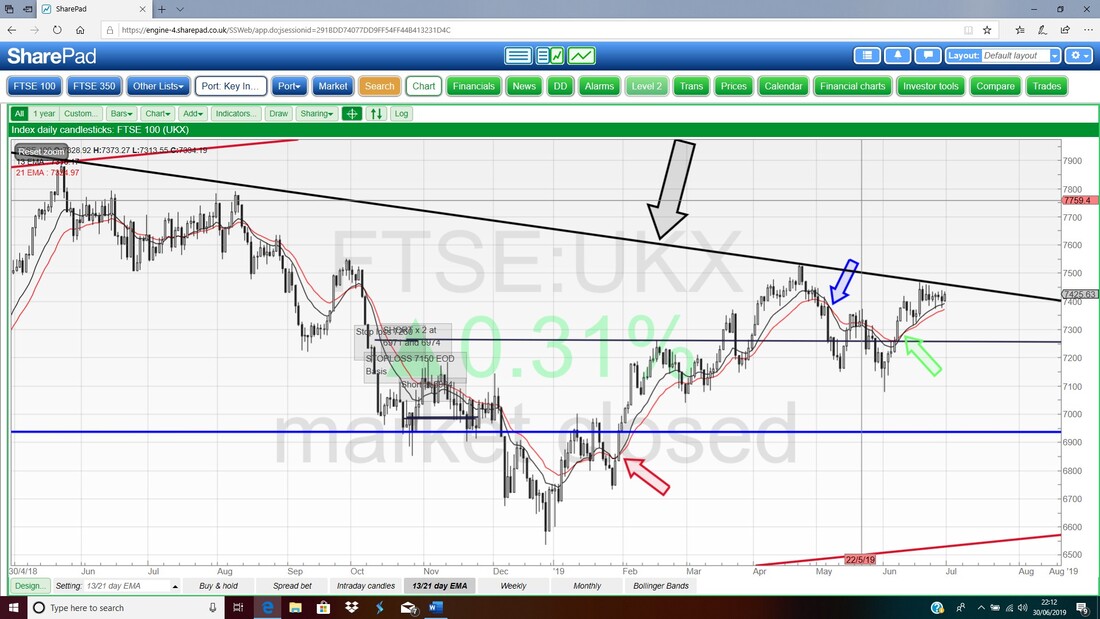
The Chart below has the Daily Candles for the FTSE100 and the Black Line marked by my Black Arrow is the same line as I showed on the previous Chart but this time I have shortened the timeframe a bit. The point is that recent Price Action for all of last Week and a bit before has been sideways and is captured in my Red Ellipse and this seems to be a ‘Consolidation’ move before another jump up. If this is the case it will break through the Black Line and this would be another Bullish occurrence.
There is Resistance from where my Red Arrow is at 7528 and it is still a distance to the All Time High which is up at 7903 and there is a lot of Resistance between these levels. 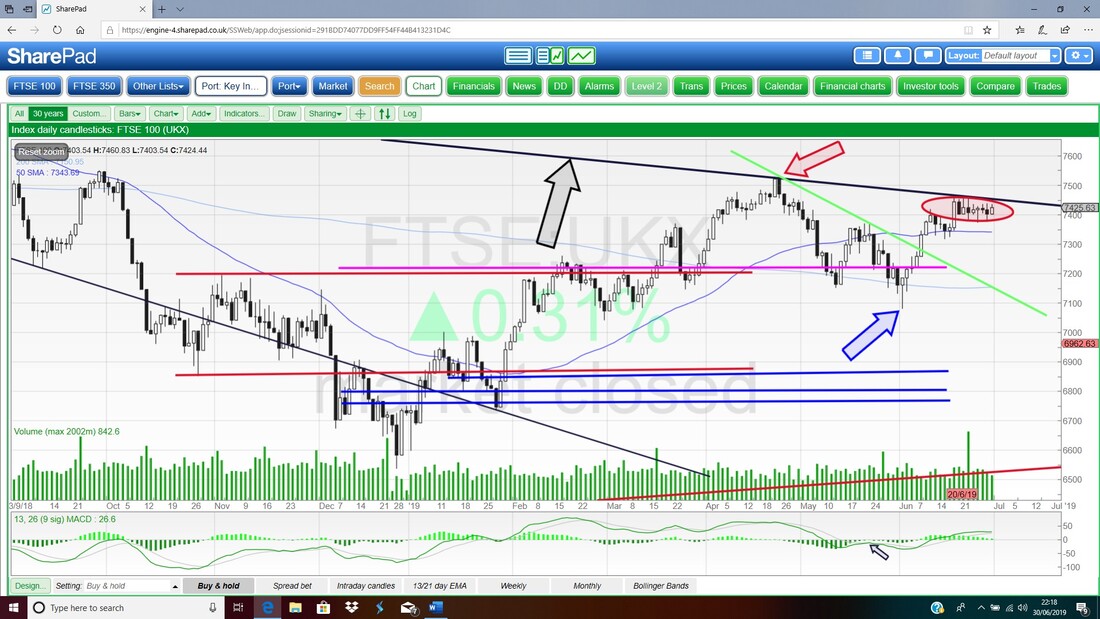
Next we have the Monthly Candles. My Blue Arrow is pointing to a Big White Up Candle which is very similar to the ones on the US Indexes and this looks Bullish.
OK, that’s it for now. Good luck in the coming Days and enjoy the Sunshine if we get treated to it again this week but I hope it doesn’t get too silly hot !! Regards, WD. 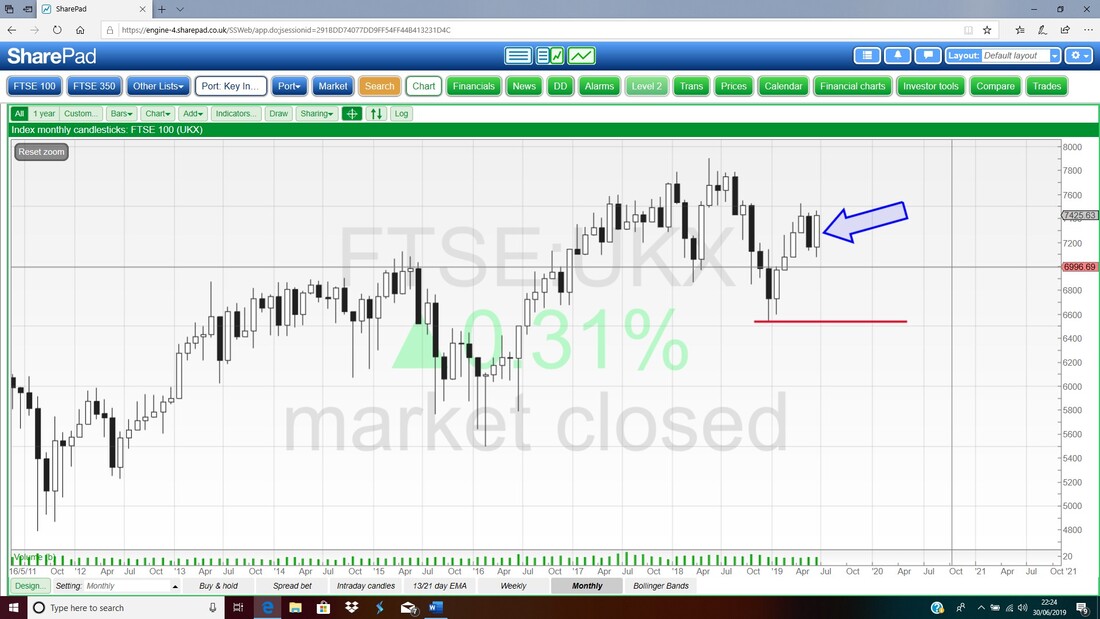
0 Comments
Leave a Reply. |

Stocks & Markets WheelieBlogsThese tend to be more Markets and Stocks related and timely - the Blog Page on the Main WheelieDealer Website has the 'Educational' stuff (well that's the theory anyway !!). Archives
October 2021
Categories
All
|
