

|
stocks & Markets blog |
|
I was watching ‘QI’ the other night and it always makes me giggle but the bit I liked was a quote from Salvador Dali to the question, “Why don’t portraits look like the person being painted?”, to which Dali replied “Some people make no effort to resemble their pictures.”
I won’t dwell on this subject but it might be something I come back to in a future Educational Blog. The more I muck about with Stocks and Markets, the more I come to the view that there are countless trade-offs between so many aspects and one such trade-off that is very much to the forefront with how I do things is to accept that not doing much in terms of Buying and Selling Stocks can have very beneficial impacts on a Portfolio (I often hear someone saying they were forced to leave their Portfolio alone for several months and then they come back to it to find it has probably done better than if they had ‘worked’ on it as usual and basically tinkered too much with a consequent negative impact on Returns), but the trade-off is that perhaps if I was to be more active, I might make more Money.
To me it is a ‘satisfice’ thing though. I can make enough Money doing not very much and it means I have a very easy life (evidence: spending the afternoon in a Curry House on Wednesday and an afternoon in the Pub on Friday this Week !!!) and as little stress as possible. My health considerations from being paraplegic are significant and often unexpectedly inconvenient and the way I invest very much is in harmony with these constraints. That is highly important to me for obvious reasons.
OK, maybe I could make more dosh from being more active (but of course it is highly likely that I make less because of the costs of more Trading and the increased possibilties of both getting more successful Trades but also getting more failing Trades. The long and short of it is that I might make a few more % of Returns in a given year but to be honest I just don’t think that it is worth the bother in terms of my ‘work’/life balance. Mello Vote The upcoming Mello Chiswick Event also has the ‘Mello Awards’ presentation on the Wednesday Evening I think and the Nominations are in and you can now place your Vote in various categories. It is well worth doing this because it brings to your attention people on Twitter who are seen by other Investors and Traders as very well regarded and there are also some very interesting lists of particular Shares to vote for in certain categories. It is worth seeing which Stocks are on the lists and one I notice in particular is RA International RAI - that one does look interesting and ‘moaty’ (they do work for organisations like the UN in some very dodgy parts of the world and seem to be very good at it - I doubt many Companies would want to get involved). Anyway, you can find the Voting thing here and my mantelpiece is in desperate need for some balance after winning the ‘Most influential Twitter account’ award last year. Joking apart, you really should vote for whoever you think deserves to win a particular category: https://melloevents.com/awards/ Last Week Another decent Week for me with my Portfolio gaining 2.1% and this means that I am now up 3.5% on the Year so far. I am really pleased about this because for most of 2019 so far I have been struggling with the drag of the FTSE100 and S&P500 Hedges that I have in place but my Stocks seem to have really perked up lately. I have been helped in particular by BOO moving up well around Results, the takeover of KCOM and good news from MPAC last Week - it is nice to see things finally going my way. On top of this my Income Portfolio has been chugging away nicely - I haven’t checked it for a while but this has put in some additional gain as well. It is particularly grating on the psychology to be lagging the Markets in this way and some Returns other Investors have been racking up are superb. However, we all know things can change very fast and it is all too easy to be ‘counting our chickens……’ and I seriously doubt 2019 will continue to be this easy. Things seem quite euphoric to me and that is never sustainable. If and when the mood of the Markets changes, I will be sitting pretty with my Hedges……. Readers sitting on big profits might do well to think about some TopChopping and lowering of Exposure. As I have mentioned in other Weekend Charts Blogs recently, I am sticking with my Short Positions as I think it would be a mistake to close them when we are heading into Summer which is historically the weakest 6 month period for Stocks and after such a strong rebound at the start of 2019, a pullback seems highly possible. If it doesn’t happen over the Summer, I suspect it will happen in the Autumn when the Markets around September and October can be very messy at times. The Month of May is often a weak one and the normal pattern is for rises in the first 2 Weeks and then it falls away at the end of May - “Sell in May and go away………” The Brexit thing still has huge potential to cause trouble (that is why my Hedges are in place anyway) and after the kicking both Tories and Labour got in the Local Elections, both Leaders look extremely weak and although it is possible that the EU Parliament Elections could be avoided, it is looking pretty certain that the Votes will go ahead and it will be in effect a proxy Brexit Referendum re-run with the Brexit Party up against the LibDems and the Tiggers. With the Tories likely to get smashed in such a vote, it is surely a nailed-on certainty that Theresa May will be out soon and the turmoil of a new Leader being appointed and a possible General Election could hit Stocks in a big way. And of course Stocks look very over-valued in general. On the other side of things, there were some extremely strong US Non-Farm Payroll Numbers on Friday and there are hints that the European Economy is picking up after a bit of weakness and Mark Carney at the Bank of England revised up GDP forecasts for the UK although the flipside of that is that Interest Rates might need to rise slowly. It is early days and we need to keep alert but it does appear that the Global Economy might be picking up after the soggy period recently. So my overall Strategy remains the same of not doing very much and just biding my time and waiting for an opportunity to Short more with a very strict Stoploss policy - this will enable me to ‘Average up’ in theory and mean that I can perhaps escape from my Short Positions without too much pain. We shall see no doubt. WheelieBash 2019 You can find out more details about this on the ‘Events’ page which is on WD2 (there is a Button at the top of the main Homepage on the main Website) and it is taking place on Saturday 7th September and I can confirm that it will be held at the same venue as last year - the White Hart in Winkfield which is just outside Windsor. There is a link on the Events page to the Pub and everyone is invited but please contact me somehow if you are coming because I need to keep track of the numbers - we are allowed 60 People and it is pretty likely we will get that I think - the List is filling up fast. Gaydon Museum Meet-up You can also find out details about this one on the ‘Events’ page and the crux of it is that I will be at the National Heritage Motor Museum at Gaydon (it’s a bit below Birmingham I think) on Friday 12th July. Again everyone is invited and you just need to pay the entry fee to the Museum but it is well worth going and we should have a good laugh. Come and join us. Fundhunter Website This is a new Website that is run by Andrew Latto who many of you may know from Twitter. It is dedicated to Funds and Investment Trusts I think and is certainly worth having a look at if you are interested in such Investments: https://www.fundhunter.co/ Blog Slate A few Days ago I issued Part 1 of the Blogs I have specifically written about the superb method that Jason @Stealthsurf uses and you can find out more about it on his website ‘Trading Bases’ which you can find here: https://www.tradingbases.co.uk/ In Part 1 I was mostly ‘setting the scene’ and going over some very important yet simple Technical Analysis concepts that you need to understand or else Jason’s method won’t make any sense at all. I expect to issue Part 2 later in this coming Week and I suggest you familiarise yourself very well with what I wrote in Part 1 and then it will all make perfect sense to you. It is quite simple if you understand the concepts of Breakouts and Stoplosses etc. but I know many people find it hard to get their heads around fully. I have several other Blogs in various draft forms and last night I made good progress on a Blog which I have based on an Article which appeared in Investors Chronicle a couple of Weeks ago. That one was very good but a bit too academic and theoretical for my tastes so I have ripped out chunks of text from it and then wrote my own view of things around it. The subjects are really about efficient of Markets and some psychology stuff in particular about overconfidence - I see a lot of this so I think Readers will find it useful and give them something to think about. With April now done and dusted (and an unusually good month for me !!) I need to update the ‘Weekly Performance’ page and I will try and do this in the next few days. Buried in the Catacombs It always astonishes me how much I have scribbled in the last 4 and a half years and the Blog Archive is now pretty massive. You can of course find this on the ‘Blog Index List’ and all the Educational Blogs have links so they are dead easy to find and if you are relatively new to my Website and stuff, then it might be worthwhile looking back through this Archive and making the most of it. This Week I have picked out a Blog Series on Position Sizing which was actually one of the first things I wrote many years ago. I think this is an extremely important subject and simply buying the same amount of each Stock you have is probably not the best way to do things. I tend to size to volatility and you can read about that in these somewhere: http://wheeliedealer.weebly.com/educational-blogs/the-wheeliedealer-approach-to-position-sizing-part-1 http://wheeliedealer.weebly.com/educational-blogs/the-wheeliedealer-approach-to-position-sizing-part-2-stocks OK, let’s see what the Index Charts are up to as we move into the weaker Summer period….. S&P500 As always the Charts I show are ScreenGrabs from the superb SharePad Software that I subscribe to and if you click on them then the images should get larger so you can see more detail. My Chart below has the Daily Candlesticks for the S&P500 and I have chosen a Date Range which takes in the previous Highs which are where my Red Ellipse is and that captures a Previous All Time High at 2941. My Black Arrow is pointing to a Big Up Candle from Friday and note how on the Thursday we got something that looks sort of like a Hammer Candle (the context is not right for a proper Hammer - we would need a sustained move down first, not just one day) and this Reversed up off 2900 so this is clearly nearby Support now. The High on Wednesday last Week was at 2954 so a new All Time High was made but the Price dropped back. After the strength on Friday it looks like the S&P500 might try to attack that 2954 Resistance again although it is worth bearing in mind that ‘Monday reverses Friday’ is often a feature and we might get a down day tomorrow in the US (I think the US is open even though our UK Market is closed for the Bank Holiday - yippee !!). Note the Blue Line (pointed at by my Blue Arrow) which has been Support since the start of 2019 and note in particular how the Price dropped below it in recent Days - this is something to watch. ’Support becomes Resistance’ so the Blue Line might now act as Resistance and the Price could struggle to get up over it again - this is going to tell us a lot about what is likely in coming Weeks. 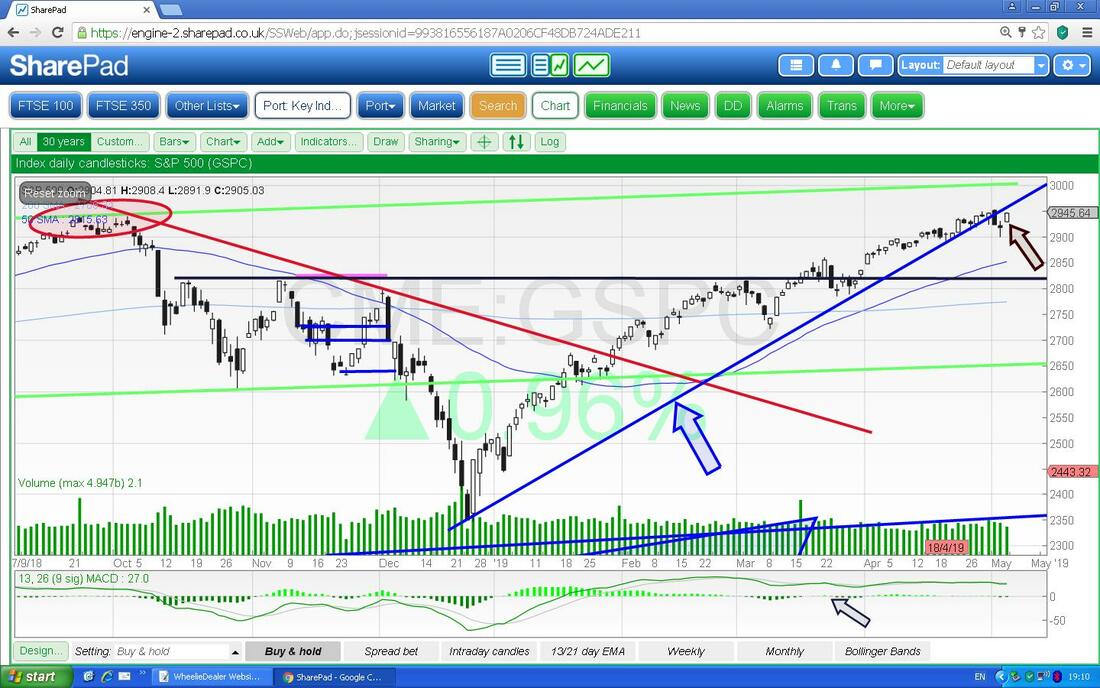
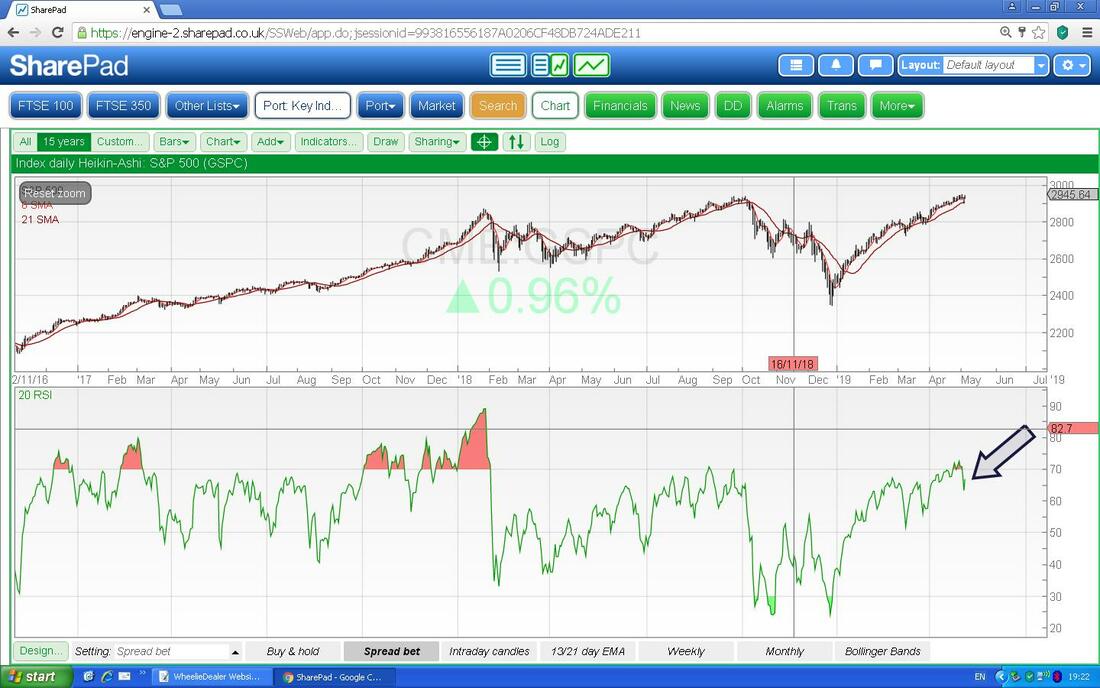
In the bottom window on the ScreenShot below, we have the Relative Strength Index on the Daily and on an RSI of 67 this is still a high level even though it has dropped back from a bit higher. If the S&P500 rises from here, it might not get far before dropping back again.
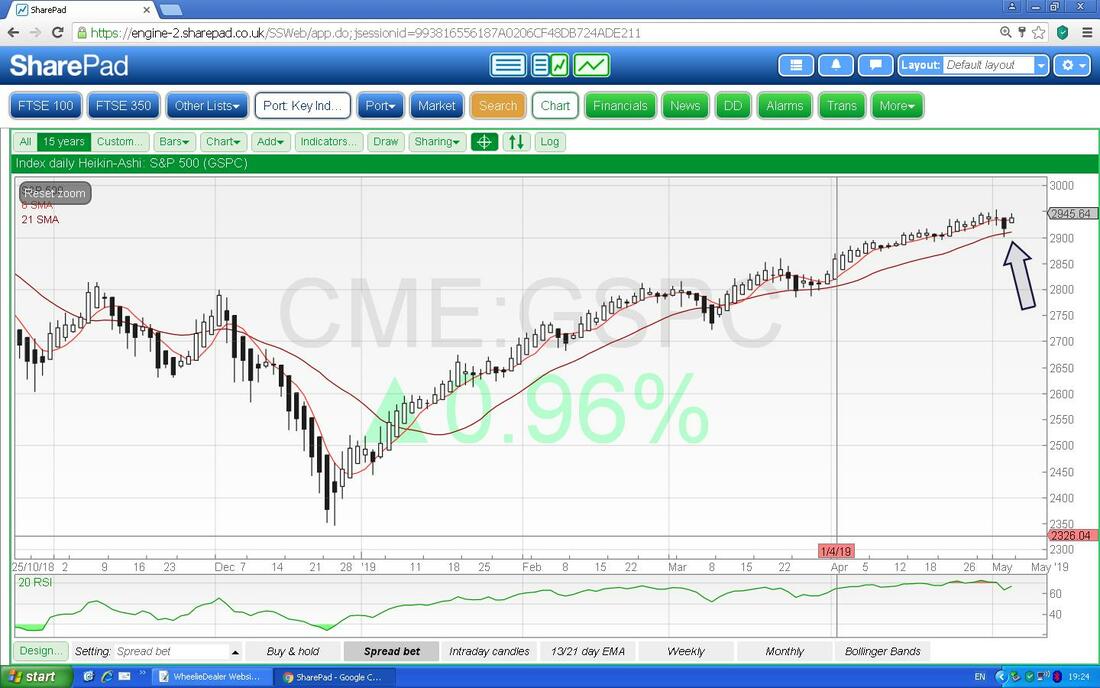
Next we have the Daily Heiken Ashi Candlesticks. These things are different to the ‘normal’ Candles I show and are created from average readings over 2 days. Where my Black Arrow is we had a Big Black HA Candle on Thursday but it then turned to a White HA Candle on Friday - it is early days and at the moment the HA Candles are really saying “do nothing” (best translated as “go to the pub“).
Please ignore most of the stuff on the next Chart, what I want to show here is how the 13 and 21 Day Exponential Moving Averages are lining up. These are one of my favourite Indicators and the Crosses they make are highly predictive, clear and reliable. At the moment the ‘faster’ 13 Day EMA which is the Black Line is above the ‘slower’ 21 Day EMA which is the Black Line (by the way, an EMA differs to a ‘simple’ MA because it puts more weight on recent values when calculating the moving average) and at the moment it is Bullish.
If you look where my Red Arrow is we had a Bullish EMA Cross and that is still ‘in force’. For things to go properly Bearish (and I would probably Short more with a strict Stoploss if it happens), we need a Bearish Cross like what happened where my Black Arrow is in the Top Left Hand Corner of the Chart. 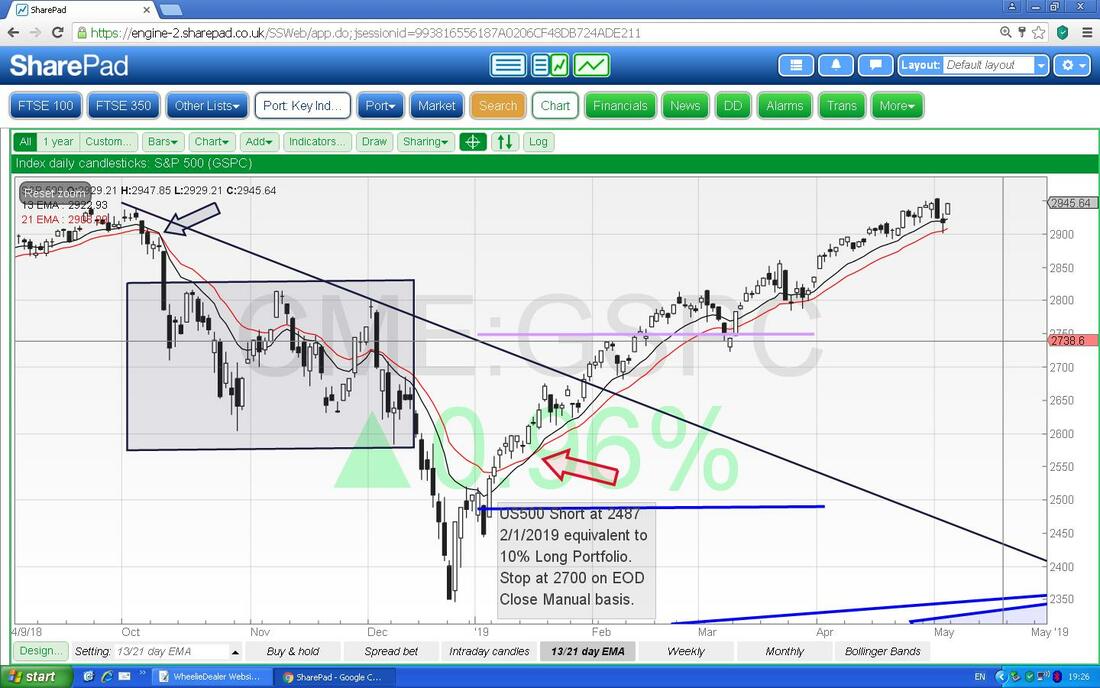
Next we have the Weekly Candles for the S&P500. One of the bestest things about Candlesticks is that they are ‘fractals’ which means that they work on any timeframe - I have seen Quarterly Candles being used and in theory you could do Yearly ones and even Decade ones !! And to show their versatility, you can do 1 minute ones……….
Where my Black Arrow is we have what sort of shapes like a Hammer Candle which you might think is Bullish but in the context of the strong run up, I think this is probably Bearish. Or put it this way - if we don’t turn down here, the fact we had a very choppy Week and it Closed at a similar level to the Open actually shows Bulls and Bears are fighting hard and Bears could easily take control soon. 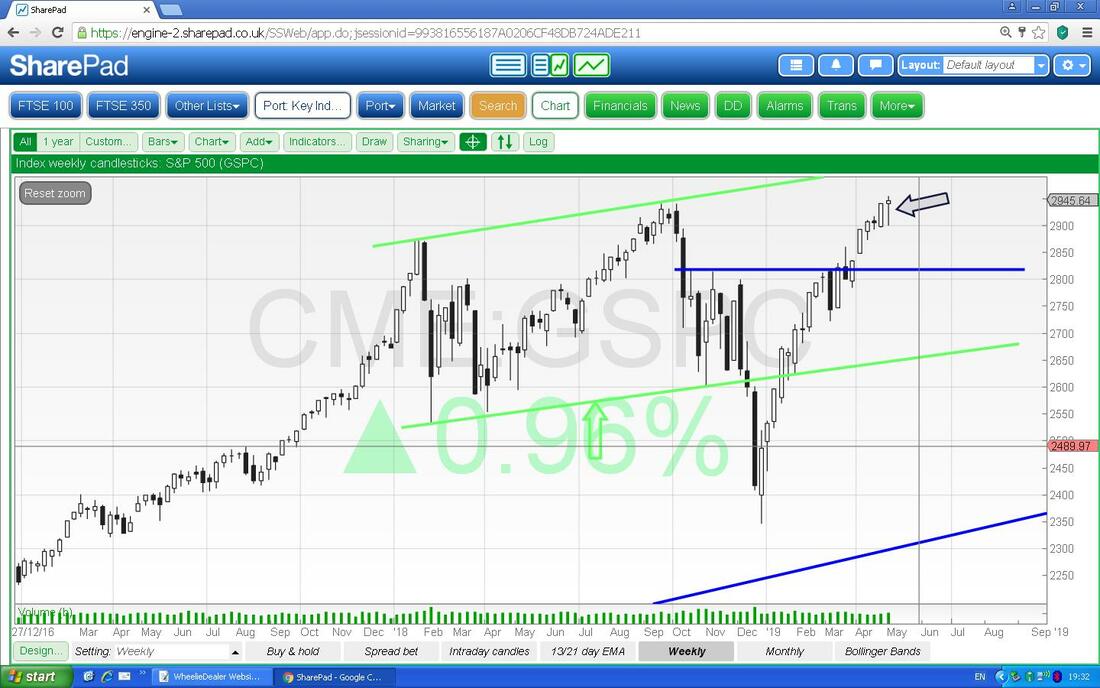
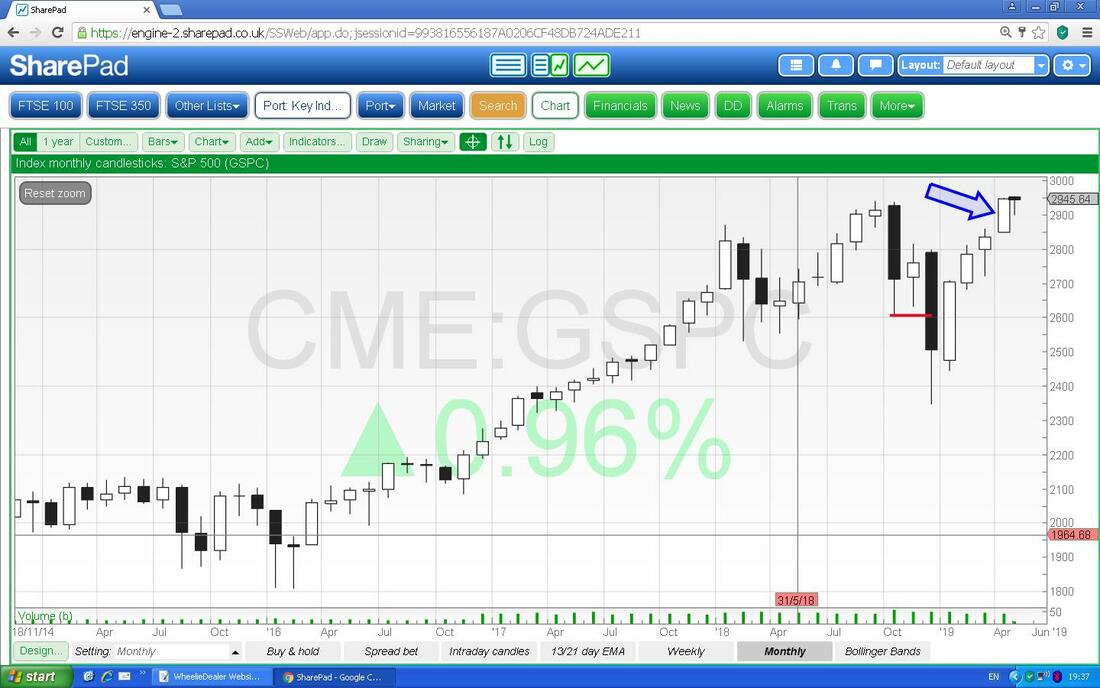
With April now complete we can look at the Monthly Candles and see what they are telling us. My Blue Arrow is pointing to a Big White Up Candle and this is Bullish. Ignore the little Black Candle which is shaping up for May - it is not valid in any way until May is complete. That one could be interesting !!!
Next we have the Daily Candles for the S&P500 with the Pink Zone marking the Upper and Lower Bollinger Bands. Where my Black Arrow is we are nearly up at the Top BB and this suggests the upside might be limited in coming Days.
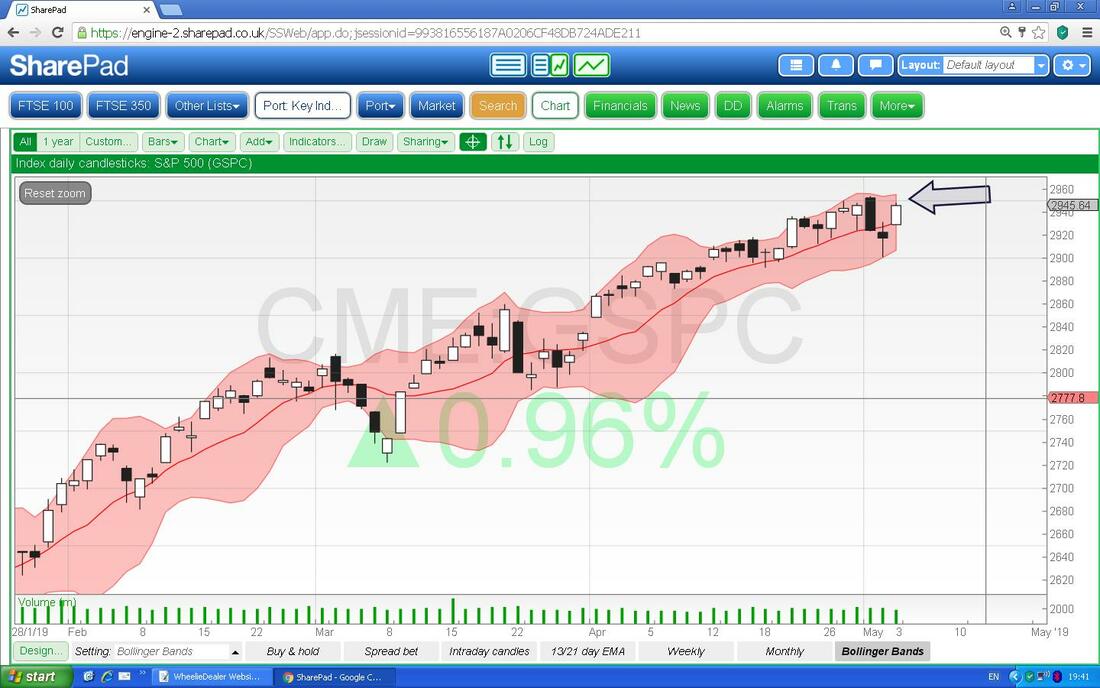
I won’t show it here for time reasons, but I must point out that the Nasdaq Composite made new All Time Highs last Week and that is very Bullish behaviour and might drag the S&P500 up with it if it can keep being Bullish.
FTSE100 This Screen is hugely messy because it is my ‘working’ Chart. Anyway, what I just want to show here is that we are coming up to the Big Zone of Resistance which is encapsulated within my Black Ellipse which runs up to the All Time High at 7903. Next look at my Blue Arrow - this is pointing to a Bullish ‘Golden Cross’ between the Darker Blue Line which is the 50 Day Moving Average and the Lighter Blue Line which is the 200 Day MA. I find these Crosses not hugely reliable as they are very ‘slow’ but on balance this is of course a good sign for Bulls. Note that the Darker Blue Line 50 Day MA could act as Support now. 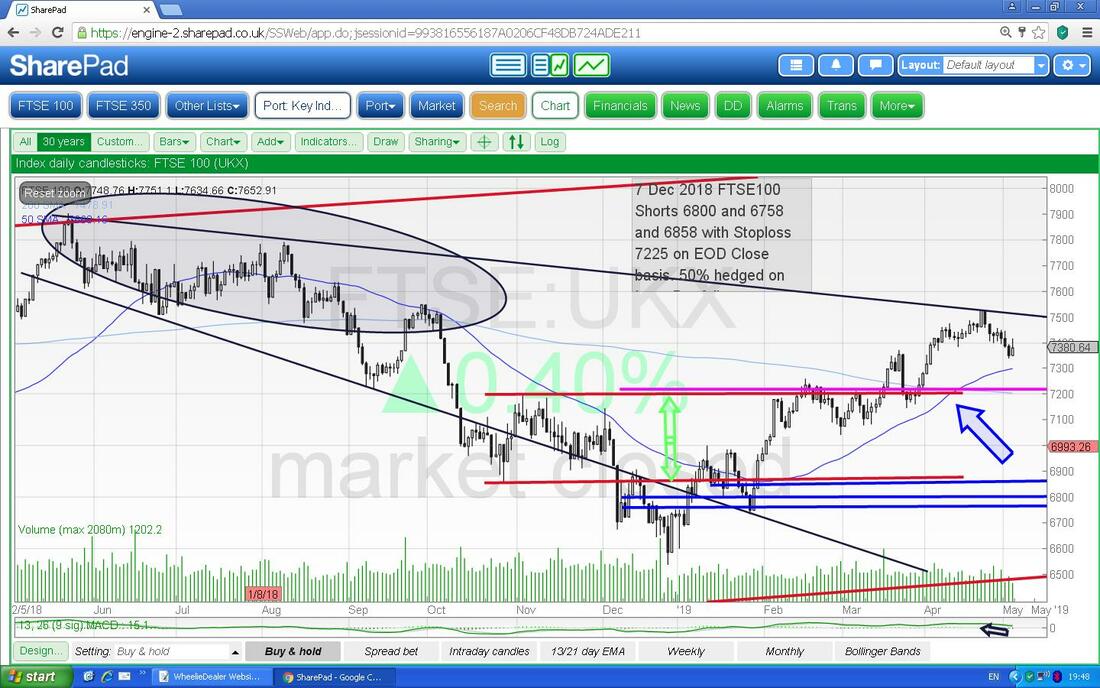
I have now zoomed in on the Chart I just showed with the Daily Candles and where my Red Ellipse is I am trying to capture a pair of Candles where we had a Big Down Candle on Thursday but then on Friday we got a White Up Candle although it did drop away from the High of the Day. It looks to me like it might be trying to turn up again but the best way to track this is to watch the Support from Thursday which is at 7339 - if that Level fails to the downside, then we are going lower.
To the upside, the High nearby is 7529 so we need to get over this. 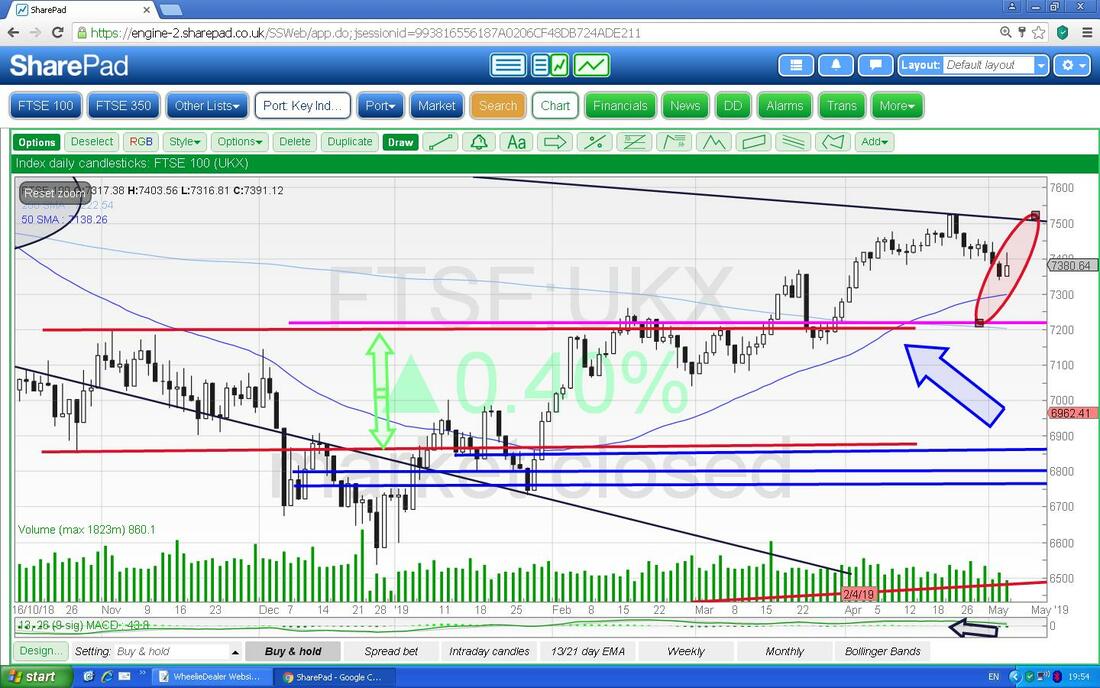
In the bottom window below we have the RSI for the FTSE100 Daily. On a Reading of RSI 54 where my Black Arrow is, we are at a ‘Neutral’ level and it doesn’t tell us much.
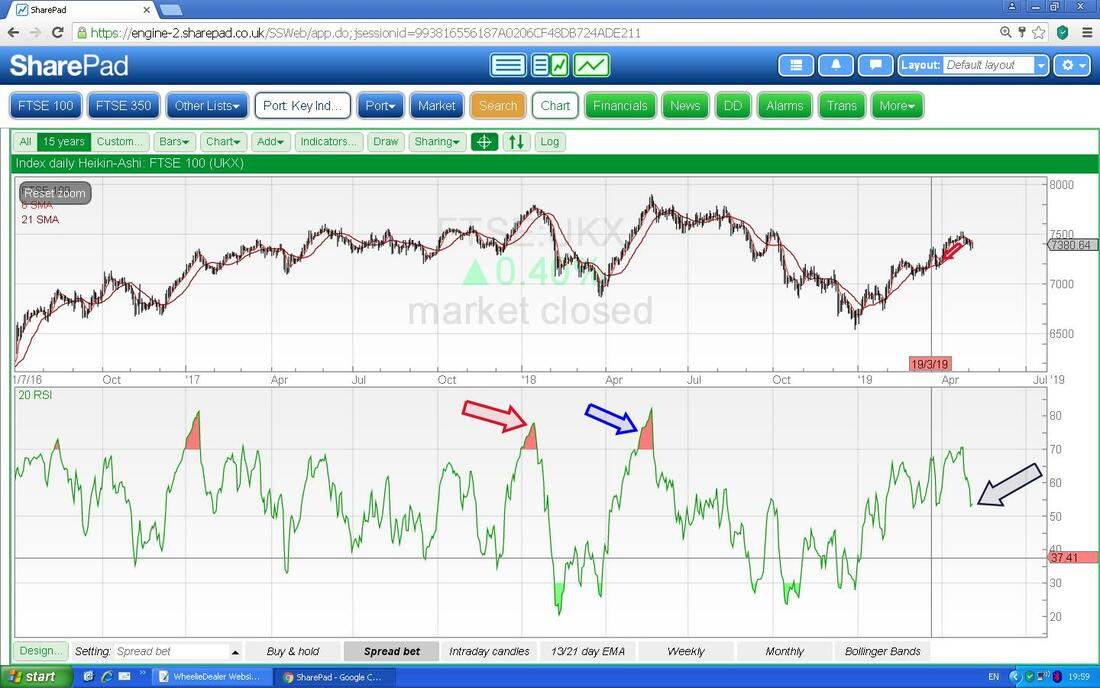
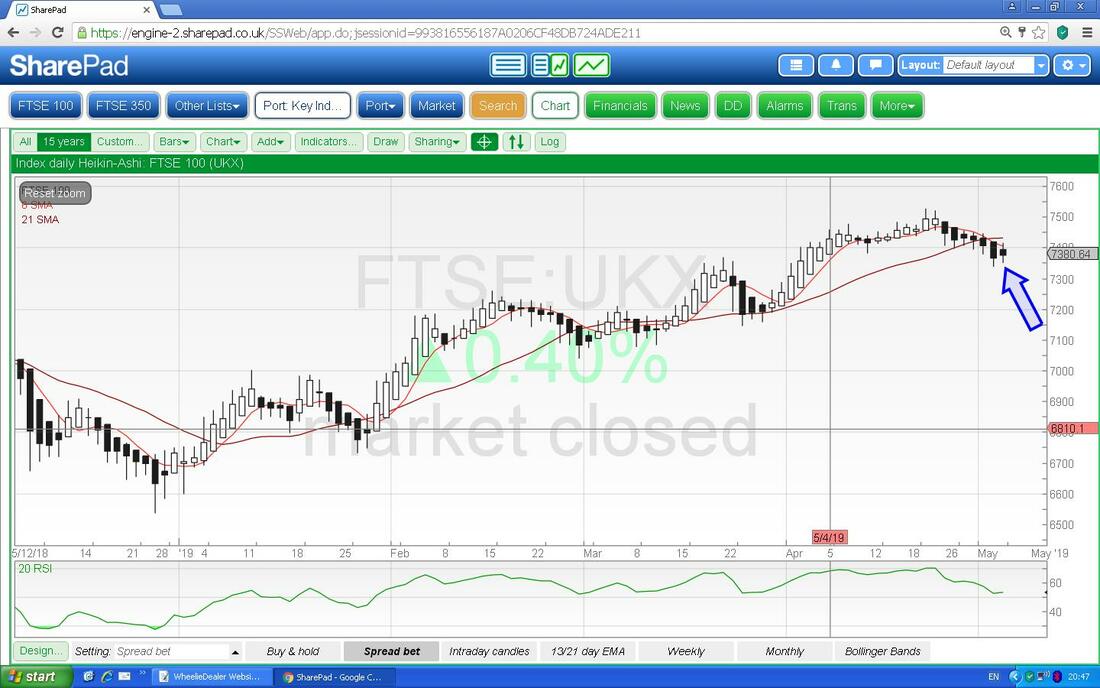
Next up are the Daily Heiken Ashi Candles. My Blue Arrow is pointing to where we had a Black Down HA Candle on Friday which followed a succession of Black Down HA Candles but note that the HA Candle on Friday has narrowed. This suggests that the move down might be waning and now you need to look for a change of colour to White HA Candles. A Big Black Down HA Candle now would signal more falls are most likely.
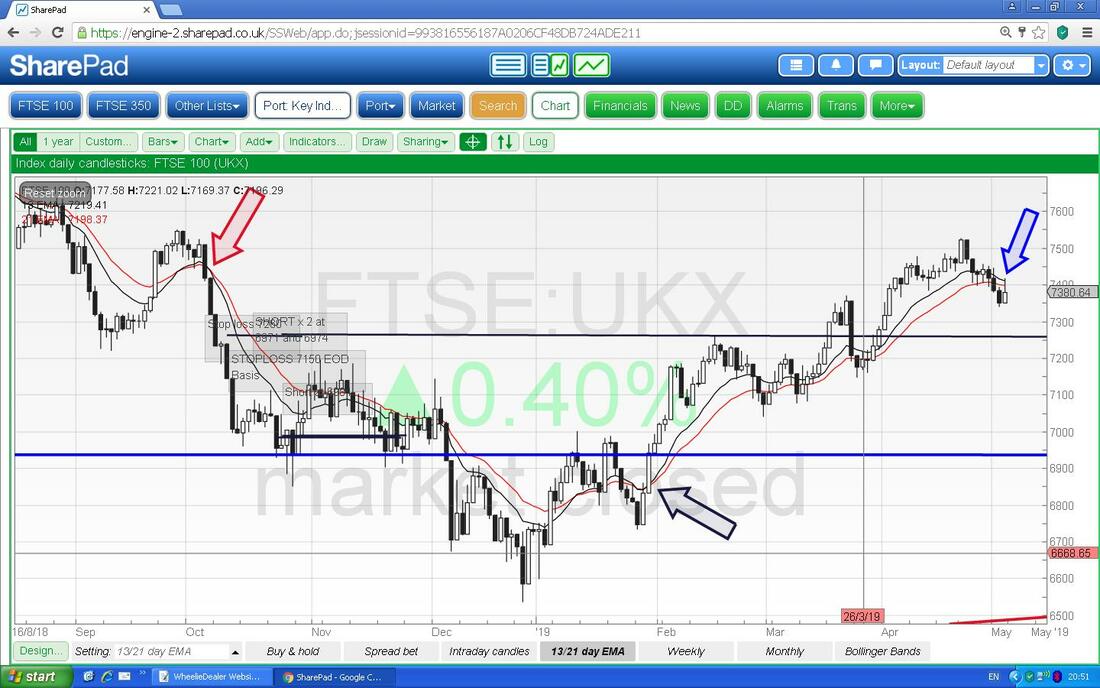
Next we have the 13 and 21 Day EMA Lines and where my Blue Arrow is the ‘faster’ Black Line which is the 13 Day EMA has dropped down towards the Red 21 Day EMA Line. If they cross, then this would be Bearish and reverse the Bullish Cross which has been in force since my Black Arrow. A Bearish Cross now would look like the one where my Red Arrow is and would probably mean considerable falls ahead.
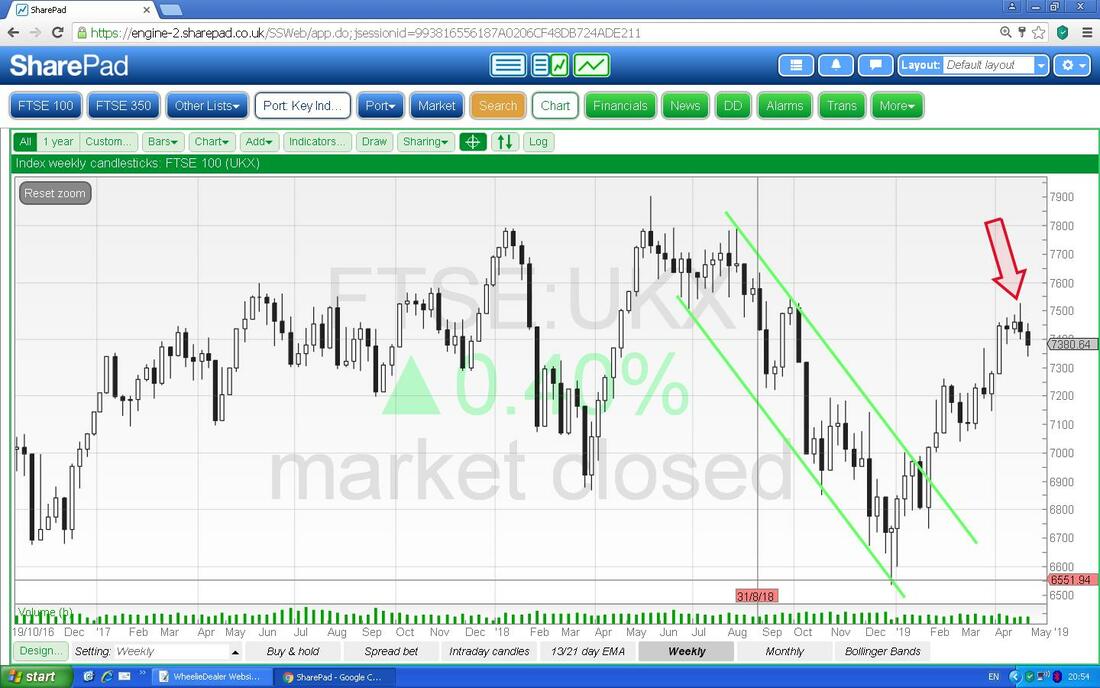
Now we have the Weekly Candles on the FTSE100 and this is a little more concerning than what we have seen up to now. My Red Arrow here is pointing to the ‘Inverted Hammer’ or ‘Shooting Star’ sort of Reversal Candle from the Week before last and this looks like a Turning Point to me. Then the next Candle from Last Week is a Down Candle but it does have long Tails - this looks bearish if anything.
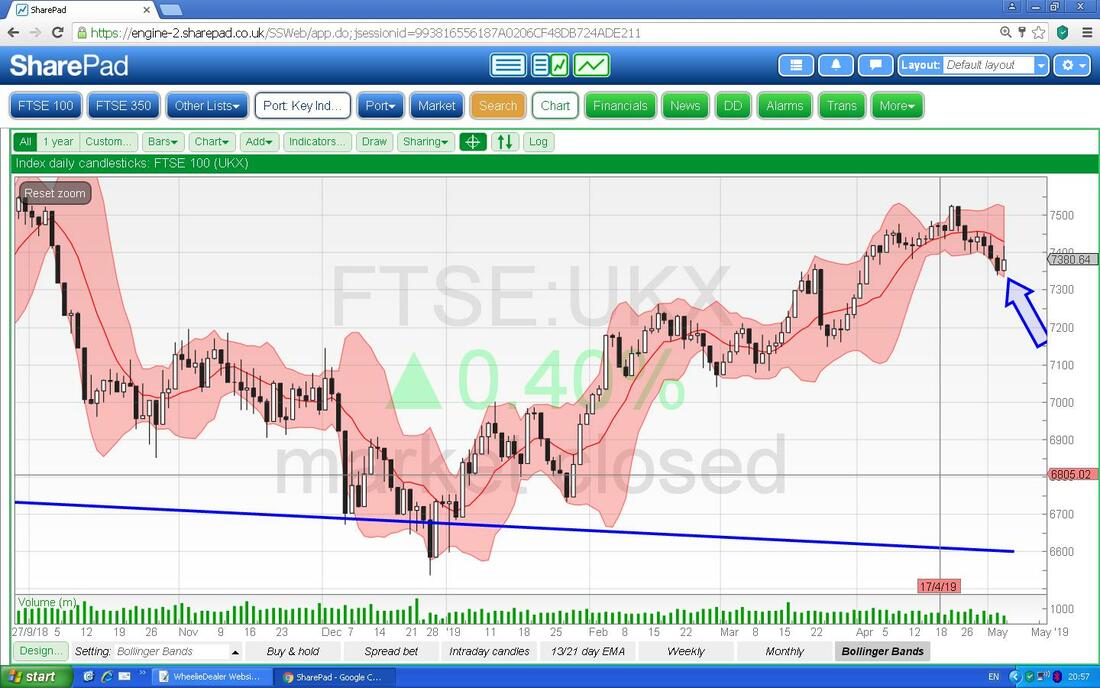
Next we have the Daily Candles for the FTSE100 with the Pink Zone marking the Upper and Lower Bollinger Bands. My Blue Arrow is showing where we had dropped back to the Lower BB and then on Friday we turned up off it - this suggests we might be turning up (note, this seems in conflict with what I just said on the Weekly Candles but it is very possible for us to move up on the Daily, which is of course a shorter Time Period, and then by the time the Week has formed up to be actually lower).
The last Chart I will show tonight is the Monthly Candles for the FTSE100. My Blue Arrow is pointing to a White Up Candle for April but note it closed way off the High of the Month. This is not a classic Inverted Hammer which would be obviously Bearish but it does show weakness. Ignore the little Black Candle that is forming up next - this is May’s Candle and doesn’t count until May is over.
OK, that is it for this one, I hope you have a prosperous and enjoyable Week ahead !! Cheers, WD. 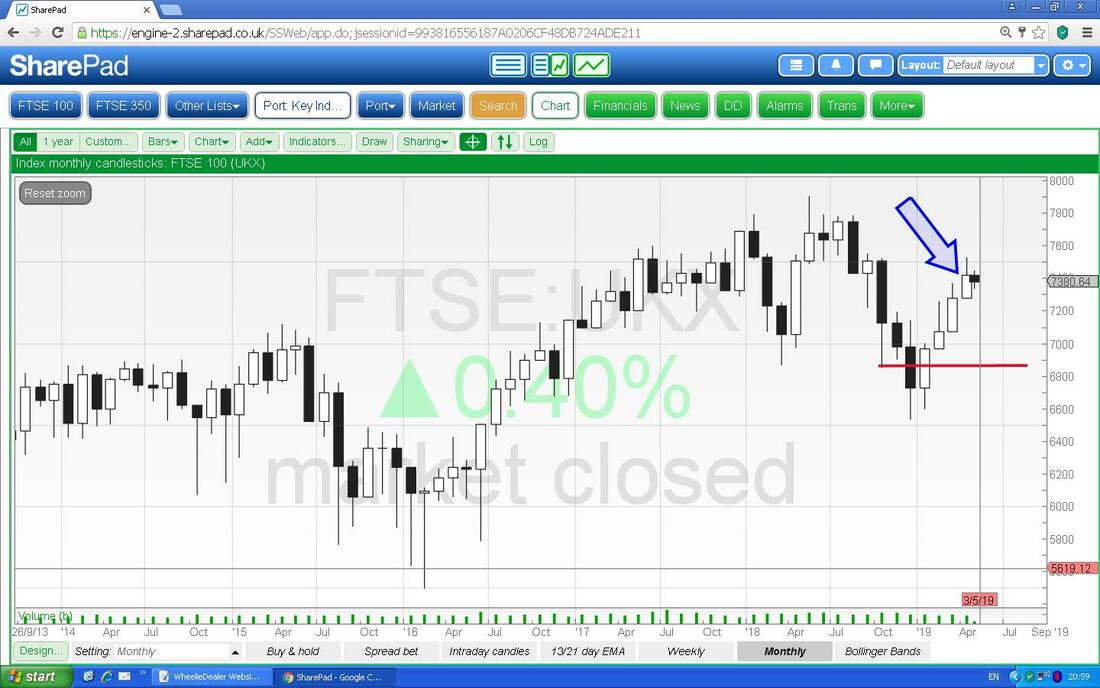
0 Comments
Leave a Reply. |

Stocks & Markets WheelieBlogsThese tend to be more Markets and Stocks related and timely - the Blog Page on the Main WheelieDealer Website has the 'Educational' stuff (well that's the theory anyway !!). Archives
October 2021
Categories
All
|
