

|
stocks & Markets blog |
|
I’m going straight into the ‘Last Week’ bit tonight as I want to run through my current thinking around my Hedging Strategy as this has evolved over the last Week or so. At the Close on Friday my Portfolio was down 1.1% for the Week and the damage was done earlier in the Week and then we had a ‘weird’ Friday where the Indexes rallied really hard all day and of course this hit my Short Positions a lot (I have Shorts on the FTSE100 and the S&P500) and overall for Friday I ended up flat because my Long Positions balanced it out.
Friday helped to refine my thinking on the Hedges because I ended up down the Pub (I fully recommend this to everyone as the proper way to use a Friday !!) and it was quite perplexing to be seeing the Indexes rallying so hard and thinking of the damage this was inflicting on my Short Positions (obviously I would prefer the Markets to fall for those Positions !!) but in the cold light of day I am much more relaxed about it as I will explain.
It has been crucial for me to ‘Go back to basics’ (not in a John Major sense though !!) and to think about why I Hedge my Portfolio and what drove me to have Hedges in place now. If you read the ‘Educational Blog’ I published a couple of Days ago, then you may have seen the Section in that Blog about Hedging and how I use it to reduce my Long Exposure when I see trouble very near ahead and I do this in preference to Selling Individual Shares and breaking up my Portfolio.
This is precisely the situation we are in today. The UK is in the midst of a Political Crisis around Brexit and it could easily become much, much, worse with a ‘Crash Out’ No Deal being something that I think could be hugely damaging to the UK and EU Economies and in the process it could also smash Stockmarkets to bits. And there is no way the US Stockmarkets could avoid this as inter-dependencies and correlations are so close in the Modern World. It is important to realise that a ‘No Deal’ Brexit is the default option and it happens unless T May’s joke Deal or a different Deal is agreed by all concerned and most importantly any Deal comes with a Transition Period. The UK Legal position is that we leave the EU on the 29th March 2019 unless an extension is gained - but T May is making no efforts to get such an extension and she sees it as not in her interest to do this because she wants the pressure of time to squeeze down on both the EU but more importantly upon MPs to make them sign up to her Deal. There are some Political machinations going on by the likes of Dominic Grieve and Hilary Benn (his Dad would be ashamed !!) to try to force T May to go back to Brussels and ask for an extension but that is pretty ludicrous because even if they can ‘force’ her to do this by Law, there is nothing to say the EU will agree and we know how useless T May is in Negotiations so she will no doubt go there all meek and pathetic and just roll over to whatever the EU want anyway. To be clear, I am still of the view that a ‘No Deal’ Brexit would be fine if it came along with a Transition Period - but again we have no evidence of that happening or that the EU would have the good sense to agree to it. Even if we avoid the likely huge damage of a Shock No Deal Brexit, there are plenty of other potentially nasty events that could occur such as a General Election which could stoke fears over a Corbyn Government or perhaps such dangers as Article 50 getting extended but then triggering Protests in major Cities along the lines of the ‘Yellow Vests’ Protests in the France with unrest and violence being pretty likely as well. Such a fragile and volatile Political backdrop could easily impact hard on Stockmarkets and it would again give Consumers reason to rein in their spending and for Businesses to be cautious and curtail Investments. Such action could easily help push the UK into Recession and I have never known a Recession have a rising or even flat Stockmarket. There are problems everywhere when you think about Stocks. For example, even if Brexit got cancelled and we avoided huge Right Wing Riots, then the rise in the Pound as a consequence could easily hit the FTSE100 and cause Stocks to fall - there really are few ‘good’ Outcomes when it comes to holding Stocks at the moment. And this is before I have even mentioned how Germany seems to be very near Recession and that kind of problem is leaking all over the Eurozone with Southern Economies like Italy showing barely any growth and France is teetering on the brink and of course the Civil Unrest there cannot be helping. The US seems to be doing ok but it is hard to see how this can persist if we go into Recession in Europe and of course there are fears around China - but then again there always are. The other big ‘Heffalump in the White House’ is the Mueller investigation into Trump and it must be highly possible that some Bad News for Trump will come out on that soon and then the Democrats will move to Impeach him (dunno why but I have now got thinking about the ‘Orange’ President being im’PEACH’ed and it all sounds quite fruity !!) and it is hard to see how US Stocks can do well if that happens and of course we might then see Civil Unrest in the US as Trump’s Supporters get a bit upset. I’m not sure the US really needs another Civil War…….. So, with all this Risk as the backdrop, my only conclusion is that I could either Sell a load of my Shares and increase my Cash levels or I can Hedge my Portfolio and that is exactly what I have done. This has another implication though and that is around the use of a Stoploss and I am starting to think that is unwise now and I should keep my Hedges in place until we have clarity. The thing about the Hedges is that they are not costing me Money and on Friday despite the Bounce in the Indexes my Portfolio was flat on the Day although I would have gained a small bit on my Income Portfolio which I don’t bother looking at in my Daily Numbers. This means that my Hedges should not be Closed due to hitting a Stoploss Trigger, but they should be Closed on an ‘Event’ Trigger - in other words, if a Shock No Deal is avoided, then I should probably Close the Shorts and the other Risks I can consider after doing this. There are plenty of other problems as I have related but the big Danger at the moment is a Shock No Deal Brexit. For now I will keep the Stoploss Levels on my Charts and use them as a reminder to make me think about the situation if they get hit. It could well be that the Market in such a case would be telling me that the Risks have reduced and I should go fully Long - so hitting them would be a good point to weigh everything up carefully although of course I will be thinking about it pretty much all the time. To add emphasis to that - I reckon it is important that I think of my Index Shorts as a way to Hedge my Portfolio and avoid ‘moving into Cash’ by Selling Shares. I should not think of the Hedges as Individual Trades in themselves - they are really a tool to help me lower overall Risk. Another angle we have on all of this is that the Charts broke down technically at the end of 2018 with important Ranges being breached to the downside and since the Low in late December we have had a good bounce, especially in the US. However, it looks like we might be getting to the end of the bounce now as we get back up to those previous Ranges and that could be a natural point for the Markets to turn down again. It strikes me that Friday’s big move could easily turn out to be a ‘Blow-off Top’ where we have a final flurry and last ditch ‘hurrah’ from Bulls before the rally runs out of puff and drops back again. It is the opposite of a ‘Capitulation’ Sell-off at a Bottom where we get a huge spike in Selling to clear out the final Bulls. In the case of the Blow-off Top, there is a spike in Bears as they close out their Shorts etc. Anyway, I will look at the Charts in a bit and see what they are saying. Something else to consider is that US Valuations especially on the Nasdaq Technology Index look crazy really - I think the correction to their over-valued state that started in the back end of 2018 is not over yet and the most likely path from here is more downside I suspect to get Valuations more into line with where they should be. So bearing in mind the above, my Strategy remains unchanged (Led Zep would say “The Song remains the same” and T May would say “Nothing has changed…….Nothing has changed……”) and I will be staying Hedged and not Buying anything until we have some certainty and I might Sell the odd thing if I see the opportunity etc. Until we have a good steer on what is happening in the Big Picture, I am happy to stay in a situation where my Hedges mean I have very little exposure to Stocks. Blog Slate As I hinted above I published Part 5 of the ‘Moving into Cash’ Blogs last Week and I still have one more to go because it has morphed into 6 parts and I hope to get that ‘Conclusion’ piece issued later in the coming Week. I did some work on the Macro-Economic one I have in draft form and I noticed I have several other Blog Drafts in reasonable state so I should be able to keep dropping them out in coming Weeks. I have mentioned recently how I would like to do a ‘Stock Blog’ but although I have one or two in mind I am not in a position or mood to Buy anything so I am not all that fired up about writing them. As a result, if another idea comes up then I might end up doing that instead and when I was in the Pub on Friday my mate asked me about the mechanisms which take place when we do a Trade and how the Market Makers operate and why this makes the Price move and suchlike and it strikes me this is an area which almost nobody understands and I was thinking that I could produce a Blog on exactly this. However, I explained it using a theoretical Company which had say 20 Shares and they Floated at 100p each and then the interactions that made the Price move etc. but this would need diagrams to produce a Blog and it will be very hard to write. I quite fancy the challenge though and with my newly discovered Microsoft Paint skills I might be able to do it - we shall see. I need to think about it and probably write out a ‘Storyboard’ on paper with regards to what Drawings I need to create so I can explain it simply etc. - so it needs a lot of WheelieBrain power !! I updated the ‘Little Black Book’ last night as well and you can find this sat on the WD2 Website - if you go to the Main Homepage then there is a Button at the top which you can click and that will take you to the correct page. The LBB has lots of Stock Ideas that need lots of research but these are a starting point of things that I think look interesting. It is actually a copy of the Notebook I use myself for noting down appealing Stocks I come across as part of my daily routines. Of course you are reading this ‘Weekend Markets Blog’ on WD2 so if you go to the Dropdown Menus up above you should be able to find the LBB page quite easily. I know my Websites are horrendously confusing but I can be confident in saying that they are not going to change again in their structure for a long, long, time !! I have a couple of Blogs produced for ‘Non-Finance Books’ as well which might appear in coming Weeks if I can get around to them. Blast from the Past In case I whetted your appetite with my comments above about a possible Blog on the mechanisms behind why Prices move, here is a Blog I wrote ages ago which is related to this subject: http://wheeliedealer.weebly.com/educational-blogs/why-do-share-prices-rise-and-fall I know I put that one in a Weekend Blog recently so as a Bonus here is another one to bring back some memories and this one is a bit unusual because it was a ‘Guest Blog’ from back in the day….. http://wheeliedealer.weebly.com/educational-blogs/guest-blog-to-understand-the-future-you-must-know-the-past In case you are new to the whole WD bunch of silliness, then you might not have noticed the huge Blog Archive that has built up over the last 4.5 years or so and if you go to the ‘Blog Index List’ on the WD2 Website, then you should be able to find loads of Blogs that you might find worth catching up on. Better do some Charts then and I think there will be some interesting developments on them. S&P500 My Shorts are on the S&P500 and the FTSE100 so I will focus on those in this Blog. As always the images are ‘Screen Scrapes’ from the superb SharePad that I subscribe to and if you click on them they should get bigger so you can see the details (assuming I have set them up right of course !!). Last Weekend in the ‘Markets Blog’ I showed the ‘Big Picture’ for the S&P500 and this has not changed so I will not include it this Week - but if you want more context then skip back a Week and you should be able to see it. This first Chart on the S&P500 Daily is fairly ‘Big Picture’ and my huge Blue Arrow at the bottom is pointing to an Uptrend Support Line which runs from the 2009 Lows and this is an extremely important Line because if the Price falls below this Line then we could be in a full-on proper Bear Market (I’m not talking about the silly ‘20% down’ definition here - I am saying that if the Market drops through that Line then expect a lot more falls). This makes the 2345 Level highly important and it must stay above this to avoid trouble. Sorry about the guff on this Chart but it is my ‘Working Screen’ so I have some scribbles on it etc. Anyway, next look at the Black Arrow which is pointing to a ‘Death Cross’ between the Blue Lines which are the 50 and 200 Day Moving Averages - these are not the best Indicators but all proper collapses must involve one of these at some point. At the moment the Darker Blue Wavy Line which is the 50 Day MA is still falling. Next my Green Arrow is pointing to a Green Support Line which was the Bottom of a Range which includes the Green Line at the top - note we fell out of this Support Line at the end of 2018 and we are now back inside it which is a good development for Bulls - my Red Ellipse is trying to point out where the Price is now. Note the Lighter Blue Wavy Line which is the 200 Day MA and this could be strong Resistance up around 2750. 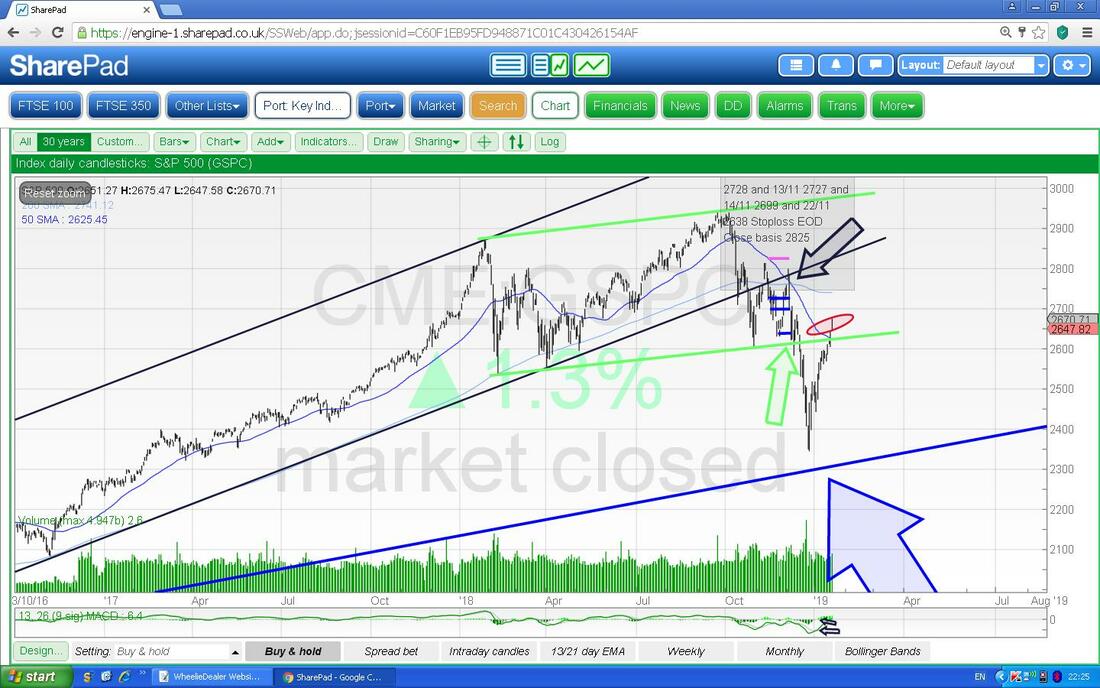
On the next Chart I have zoomed in and now I would like you to please ignore most of the mess on the Chart but focus on the Red Line and my Red Arrow. This is pointing to a Line which is Resistance and the S&P500 needs to get over this Line - it might struggle to do this. In essence it needs to get over 2700.
Now look to the left at the big Blue Ellipse - this is marking a wide Zone of Resistance and the S&P500 will probably find this difficult to get through. This runs from where we are now up to just over 2800. 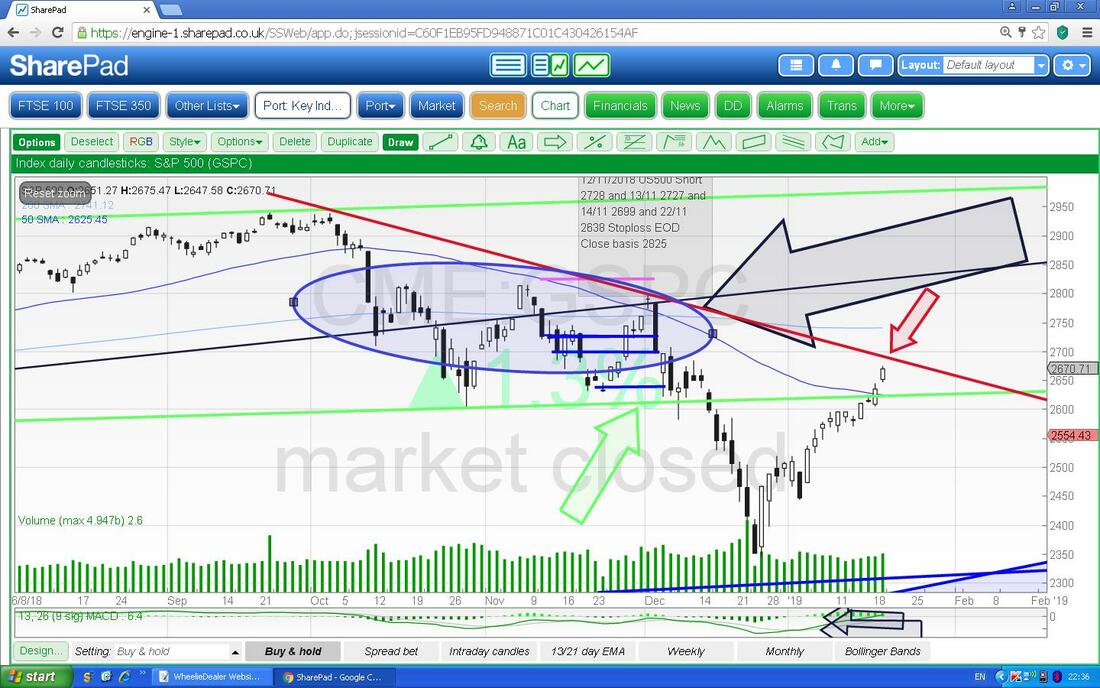
On the next Screen look at the bottom window which has the RSI (Relative Strength Index) for the S&P500 Daily. My Black Arrow is pointing to where we are now on a Reading of about RSI 57 and this is by no means a high Reading but note where my Blue Arrows are that we recently turned down before this Level and note also the usual convention of RSI 70 being where most things peak out is not far off now and a good Week ahead could easily get it up to this Level.
Note the US Markets are closed tomorrow - Martin Luther King or something. 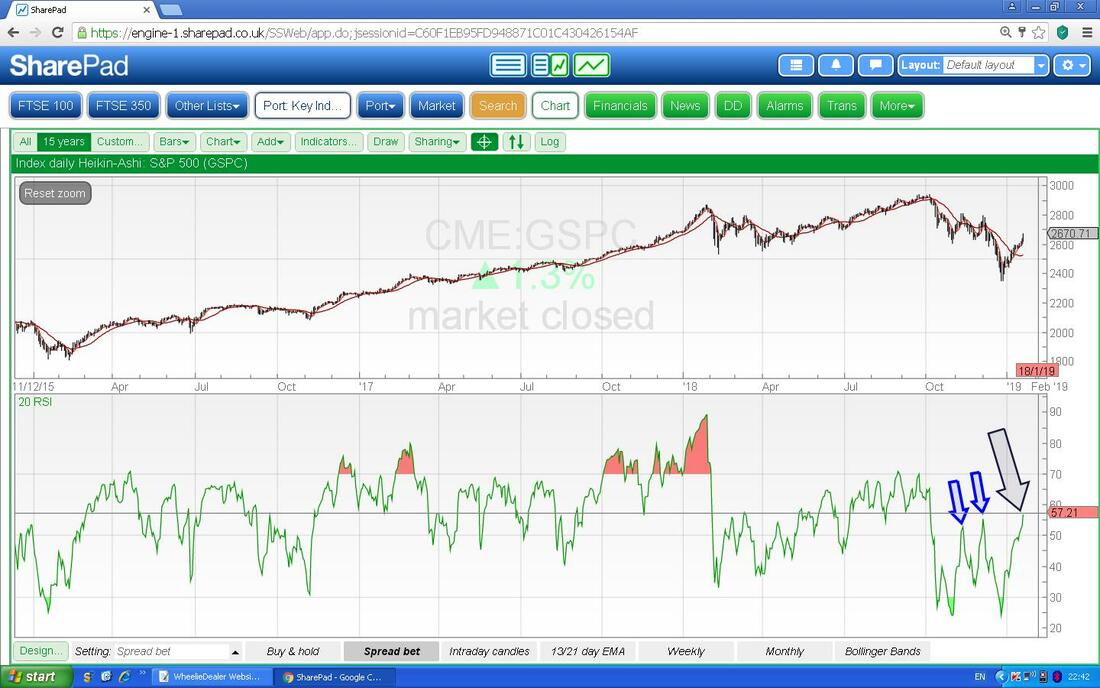
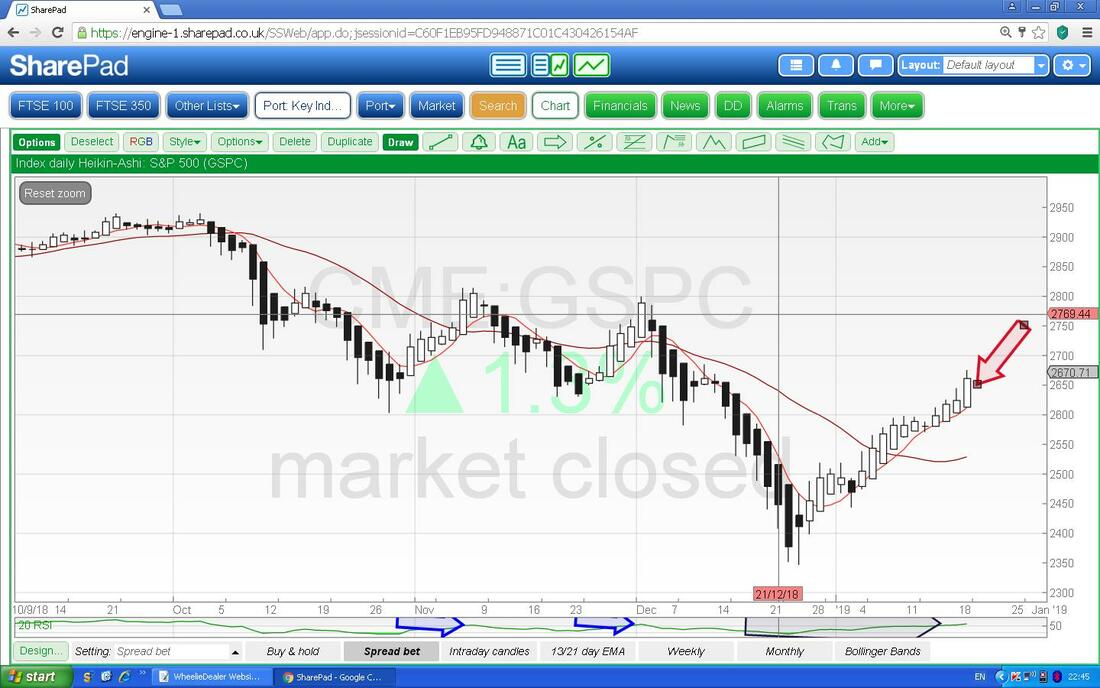
Next we have the Daily Heiken Ashi Candlesticks - remember these are different to ‘Normal’ Candles and they form up over 2 Days based on where they Open and Close and stuff. At the moment where my Red Arrow is the HA Candles are Big White and Bullish.
The next Chart is similar to what I showed Last Week. First off please look at my Small Green Arrow which is pointing to a Bullish Crossover between the 13 Day and 21 Day EMA Lines (Exponential Moving Average) and I must admit I hate being ‘Short’ against the Indication this is giving which is for more Gains. However, look also at the Black Line and this is similar to the Red Line I showed about 3 Charts back and this is an important Resistance Line. Note also the Box which is like the Ellipse from earlier.
At the Top on the left my Black Arrow is pointing to a Bearish Cross on the 13/21 Day EMAs and look how predictive that turned out to be. The Blue Horizontal Line is where I opened my Short and the Pink Line up at 2750 is where my Stoploss Level is (the Text in the Box is wrong now !!). However, as per my writings earlier in this Blog I am most likely going to keep my Hedges on until we are through the Brexit fiasco without a Shock No Deal. If we do ‘Crash-out’ on a No Deal, then those Shorts might be very useful…… 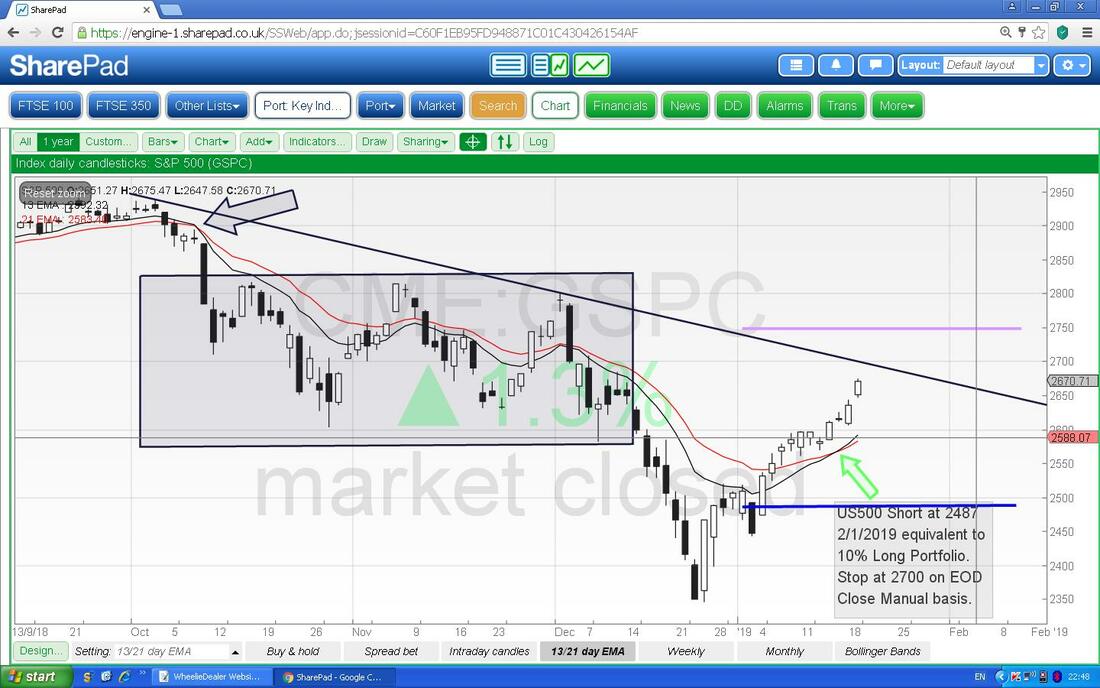
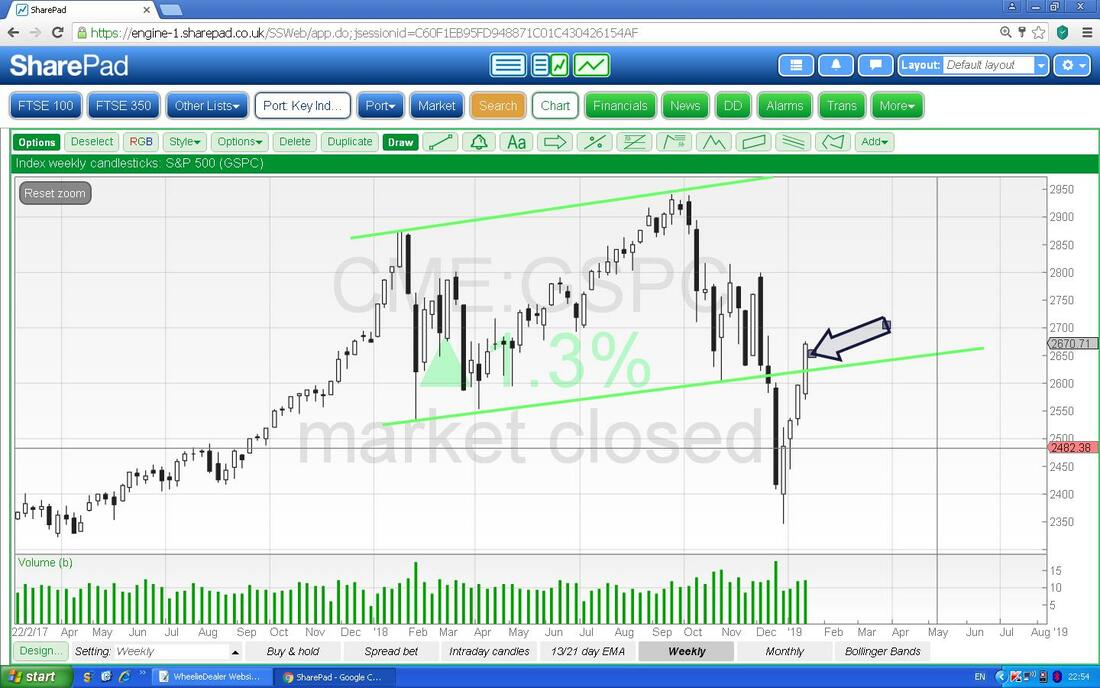
Next we have the Weekly Candles - my Black Arrow is pointing to a Big White Bullish Up Candle and this looks good for more gains on the face of it (it must be appreciated that a Week is a long time though and a Reversal can happen within a Week easily).
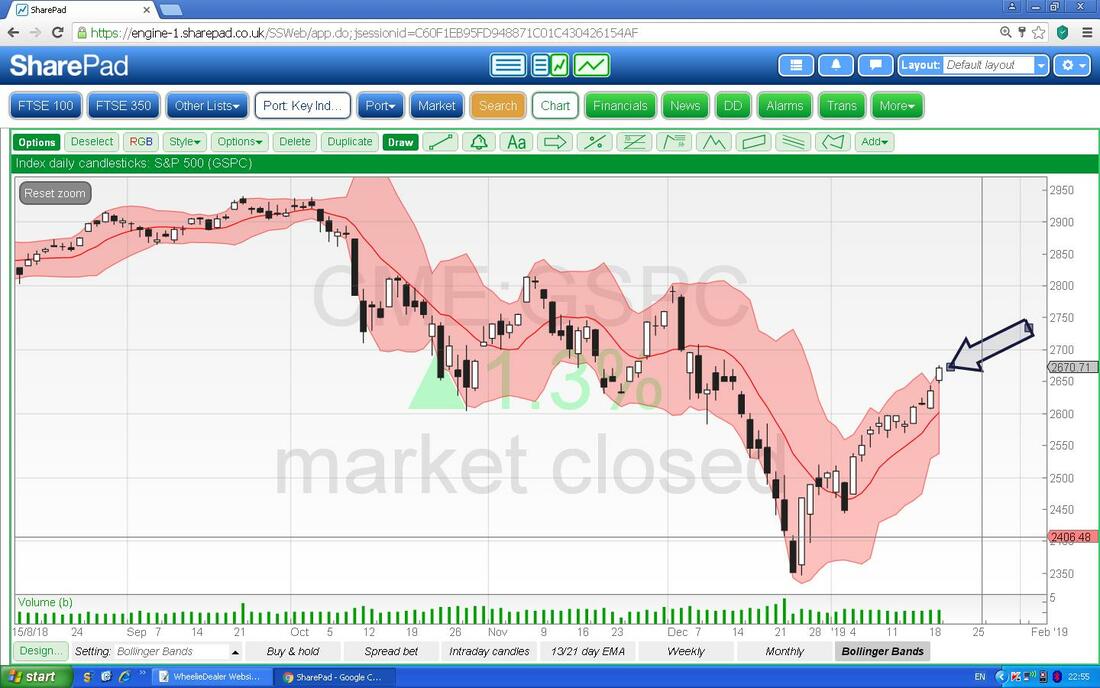
Finally for the S&P500 we have the Daily Price Candles with the Upper and Lower Bollinger Bands marked by the Pink Zone. My Arrow is pointing to where we are up at the Top Band and it could easily turn down from here.
Nasdaq Composite
I won’t dwell on this because it is largely similar to the S&P500 but my Arrow is pointing to a ‘Spinning Top’ sort of Doji Candle on the Nasdaq Comp from Friday - this could be a Turning Point or at least it is hinting that one could be soon. Note also it is at the Upper Bollinger Band just like the S&P500. The DOW is pretty similar to the S&P500 as well. 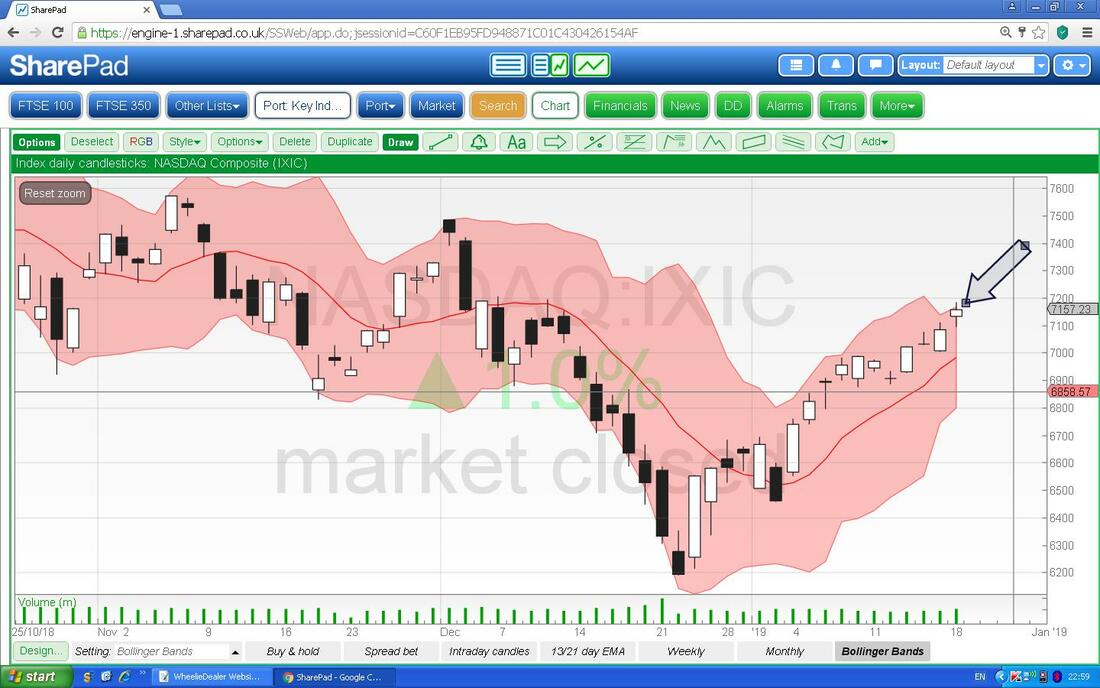
FTSE100
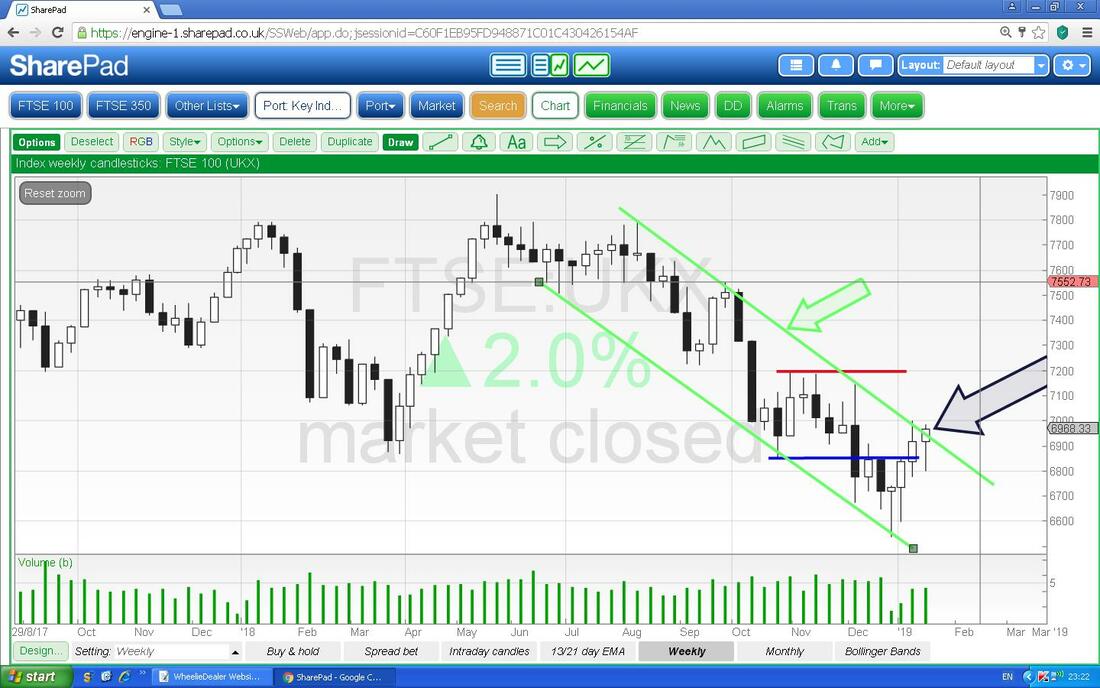
First off we have the Big Picture - please ignore most of it but just look at the Red Lines which are forming an Uptrend Channel from the 2009 Lows - as long as we stay within this Channel the Bulls should be ok (although of course we can have some nasty Drops on Pullbacks within this Uptrend Channel). 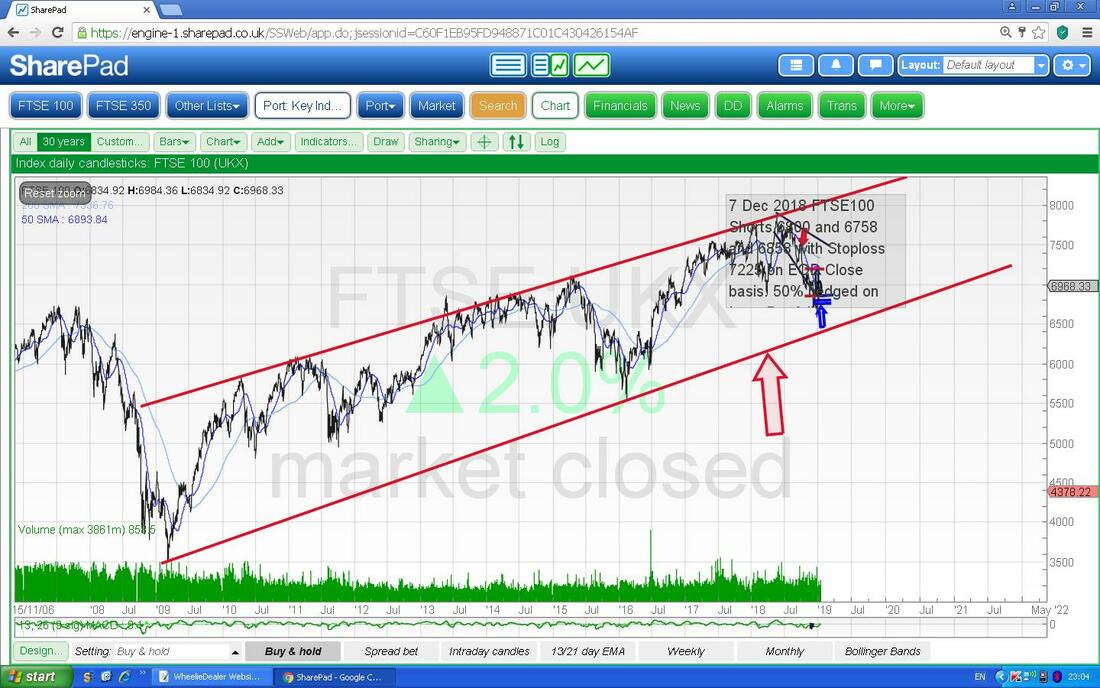
Now I have zoomed in but again it is my ‘Working’ Screen so it is a bit messy. First off the Red Arrow is marking a ‘Death Cross’ between the 50 and 200 Day Moving Averages and note the Darker Blue 50 Day MA Line is still falling and the Lighter Blue 200 Day MA is fairly flat but slanting down a bit.
My Green Arrow is pointing at the Big White Up Candle from Friday and this is Bullish in isolation. However, look where my Little Black Ellipse is which is trying to point out that 7000 is a Key Resistance Level. My Black Arrows are pointing out the Upper and Lower Lines of a Sideways Range between about 6850 and 7200 where the Red Horizontal Lines are. We are back inside that Range which is good but it must not drop below 6850 again. Note because of this Range there is a lot of Resistance from where we are now up to 7200. My Blue Arrow is pointing to the Blue Horizontal Lines which are where my Shorts were Opened and the Pink Line is my Stoploss. 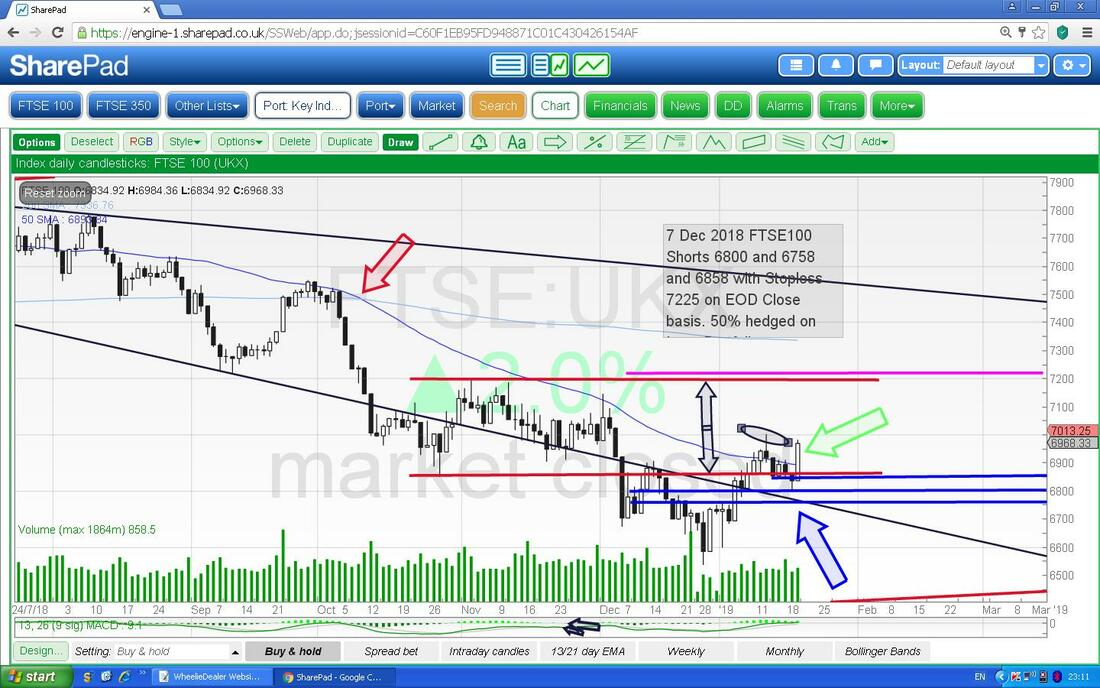
In the bottom window below we have the RSI for the FTSE100 Daily. A reading of RSI 52 is neither here nor there really.
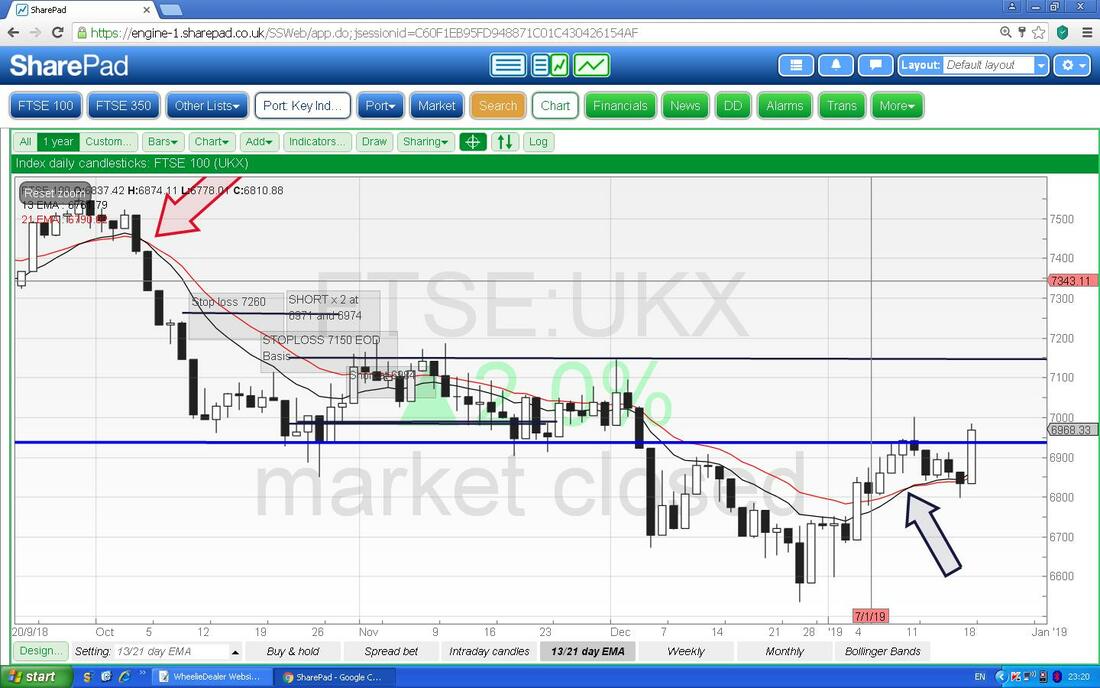
It’s not all that easy to see, but my Black Arrow on the Chart below is pointing to a Bullish Cross on the 13/21 Day EMA Lines for the FTSE100 Daily. This suggests more Gains.
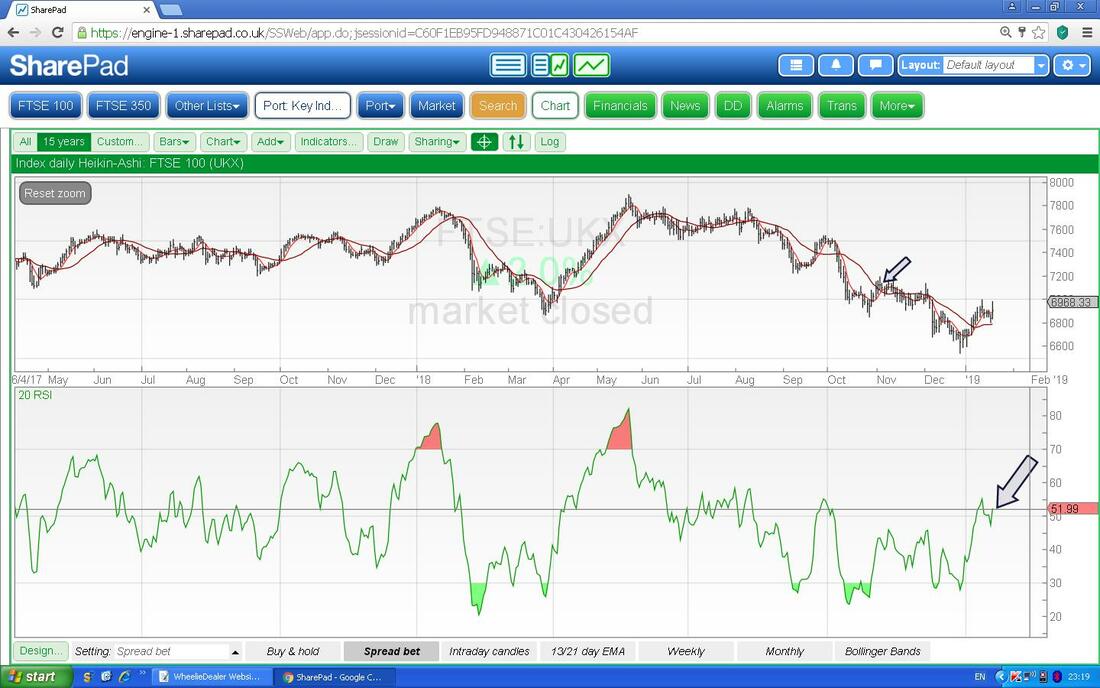
My next Chart has the Weekly Candles for the FTSE100. My Black Arrow is pointing to an Up Candle but note it is a bit of a Hammer and in an unusual context - I guess the real thing to focus on here are the Levels of 6800 at the bottom of Last Week and 7000 at the Top.
Finally here is the Chart of the Daily Candles with the Bollinger Bands. My Black Arrow is showing that we are up at the Top Band and it could turn down from here.
By the way, the FTSE250 is pretty similar to the FTSE100. OK, that’s it. Good luck in the coming Week and let’s hope we still have some sort of Government by the time I type next Weekend’s Blog !! Cheers, WD. 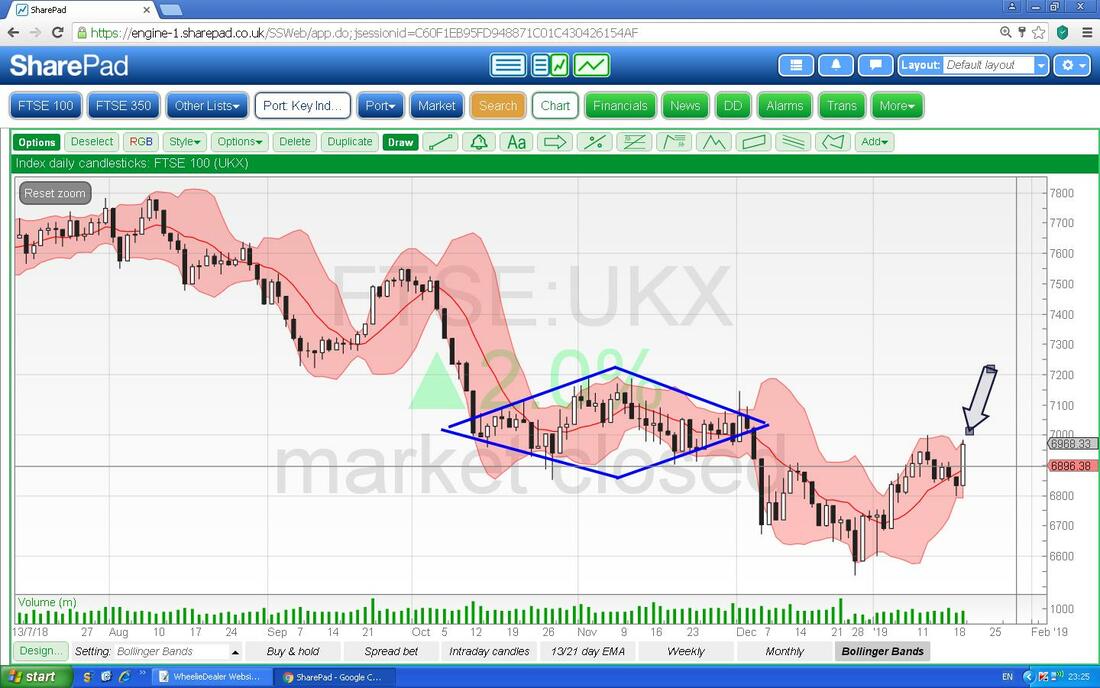
0 Comments
Leave a Reply. |

Stocks & Markets WheelieBlogsThese tend to be more Markets and Stocks related and timely - the Blog Page on the Main WheelieDealer Website has the 'Educational' stuff (well that's the theory anyway !!). Archives
October 2021
Categories
All
|
