

|
stocks & Markets blog |
|
I had to laugh when I heard this. It was said by Andrew Neil on ‘This Week’ from Thursday night on BBC1 when they were discussing the usual political farce and Miranda Green first off referred to “the Chukkas” when talking about the recent launch of the new version of the Tigger Party and then Mr Neil when on to say something like, “We used to think they were a triumph of style over substance but it turns out they had no style either…..”
Last Week / Strategy Well I am extremely pleased with how Last Week went for me and it is even more remarkable when you consider it was only 4 days !! (perhaps we could make every Week a 4-day one although many would argue that I only do 4 anyway as you won’t see me for WheelieDust on a Friday - unless you are in the Pub of course !!).
Mainly due to a Takeover Bid for KCOM and strong results and a big move up for Boohoo BOO, my Portfolio gained 2.7% for the Week and this has really transformed my Returns for 2019 so far with my Portfolio finally dragging its sorry arse into Profit and now I am sitting on a small gain of about 1.5% after a strange start to 2019 with my Index Hedges holding me back a lot. The picture is actually a bit better as well because I hold KCOM in my Income Portfolio (although in the big scheme of things this is not a big position) and I suspect this should have boosted that Portfolio nicely - last time I looked which was a few Weeks ago the Income Portfolio was up around 6% I think and it might be near 10% now. I might look when I do the ‘Weekly Performance’ update for April which I should get on to fairly soon. Whilst I think about it, with KCOM being removed from my Income Portfolio quite soon I need to start thinking about a replacement - a couple of candidates are VOD and TATE and I will come onto these later I suspect.
This turnaround has certainly got me thinking because for much of 2019 I have felt that my Portfolio was being dogged by the drag of a huge Anchor in the shape of the FTSE100 Shorts I had on and a smaller S&P500 Short (see my ‘Trades’ page for more specifics) and although my intention was to hedge around 30 to 40% of my Long Shares Portfolio, it seemed that in practice I had really overdone it and it was almost like I had hedged 110% of my Portfolio !! (in other words I had hedged so much that it seemed to be dragging me into negative Returns in a really strong upwards Market). Anyway, with the situation now being that I am up about 1.5% and then adding in a hit of over 4% which I have suffered from Patisserie Valerie CAKE going pop, then maybe the Hedging is not as extreme as I thought. If you add in the CAKE hit, on the basis that such a sudden one-off 100% Loss is highly unusual, then my Portfolio would be up around 5 or 6% which suggests that perhaps around 50% of my Portfolio is hedged - and this does not include my Income Portfolio so perhaps it is not as ‘out of balance’ as I have feared. Indeed, it makes sense that there will be periods of time where the FTSE100 and S&P500 are likely to perform ‘out of sync’ with my Portfolio of Stocks which is largely a mix of FTSE100, FTSE250, Smallcaps and AIM Stocks and these are in varying proportions in terms of Position Weights so a lack of close linking of how they move perhaps isn’t all that surprising. If I am right, then perhaps in coming Weeks I might see things change with my Portfolio doing a bit better although of course it might just get worse !! The real point is that over short Periods of time there might be a divergence from what I would like but over longer Periods maybe it will converge to more the 30 to 40% of Hedging that I desire. We shall see….. Oh, on KCOM I will do my usual thing of giving it a few Weeks and then selling in the Market. This gives a short while for another Bid to appear (I doubt it will in this case but I am happy to see how it plays out) and by Selling in the Market it removes the risk of the Bid falling through which often happens and if you wait for the Money to come through ‘naturally’ as the Takeover Process goes through the motions, you can end up waiting for ages and ages and worse still, on one Takeover I had years ago for Dmatek DTK, I had to fill out loads of Israeli Tax Forms which was ridiculous and a hassle I didn’t need. Took ages for the Money to appear as well. Market Environment In the coming Week we have the US Non-Farm Payrolls on Friday (this usually comes out at 1.30pm UK time and can chuck the Market around a lot on Friday afternoon) and as normal the Markets will probably be looking for about 200k Jobs to have been created for April. Apart from that it looks like there is quite a bit of Macro news as usual but probably the most important factor is that we are nearly in May and this is the 2nd worst Month of the Year historically as many Traders/Investors follow the old “Sell in May and go away and don’t come back until St Ledger Day” adage (I think St Ledger Day is in September and variations on this say don’t come back until Halloween - the end of October). Summer is by far the quieter 6 month period of the Year and I am sure I read/heard somewhere that the average difference of Winter over Summer is 8% which is a large number when you bear in mind that average Stock Market Yearly Returns are probably slightly less than this. As we will see in the Charts later, the Major Indexes everywhere look stretched to the upside and I would say some like Tech are simply over-valued. The Brexit silliness continues and it looks a dead-cert that the utter farce of EU Parliament Elections will take place in a few Weeks as the only way to avoid this is if Theresa May’s hopeless Brexit ‘Deal’ gets through Parliament which has a Snowball’s chance in Hell of doing so. The Talks with Labour are a total fig-leaf with no side doing it seriously and it is more about looking to be cooperative and reasonable and T May survived an attempt by the Tory Backbench 1922 Committee to change the Rules and enable a ‘No Confidence’ Vote on her ‘Leadership’ which means she could limp on to December. What a ridiculous situation when you have probably the worst PM this country has ever had and nobody can remove her from Number 10. It looks like the Council Elections which are coming up very soon will result in a huge defeat for the Tories and this will be a big signal to the Activists and MPs and the Cabinet that T May has to go. If she manages to get through this, then it is obvious the Tories will be destroyed in the EU Elections with Nigel Farage’s Brexit Party winning by a huge Majority and I simply cannot see how T May can stay in power after this. Expect a wipe-out. Donnie Tusk the President of the EU Council said that the UK should not waste the time provided by the Long Extension - he must be distraught and in tears because it is so clear that the Politicians are wazzing away the time and ‘nothing has changed’ since before the Easter Break - apart from the various idiots on all sides getting ever more entrenched. With this whole nonsense dragging on it might not affect the Markets too much although T May getting finally kicked out and a Tory Leadership election taking place might move the Markets because it could easily lead to a General Election and that would create yet more uncertainty. With how things are going, it is highly possible that any such nonsense could take place in late Summer and into the Autumn and this is a time when Markets are often quite wobbly - so we need to be on our guard for this. Motor Museum Meet-up For a while I have been mentioning that I intended to arrange a trip to the National Heritage Motor Museum in Gaydon along the lines of a similar thing we did at Duxford Aerodrome last year. Anyway, I can now confirm that the chosen date is Friday 12th July and I expect to get there around Lunchtime - between 12 and 1pm I reckon. The Museum closes quite early at about 5pm and it makes sense that if you can get there earlier then you can have a good look around before I get there - there is a lot to see !! Obviously we can see how things play out on the day but perhaps we could decant down the road to a Pub or something afterwards and I notice there is a Costa Coffee nearby which might give us a chance to chat more while the traffic dies down. As usual, everyone is invited and the more the merrier. Don’t worry if you think you are a Newbie or inexperienced or anything, these kinds of Events are much better when there is a mix of people and I assure you no one will be judging or anything. The cost of admission to the Museum is pretty reasonable and there is loads of parking space and stuff. You can find more details about the Museum here: https://www.britishmotormuseum.co.uk/ WheelieBash 2019 While on the subject of gatherings I have now updated the ‘Events’ page on WD2 with details about WheelieBash 2019 which will be near Windsor as usual and will be on Saturday 7th September. All the info you need is there I think and if you want to come (everyone is invited and you can come and go as you please and there is no Admission Fee or anything) then please email me or whatever so I can keep track of the numbers - we can fit in 60 maximum. Blog Slate I issued the final part of those Blogs on what I look for every morning on the Results Statements and Updates and this bit focused on a way to think about the Past and Future elements in Company News and it included the example of MPAC which I think is perhaps the cheapest Stock on the UK Market !!. Anyway, MPAC has its AGM this Thursday (as does Empiric Student Property ESP by the way) and if they provide an Update which is decent, then perhaps that will trigger the start of the Market waking up to the value here. I hold quite a few so I would rather like such an outcome !! I also updated the ‘Little Black Book’ with ideas for more research and there are some interesting Stocks on that list. I made good progress on a Blog which specifically looks at the mechanical Trading Approach that @Stealthsurf uses (www.tradingbases.com) and I plan to issue that this week - it needs some tweaks and additions but shouldn’t be too much work so if things go to plan that will probably appear on Thursday night. I think Readers will be intrigued by the approach Jason uses but more than that I think there are elements of it which anyone can meld into their own system. I was reading this Week’s Investors Chronicle earlier and there was a great 2 page article which was Psychology related - I might be able to pinch a bit of the text and ideas in that to come up with a useful blog - I might start this during the Week. I have several other Blogs in draft form so there should be a decent flow of stuff as we go into Summer, despite me being distracted by many other things and I have pretty much decided to buy a new Laptop (shock, horror !!) and that will be a ‘project’ for coming Weeks no doubt…… From the Dark Lagoon (well, the Archives anyway !!) Obviously you can find all the Blogs I have ever scribbled by looking at the ‘Blog Index List’ which sits on WD2 and all the ‘Educational’ Blogs are linked up as of a few months ago and you can find stuff very easily here: http://wheeliedealer2.weebly.com/blog-index-list.html Make use of it because I am pretty sure this is a unique archive of stuff which UK investors in particular should find very useful. The Blog I have highlighted this Week ties in the subject of Psychology which I mentioned earlier and also ties in ‘TopChopping’ which is extremely relevant after such a strong start to the Year and with us now approaching the tougher Summer months - this is Part 3 but there are links to the earlier Parts if you scroll to the bottom of it: http://wheeliedealer.weebly.com/educational-blogs/the-psychology-of-the-topchop-part-3-of-3 Let’s chart people !! Nasdaq Composite (US Tech) Very interesting development in recent days with the Previous All Time High at 8133 where my Black Arrow is being surpassed with a High of 8151 and a Close at 8146 on Friday where my Red Arrow is. It is notable that the previous ATH was not smashed through by any means and perhaps it has only just limped over the Line. If the Nasdaq Comp is going to make something Bullish out of this ATH Breakout, then we need to see some strength in coming days. It is very possible that it drops back from here especially with the RSI readings being very high (I won’t show it but the reading here is currently RSI 73 on the Daily which is not crazy but it most definitely is the kind of level where it often turns down from). As ever the Charts are from the brilliant SharePad Software that I subscribe to and if you click on the pictures then they should get larger for you to see more detail. 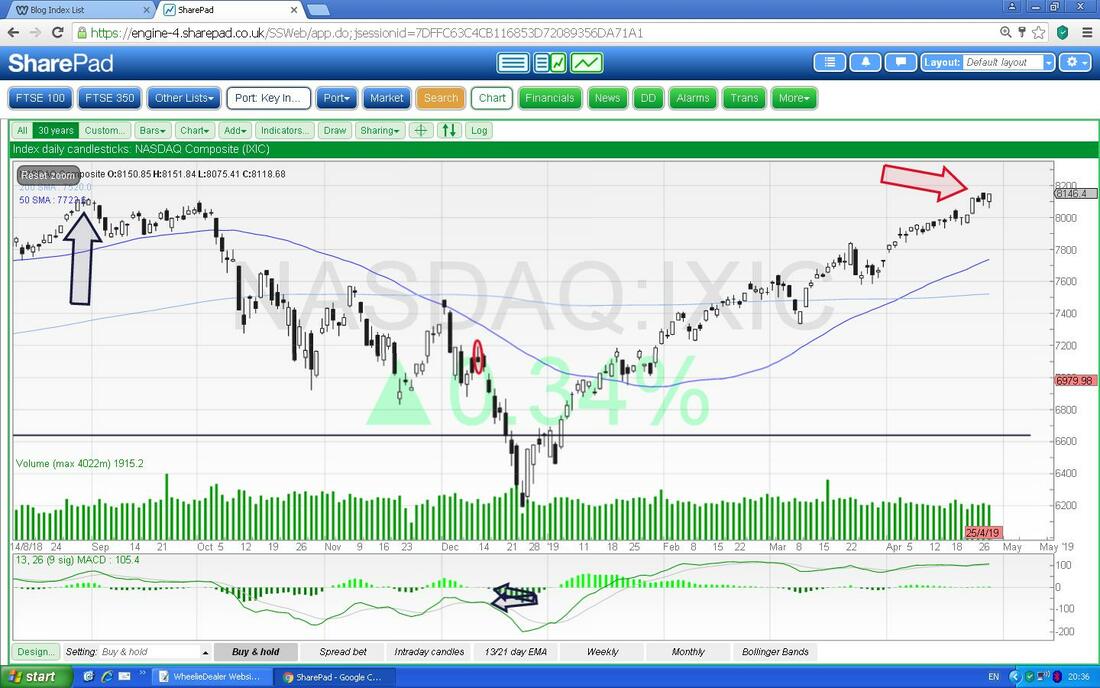
S&P500
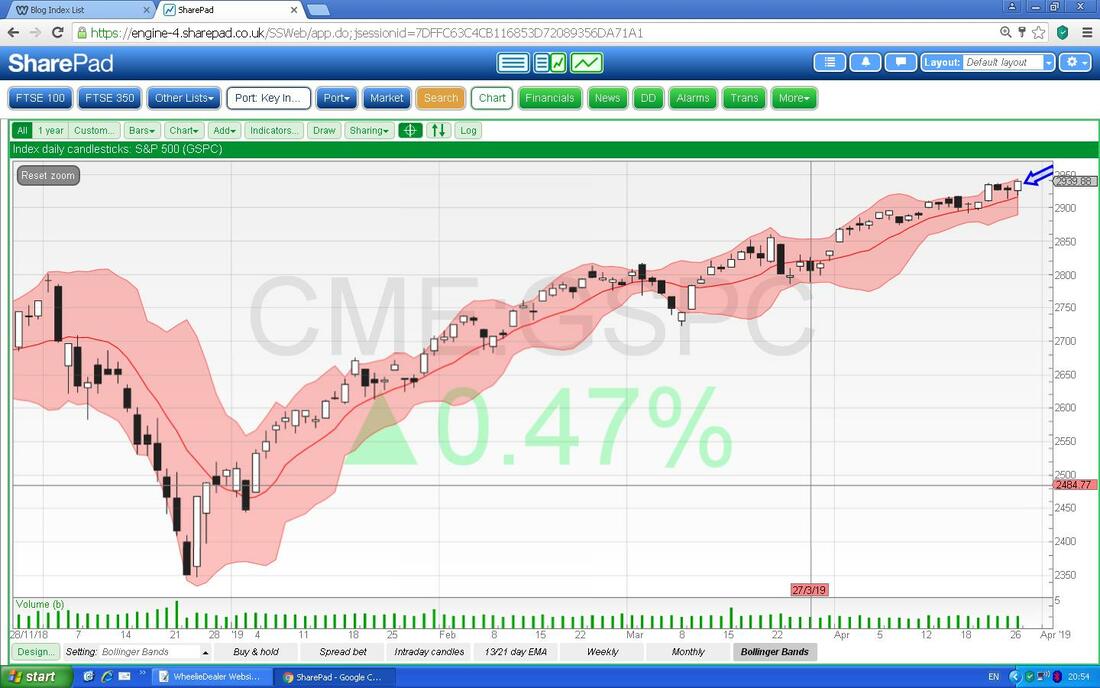
Next up we have the Daily Candles for the S&P500 and it is similar to the Nasdaq Comp although last Week where my small Black Arrow is, we didn’t quite make it up to the previous All Time High at 2941 where my Red Ellipse is on the Left. Something to note here is that we are very near a key psychological level at 3000 - so even if we do manage to Breakout and go higher, that 3000 level could be a challenge. The Blue Support Line (marked by my Blue Arrow) is important and a move below this would suggest the strong Rebound since the start of 2019 is in trouble. 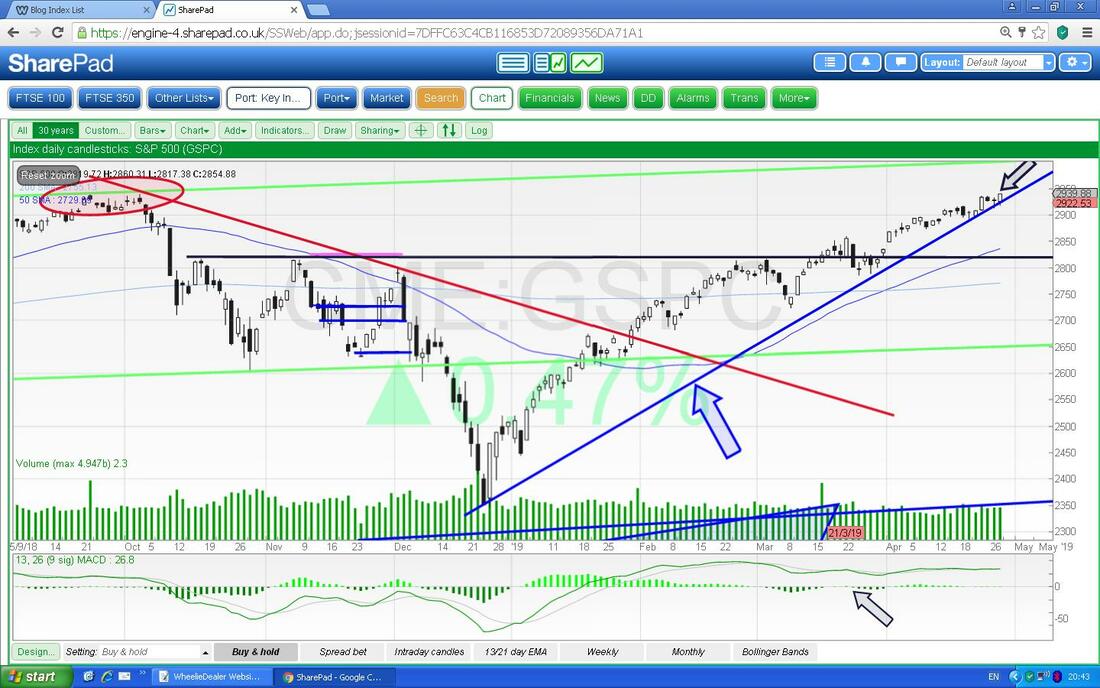
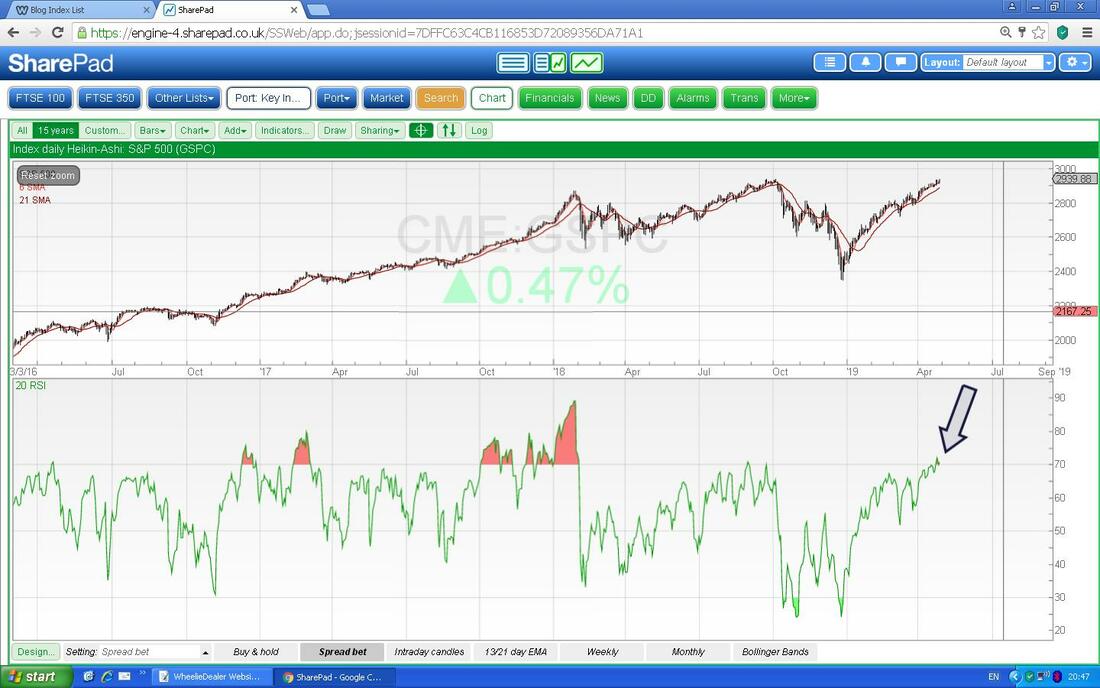
In the bottom window on the ScreenShot below we have the RSI (Relative Strength Index) for the S&P500 Daily and on a reading of RSI 71 where my Black Arrow is, this is high and although it might go higher, it is on borrowed time. Look to the left and see what happened after strong RSI Readings before……
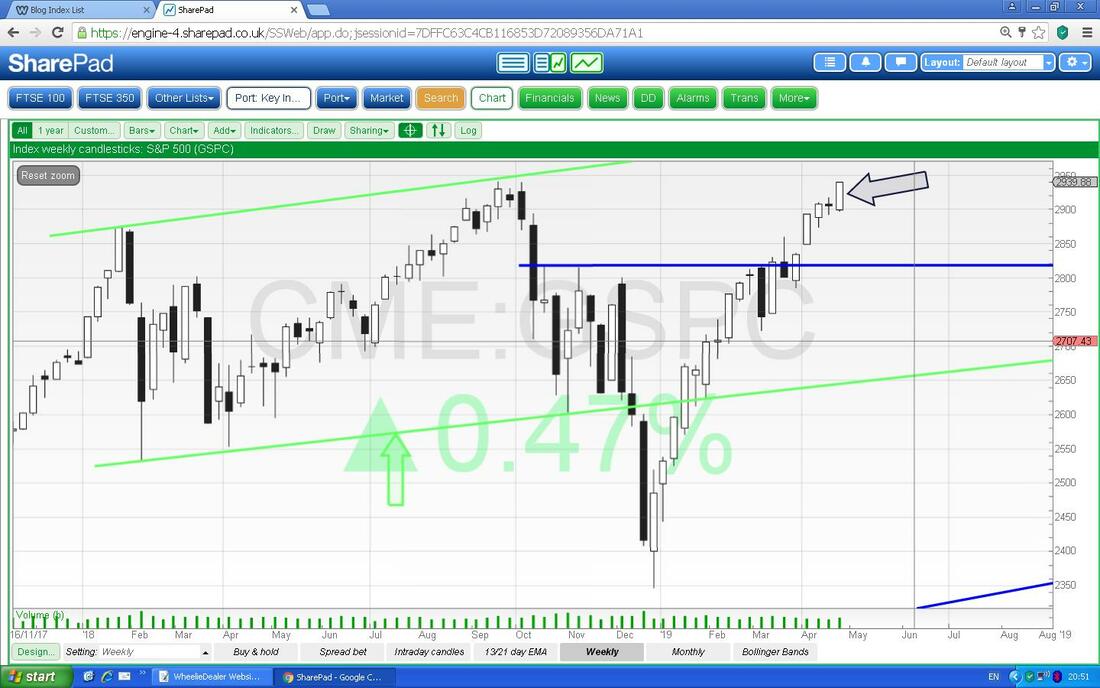
Next are the Weekly Candles for the S&P500. My Black Arrow is pointing to a strong White Up Candle from last Week and after the small ‘Doji Star’ sort of Candle from the Week before this is a Bullish turn of events (the Doji Star thing could have been a turning point down). However, note the Doji Star is also a warning that the move up is long in the tooth and a turn is likely soon.
Next is the Daily Candles for the S&P500 and the Pink Zone marks the Upper and Lower Bollinger Bands. Where my Small Blue Arrow is the Price is up at the Top Band and it might ease back from this. Something else to note is that the Bands seem to be quite tight and this suggests a ‘Sausage Squeeze’ to me where the Bands go tight before an ‘Explosive’ move - which can be up or down…….
FTSE100
I will drill in a bit on the next Chart but this one shows the Daily Candles for the FTSE100 going back about just under a Year and the key thing here is that where we are now where my Red Arrow is, we are up near the Zone of Resistance that is encapsulated (big word !!) by my Black Ellipse. This runs up to the All Time High at 7903. 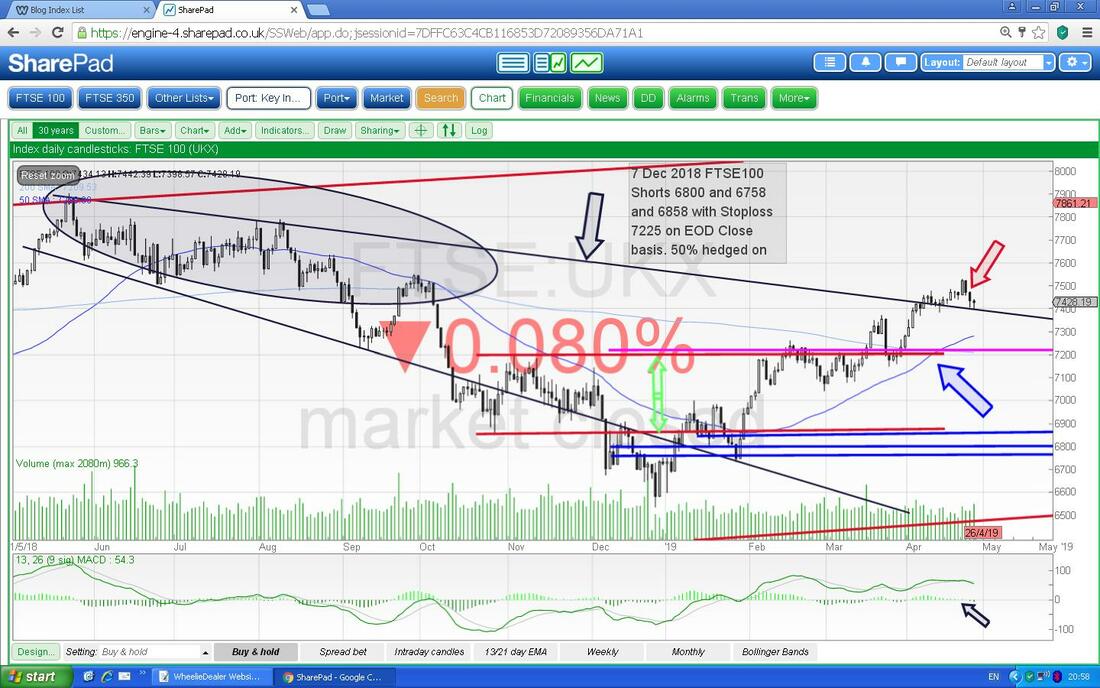
My Chart below has the Daily Candles and where my Red Arrow is I am trying to point to a Small Hammer Candle from Friday and this suggests Support at about 7400 after 2 Down Days which came before. There are no guarantees and it could fall more but at the moment it looks like a move up is on the cards.
The Black and Red Lines are the 13 and 21 Day EMAs (Exponential Moving Averages) and at the moment they are Bullish (they would go Bearish if the Black Line drops through the Red Line). 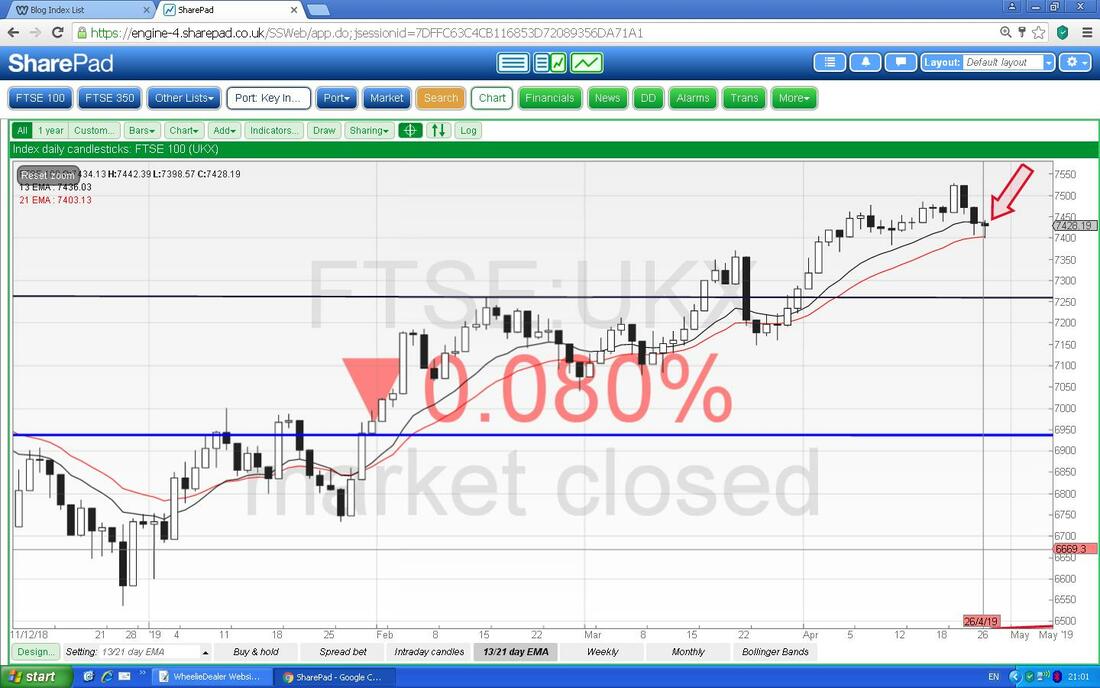
Next we have the Weekly Candles for the FTSE100 - where my Black Arrow is we have a tasty Inverted Hammer sort of Candle which suggests a Turning Point down - could be an interesting Week ahead then !!
Note, this is not in opposition to what I said earlier. On the Daily we could get a bounce but still end the Week down if the Markets drops towards the end of the Week. Remember, when looking at Technical Analysis stuff the Longer Period Trends/Signals have more weight than shorter term things (so the Weekly dominates the Daily). 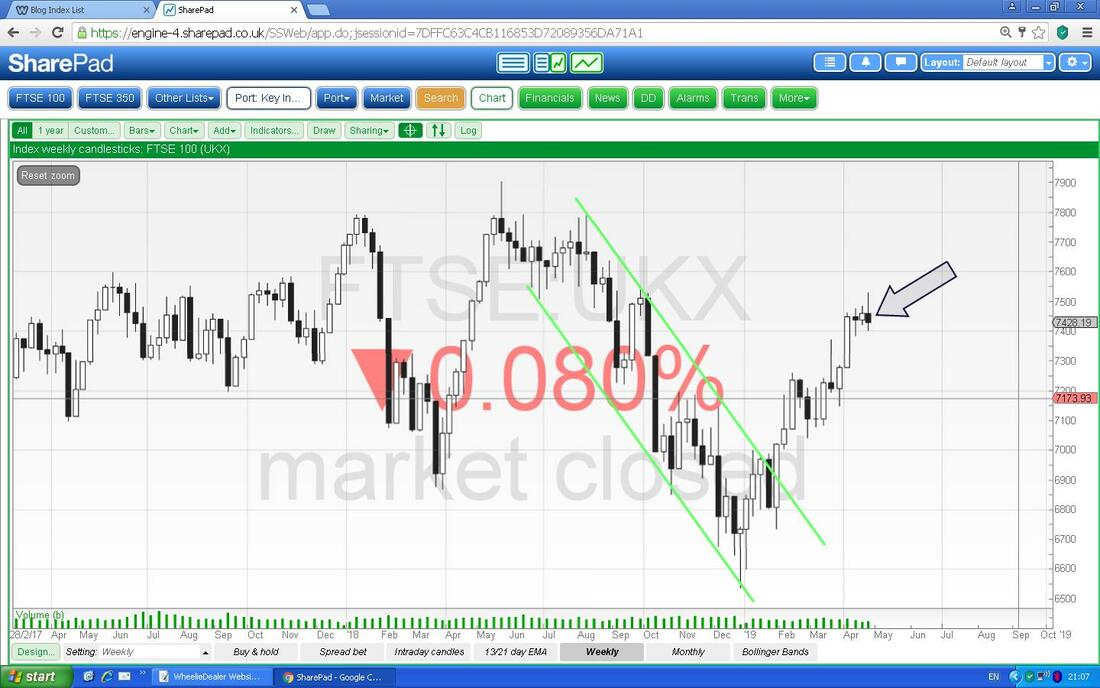
Finally for the FTSE100 we have the Daily with the Pink Bollinger Bands ‘zone’. My Black Arrow suggests the FTSE100 has moved down to the lower Band and then moved up from it (the lower Band has acted as Support as it should). However, again it is worth noting tight Bands and thinking of sausages……
I’m sure there was a Government Road Safety TV Advert many years ago - “Look once, Look twice, think Sausages”…..something like that (please don‘t give me a grilling over that). 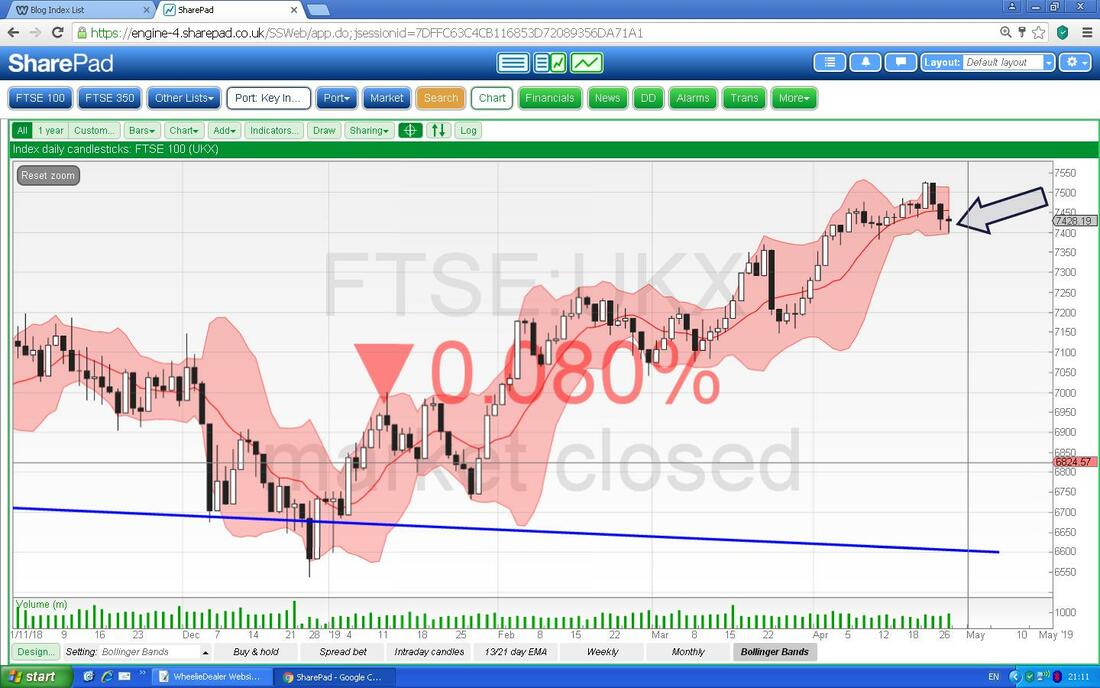
Brent Oil Spot
I wanted to just lob this one in because a mate asked me about Oil the other day and this is relevant. Below we have the Weekly Candles for Brent Oil Spot and my Black Arrow is pointing to a beautiful example of an Inverted Hammer or ‘Shooting Star’ Doji. Looks like a high probability that Oil drops back from here. Look where my Blue Arrow is where a similar thing happened recently. 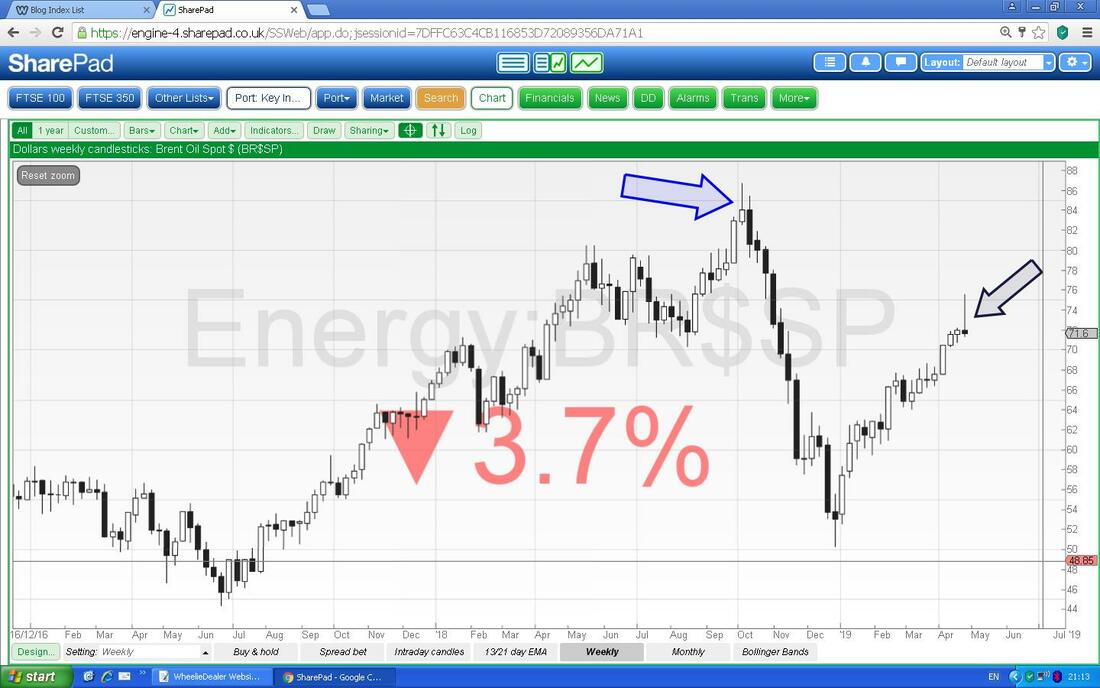
Vodafone VOD
With KCOM getting a Takeover Bid I need to find a replacement to shove in my Income Portfolio quite soon. One I fancy is VOD but it does have issues around sustainability of the Dividend and although I like it as a Long-Term Hold, it would be best to buy a small Stake first really and then to add later if and when things get stronger on the Balance Sheet. KCOM was in Telecoms and it would make sense to shove a Stock from the same Sector in again. Anyway, here is the Daily Chart. This is quite an easy Chart to understand at the moment. In essence the VOD Share Price has been in a Downtrend Channel since the start of 2018 and my Black Line shows the Resistance Line which needs to be broken through if things at VOD are going to improve. Whilst it is in this Downtrend, there is no point me buying in. I would say a move above 150p now would suggest things are changing and that would be a good time to buy. To the downside, 130p is important nearby Support and if this fails it will likely go lower. 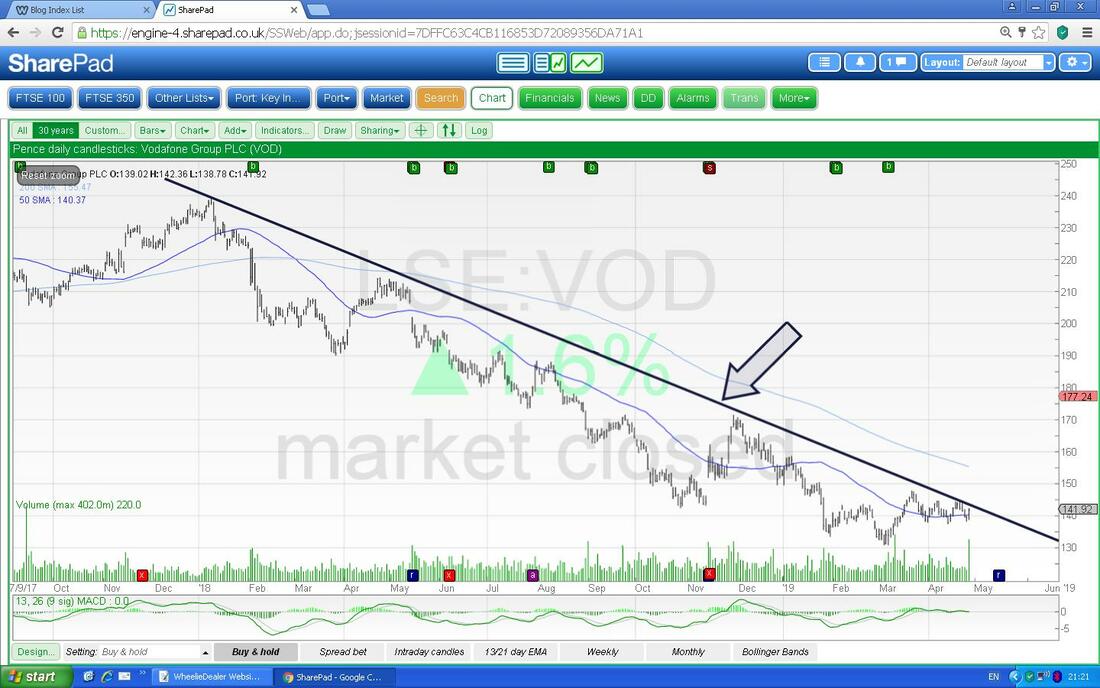
Tate & Lyle TATE
This one is another possible with a Forward Dividend Yield expected of 4.1% which is not over-generous although I like the idea that TATE is more in the Food Industry and something that I don’t really have in my other Stocks in the Income Portfolio - diversity is important. TATE is also well-established and the sort of Stock that will probably do well for me over time - I want something which I can just shove in the Income Portfolio and ignore. The Chart below has the Daily Candles and my Blue Line (Blue Arrow) is showing a Resistance Line which the Price is now butting up against and my Red Line is Support for the Uptrend that TATE has had since March 2018 (interesting that TATE has shown defensive qualities by rising for a long period of time when the Markets in general were weak). This is quite a Long-Term Chart going back to 2012 so that Blue Resistance Line might be quite hard for TATE to get above. From what I am seeing here it is not telling me a whole lot about whether or not it is a good time to buy TATE. Really a Breakout over the Blue Line would be Bullish and it might be worth buying then to take advantage of a Bullish mood. However, before I do anything I need to be more sure I want to buy TATE anyway as I like to use more Fundamental Analysis to choose my Stocks and then use the Charts to help with timing. OK, better end it there. Good luck for the Week ahead !! Cheers, WD. 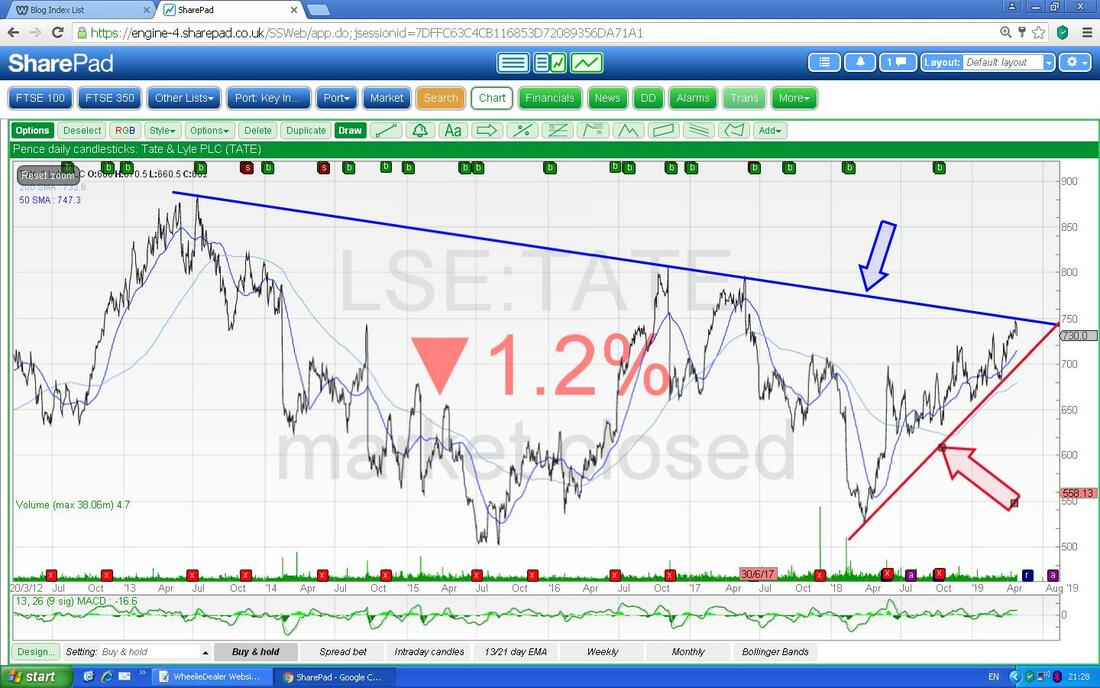
0 Comments
Leave a Reply. |

Stocks & Markets WheelieBlogsThese tend to be more Markets and Stocks related and timely - the Blog Page on the Main WheelieDealer Website has the 'Educational' stuff (well that's the theory anyway !!). Archives
October 2021
Categories
All
|
