

|
stocks & Markets blog |
|
A pretty good week as it happens, with Stocks doing nicely and I saw some excellent gains being reported on Twitter so the change of mood we had at the end of February seems to have been shaken off already. Of course the Nasdaq is behind a bit and the fabled ‘Rotation’ away from Growth to Value does seem to be taking place. Having said that it could easily be described more simply as a shift from Tech to Cyclicals. It is notable that we seem to have wobbled a bit as we got to both the end of January and the end of February.
There is no doubt plenty of sense in the Tech stuff getting more scrutiny because Valuations have been getting quite mad in a lot of cases; but I can’t help thinking that some Cyclicals are already looking pretty hot. One that has surprised me is On The Beach OTB, which I hold, which has now got higher than it was before the March 2020 collapse and that is quite amazing when you think how many challenges the Holiday Sector faces.
I keep saying it though, whatever happens I will be keeping my focus on Valuation and being careful not to buy anything that looks overvalued, or even where there doesn’t seem much to be gained from any kind of re-rating of the P/E the Market is prepared to apply. Despite all the gains, I think there are still lots of Stocks that not only seem to be promising growth, but they also have relatively modest P/Es so we should get gains via the growth of Earnings and we can probably get a ‘Double Whammy’ of P/E re-rating gains as well. Later in this Blog I look at Aviva AV. which looks really cheap to me.
I can’t remember if we discussed much about this in the latest Podcast, TPI 44, although we did discuss the Markets in general and plenty of other stuff, and loads of Educational bits and some Macroeconomics for a change. You can find that on Soundcloud at the Link below and if you go to the ‘Conkers Corner’ Channel then you should be able to find TPI 44 on Platforms like Apple, Spotify, Audioboom, Google+, Overcast, YouTube and others. https://soundcloud.com/user-479955511/conkers3-wheeliedealer-44-recycling-profits-tsla-bngo-smt-pct-rst-rwi-tbld-ctec-itv Last Week My Portfolio had a bit of a rough day on Friday, but still it managed to add 2% and before Friday it was at a new All Time High; so I am pretty pleased with how things are going. Because things seem more settled, I decided to stop fighting the Signals given by the 13/21 Day EMA Lines, and I Closed all my FTSE100 Short Spreadbets on Wednesday night and on Friday night (see the ‘Trades’ page and it is all on there.) I am pleased because I got out of the Hedges with quite a limited amount of damage, and that is really the key to how to go about such Risk Management I think. In the past I made the mistake of running the Losses from the Hedges for too long (of course I am gaining on my Longs so it is not a total disaster) and now I like to have strict discipline with regards to my Stoploss Levels and I also try to get out before them if I sense that the Hedges are no longer required. In addition, I find that keeping the Hedges small (especially when initially opening them), is the best way to go and means any damage if the Markets keep rising, is minimized. Apart from that I am not up to much. I have a few Positions that are quite large where they have grown, and I am likely to TopChop a bit soon and I also need to go about tidying up my Spreadbet Account where I have a few Positions that are too big and a few that are too small. That is not something I am rushing to attend to but over time I will try to balance things up a little more. I need to sweep both FCCN and SDRY out of that Account before the 30th March or whenever igIndex have said they will not be providing such Positions, and I might do that this coming week. My Spreadbet Portfolio is working quite nicely and this has a big benefit of throwing off Cash so I have been able to take quite a bit out; which means I can build my Cash Buffer which I hold outside of the Spreadbet Account (I also have quite a Buffer in my Account) and it also means I have plenty of Cash for eating and drinking !! My focus this year will be very much on leaving my Spreadbet Account alone and doing the minimum I can to it so that it keeps growing and can turn in a solid Result for the year. I am pretty sure a 50% Return on the Starting Capital is very possible. In the longer term, my aim is to put more Cash into my Spreadbet Account and to increase the Long Exposure quite a bit. However, I will only do this when I am really confident of my Hedging Strategy and I have a nice big Cash Pile to back up the higher Risks. I still need to attend to my Income Portfolio but I want a bit more Cash before I feed even a little bit into that Account. Blog Slate Quite incredibly I managed to spend an hour the other night working on that LOK blog, and slowly Part 1 is coming together and the good thing is that the process of doing this means I am learning more and more about LOK. It is a challenge though because the health problems are still being a nuisance and I am due a Phone Conversation with a Consultant at Stoke Mandeville Hospital on Monday afternoon – hopefully that will result in some progress but it is very frustrating. Other than that I don’t remember doing much to the Website. I did update the ‘Trades’ page but that was about it. If I do feel up to it, I will do some more work on the LOK blog in the coming week but I can’t promise anything. What I would say though is that it is worth looking at the LOK website because there is a lot of good stuff on there. Also check out the Annual Report 2020 because the wordy bit in there is decent as well. Digging in the Past All the Blogs I have produced (both the Charts ones and the Educational ones) are listed in full on the ‘Blog Index List’ page on WD2 and for all the Educational ones there are Links so you can find them dead easy. On top of that, we now have a pretty big Archive of Podcast Recordings so if you are really bored then going back through some of those might be a good use of your time. Some of the conversation will be time-sensitive but all of them have a large general education aspect and are probably still worth listening to even if they are more than a year old. Just be warned that some early ones had rubbish sound and the formats of what we covered were still unrefined !! From the Blog Index List, I bring you this old Blog which you might enjoy revisiting or perhaps suffering for the first time: https://wheeliedealer.weebly.com/educational-blogs/affirmative-action-timidity-vs-assertiveness I am not really sure what that one is about. I remember writing it and the title, but a quick skim through seems to cover a chunk of psychology type stuff. See it as a bit of a ‘Lucky Dip’ (or perhaps an ‘Unlucky Dip’). And on the Podcasts, you can find them all here on the ‘Twin Petes Investing Podcasts’ page: https://wheeliedealer2.weebly.com/twin-petes-investing-podcasts.html Better look at some Charts then…… Nasdaq Composite Index (US Tech) As is always the way, the Images I show are taken from the superb SharePad Software that I use and if you click on the Images then they should grow larger on your Screen. If you fancy using SharePad or the more Technically-focused ShareScope, yourself, then there are loads of ‘Adverts’ around my Websites where you can click through and sign up and you get One Month of Free Data and I get a small payment from SharePad as well (thanks !!). Send me an email or DM me or something if you are having trouble getting this sorted. I want to start with the Nasdaq Comp this week because that has been where a lot of the action has been and it is quite fascinating. It is always best to start with the ‘Big Picture’ and then to drill down and that is exactly what I will do. First up I am cheating a bit because this shows the Monthly Candlesticks and the one in my Red Ellipse is the last ‘Full’ Candle we have that is valid and this is for February. This February Candle is nasty – it shows a ‘Bearish Shooting Star’ and the key now for Bulls is to get the Candle for March (which is still forming up but is showing on the Screen as it is after 2 weeks) over the High Point from February which is at 14175 the All Time High (ATH). If March can see more gains and put in a nice White Up Candle, then even if it doesn’t get above the 14175 ATH Level, then this would be positive. However, if the Nasdaq Comp falls below the Low from February at 12397, then that could be an ugly sign. There is a glimmer of hope for Bulls though. The simple fact that the Candle for March did not start falling below the February Candle immediately, suggests the Bulls still have some fight left in them. I am pretty sure there is a Clock Change starting this coming Monday and it means that the US Markets open at 1.30pm UK Time (rather than 2.30pm) and they will now close at 8pm UK Time (rather than 9pm). This lasts a couple of weeks I think but it might be just one – it changes when the UK Clocks switch to British Summer Time (BST), whenever that is !!! (don’t ask me, I just write this sh*t). 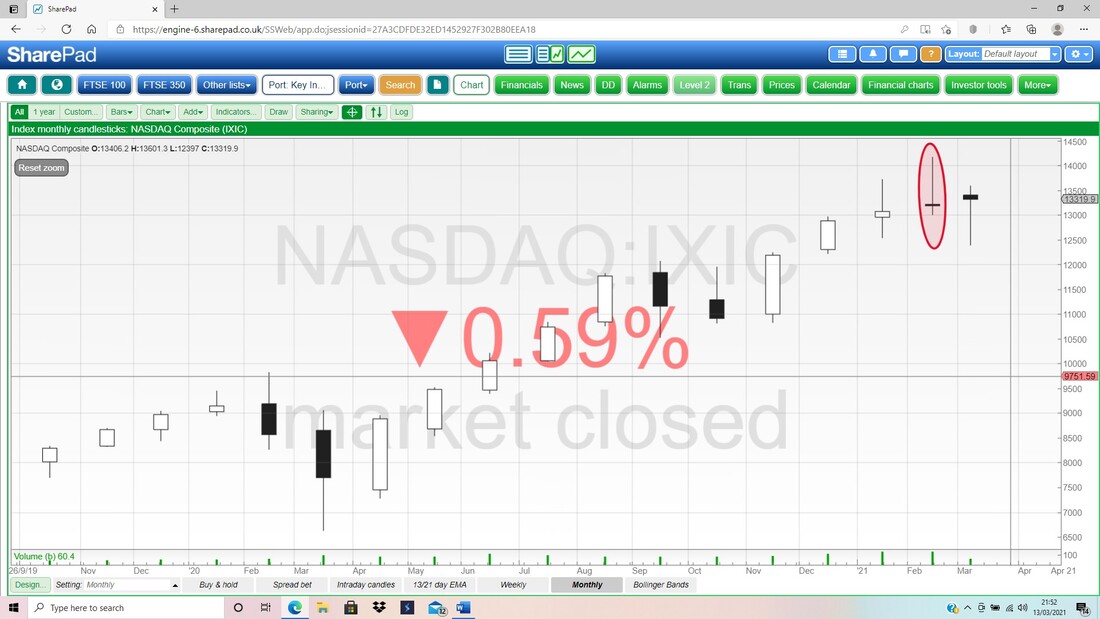
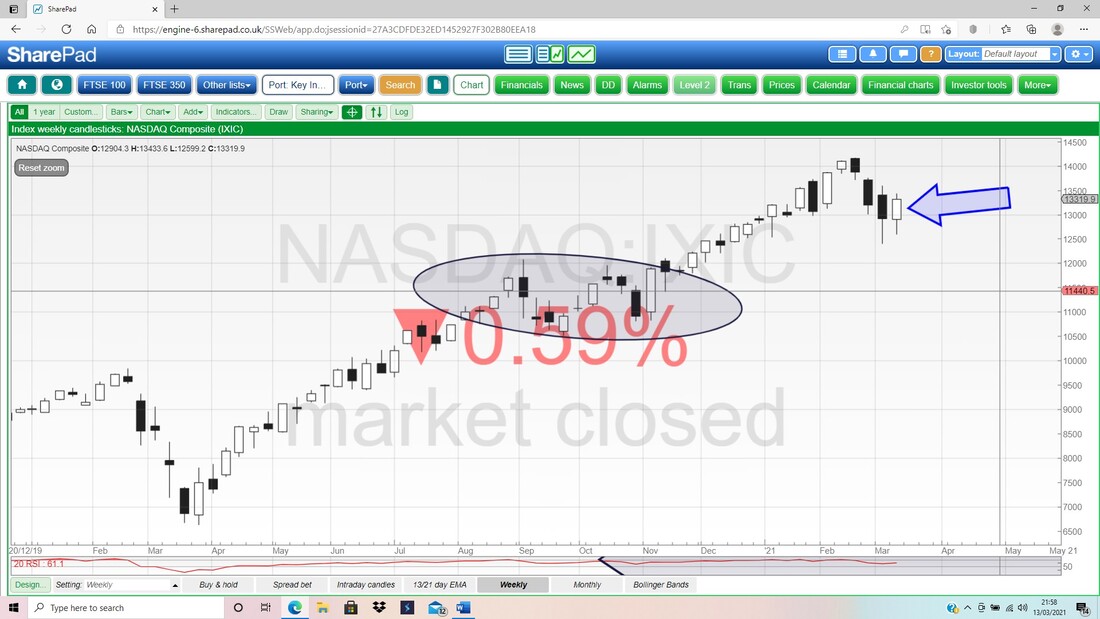
Next we have the Weekly Candles for the Nasdaq Comp and my Blue Arrow is pointing to a decent White Up Candle which pretty much covered the Black Down Candle from the week before. We are not out of trouble yet, but this could be the start of a move up again.
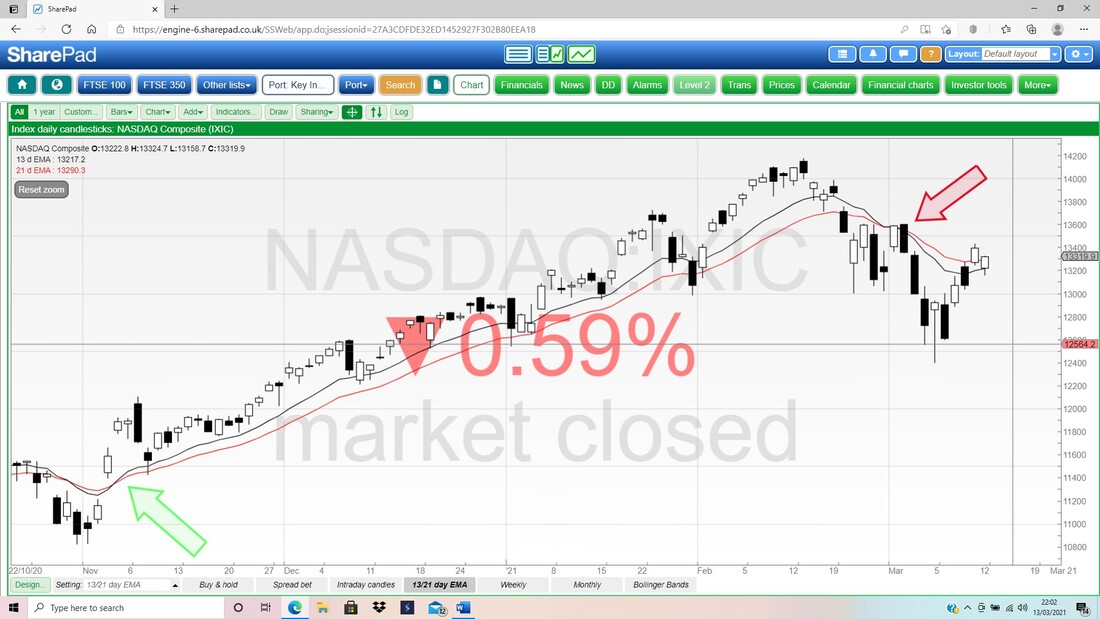
Next we have Daily Candles but I am not looking at those yet. My focus here is on the Black 13 Day EMA (Exponential Moving Average) and the Red 21 Day EMA. Where my Red Arrow is we had a ‘Bear Cross’ where the 13 Day slipped below the 21 Day and at the moment that is still ‘in force’ so we should view the Nasdaq Comp as Bearish until we see a ‘Bull Cross’ like we had where my Green Arrow is.
In the bottom window on my Screen below, we have the RSI (Relative Strength Index) for the Nasdaq Comp Daily and my Blue Arrow is pointing to where it is now on a Reading of RSI 50. This is bang on Neutral and means the Nasdaq is not Oversold nor Overbought.
Last up for the Nasdaq Comp we have the Daily Candles with the Pink Zone marking the Upper and Lower Bollinger Bands. There are several important concepts here – firstly let’s start with my Blue Arrow which is pointing to a Hammer Candle with a nice Long Tail and that is acting as a Turning Point for all the action at the moment. As long as the Low of that Hammer at 12397 holds, then the Bulls are still in the fight.
Next look at my Black Ellipse; this is capturing 2 small Up Candles from Thursday and Friday last week and note how the one from Friday is lower than the one on Thursday. The High from Thursday was at 13433 and this is the first Resistance to get above; then we have my Green Line (marked by my Green Arrow) at 13607 which looks difficult. The Upper Bollinger Band is at 13700 which could be Resistance and my Red Arrow is pointing at the Red Line which is the Bollinger Midpoint Line at 13110, and that might be Support. 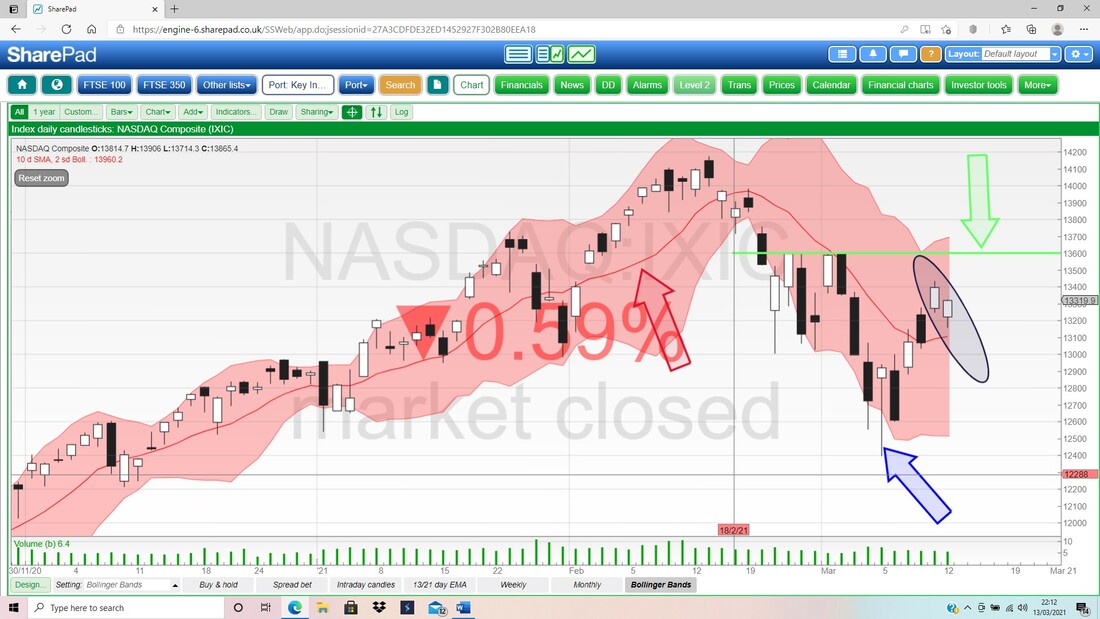
Dow Jones Industrials Index (DOW)
I don’t intend to put much in for the DOW but I want to show the contrast with the Nasdaq Comp. I will start with the Weekly Candles and my Blue Ellipse is marking a lovely Big White Up Candle and this looks Bullish. It hit a new ATH last week as well which shows how much stronger it is than the Nasdaq. 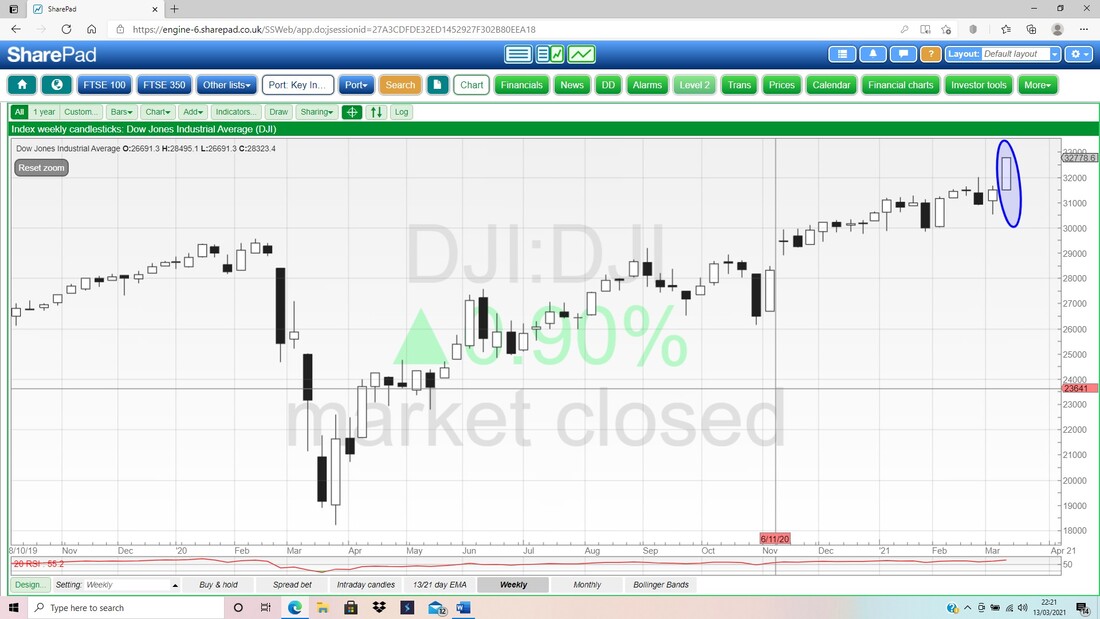
In the bottom window on my Screen below we have the RSI for the DOW Daily. On a Reading of RSI 70 where my Black Arrow is, this is Overbought and it means any more upside in the near term will be difficult and limited. However, it can ‘escape’ this Overbought condition by going Sideways for a bit or by dropping back a little – that would not unhinge the overall Bull case and would actually be healthy Market action. In the very short term it could rise a bit more, but not a lot.
Again, this is a big contrast with the Nasdaq Comp. 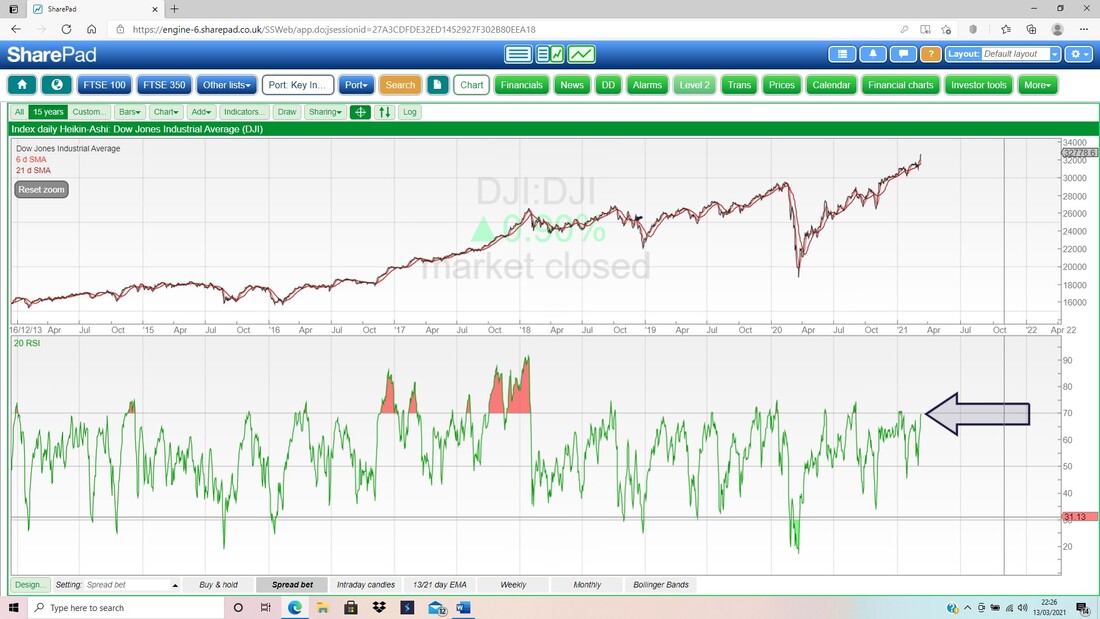
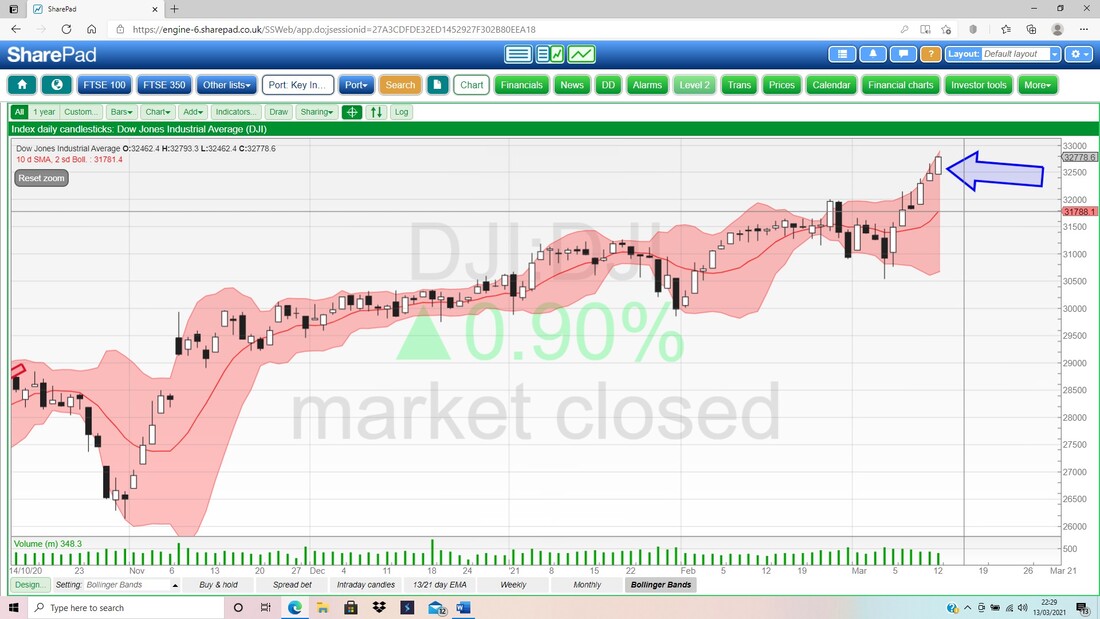
Finally for the DOW we have the Daily Candles and the Bollingers. My Blue Arrow is pointing to a decent Up Candle from Friday and note how the DOW has been ‘hugging’ the Upper Band for arguably 5 days. This is not a sustainable condition (remember the Overbought Daily RSI) and I would expect this to Consolidate soon. Note the Red Midpoint Line is at 31790 and this could be Support.
Brent Oil Composite
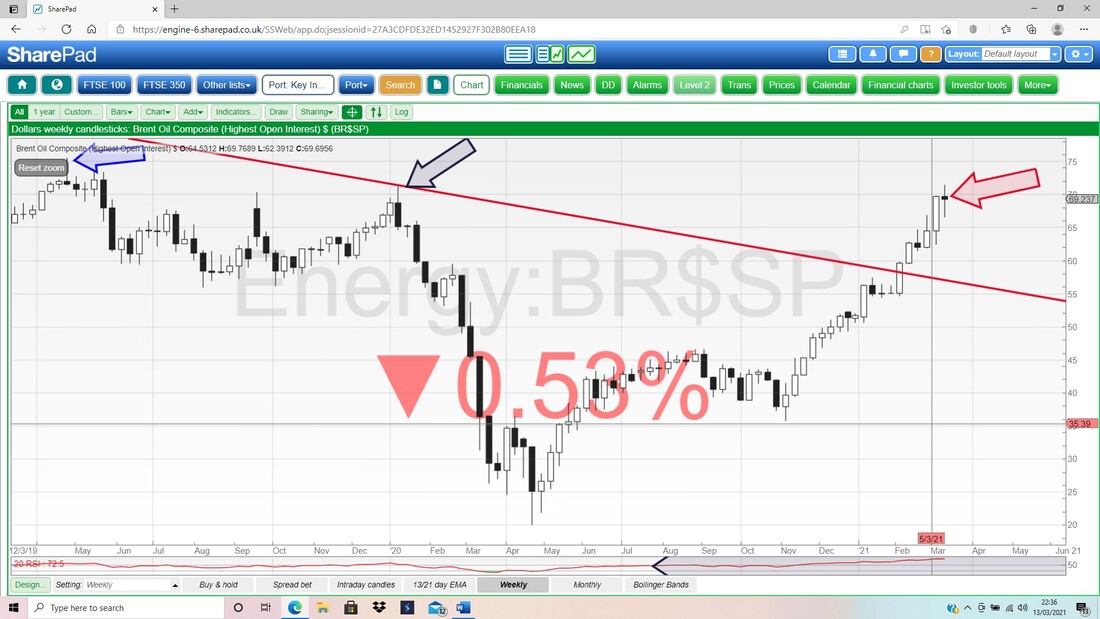
My Image below has the Weekly Candles for Brent Oil Comp and there is some interesting stuff here; especially because many Major Indexes like the DOW, FTSE100, CAC40 and DAX have considerable correlation to the Price of Oil. My Red Arrow is pointing to a ‘Long Tails Doji’ from last week and this could be a Turning Point from which the Brent Oil Comp Price falls back a bit. The High from last week is at $71.39 and it obviously needs to get through this if the Bulls are still pushing hard. Note where my Black Arrow is there is Resistance at $71.28 and note how similar this is to the High of last week. Next up my Blue Arrow is pointing to more Resistance at $75.60. A big problem with this Chart is that the Brent Oil Price has been running up in almost a dead straight line. This is awkward because the lack of Consolidation Periods over the last 4 months or so, means there are not many strong Support Levels. At best the Support from psychological ‘round numbers’ should help which are Levels like $65, $60, $55, and of course a big one at $50.
The bottom window on my Screen below has the RSI for the Daily Brent Oil Comp Price. On a Reading of RSI 72 where my Black Arrow is, this is very Overbought and note how it has been up at Levels even higher than this of late.
If you look back through the history, you will see that Periods of extremely High RSI Readings don’t last all that long and that suggests to me that some sort of Consolidation is desperately needed. It may not mean a big fall (and I doubt that a lot) but it could be an ease back or a period of Sideways movement. 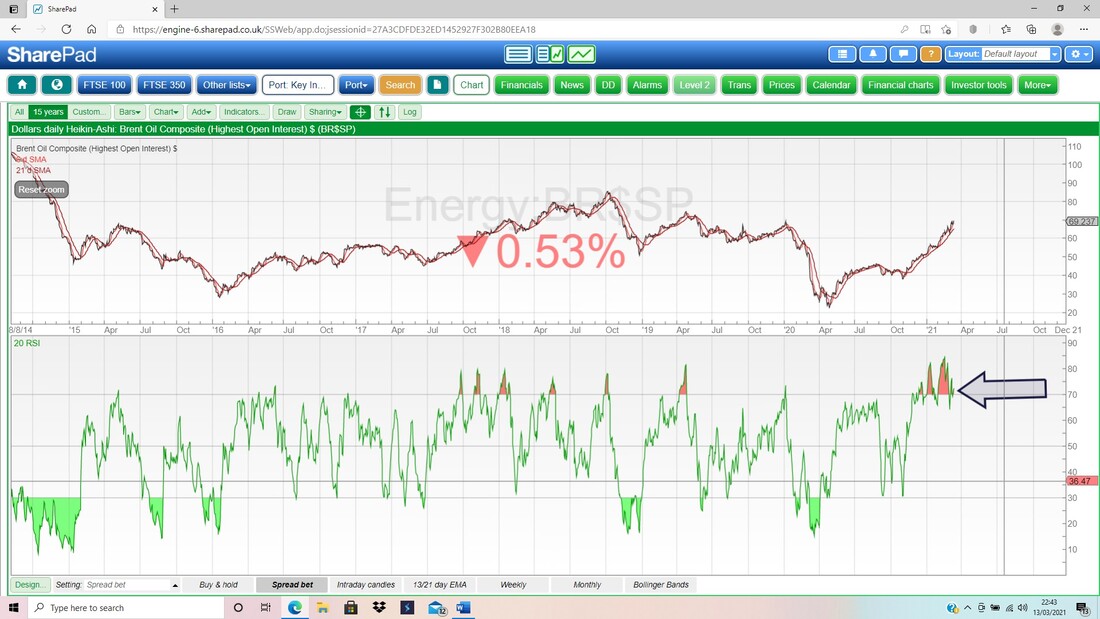
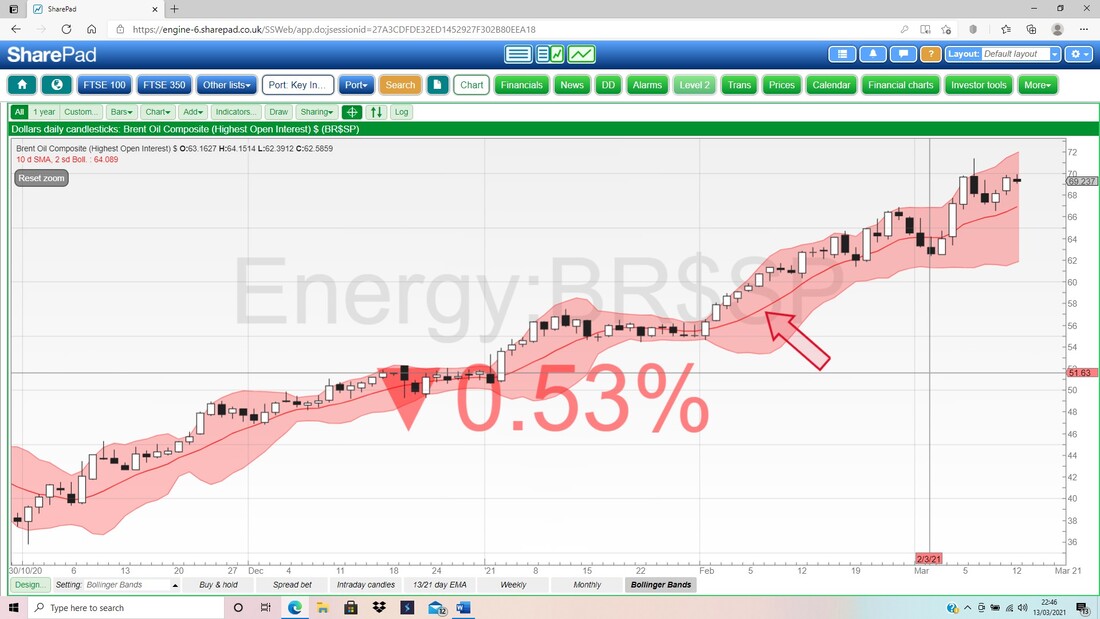
Finally for Brent Oil Comp, here are the Daily Candles and the Bollingers. My Red Arrow is pointing at the Red Midpoint Line and look how this has been decent Support for much of the big move up over recent months. This could be Support again now which would be about $67 and down below the Bottom Band should be Support at about $62.
FTSE100
I am starting with the Monthly Candles because even though the Candle for March is not yet valid, there are some key things to be aware of. My Blue Arrow is pointing to the Candle for March so far as it is forming up, and we can be pleased (assuming we are Bulls !!) that this Candle has not just fallen straightaway from where the February Candle Closed. The most important thing now though is that the FTSE100 can get above the High from January (Red Arrow) which is at 6903 – if that happens it would be very good news. 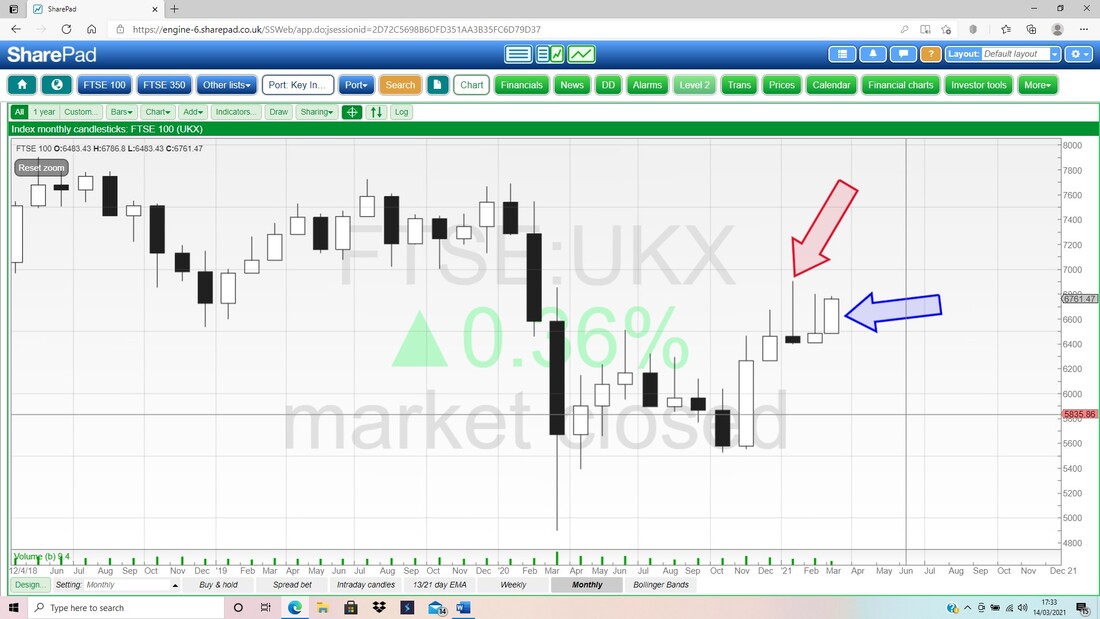
Next we have the Weekly Candles and my Blue Arrow is pointing to a nice Up Candle from last week. The FTSE100 needs to get above the Resistance at 6800 which is marked by my Black Arrow and then it needs to crack 6903 which is marked by my Green Arrow (note this lines up with what I mentioned on the Monthly Candles above).
To the downside there is Support in a ‘Ladder’ at 6397, 6315, 6263 – I will let you figure out where I derived these from. This looks more Bullish than Bearish (helping to justify why I closed the Hedges I had) but it must crack the Resistance Levels I have highlighted. 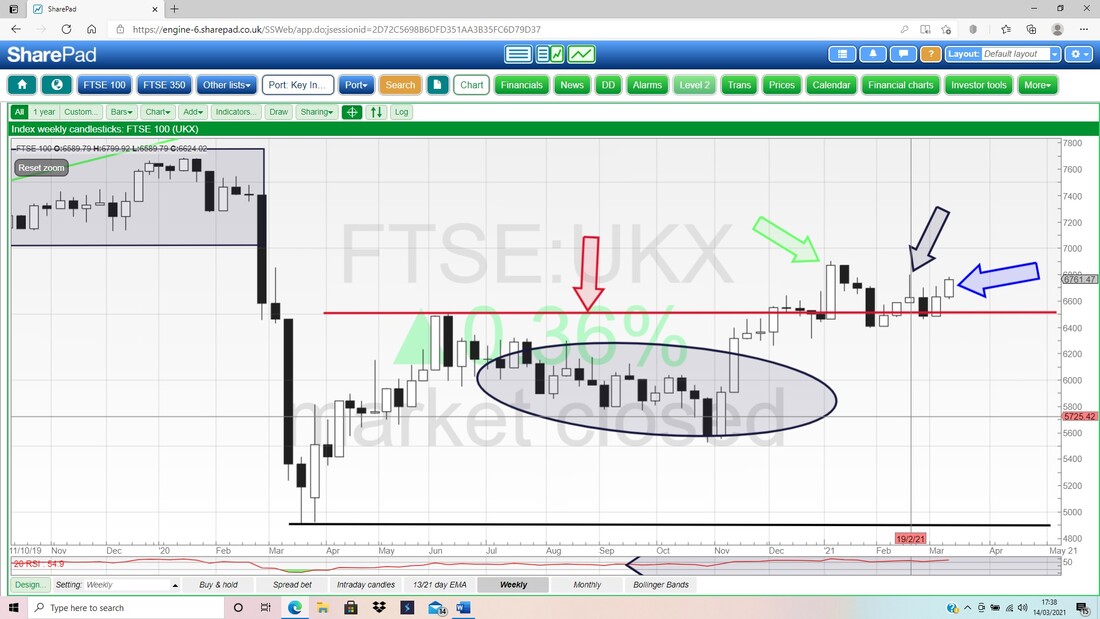
Next I am looking at the 13 and 21 Day EMA Lines for the FTSE100. My Blue Arrow is marking a ‘Bull Cross’ and this is still in force. This was the main driver behind me closing the Shorts I had running – I hate trading in an opposite direction to what this Signal is telling me and it looks very much like the Bulls are back in charge here.
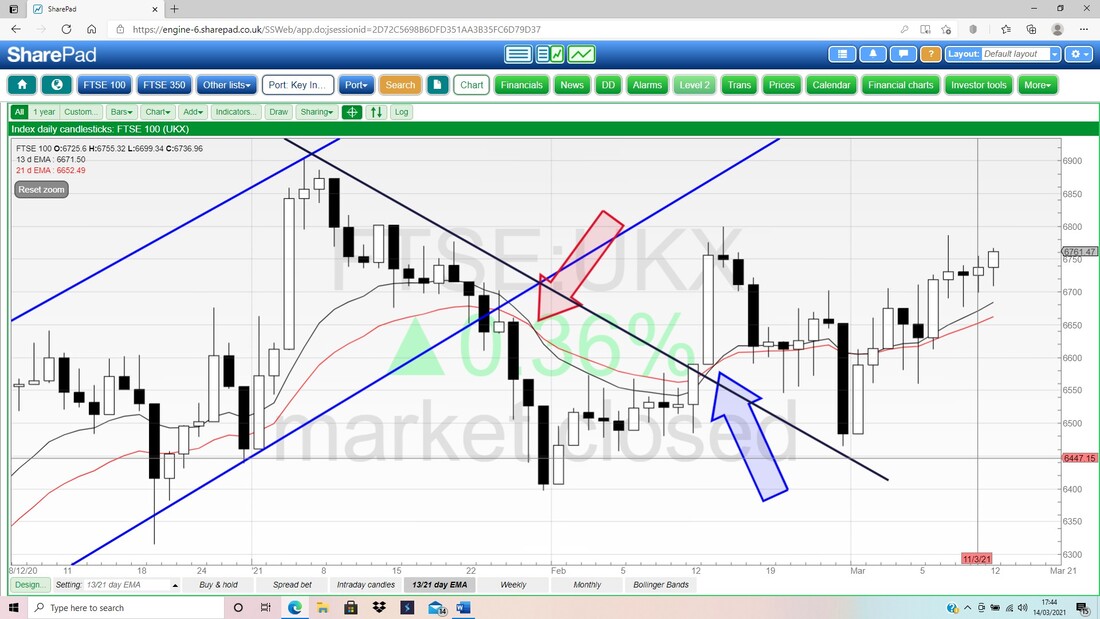
In the bottom window below we have the RSI for the FTSE100 Daily and on a Reading of RSI 59 where my Black Arrow is, there is still plenty of room for a decent move up.
Last up for the FTSE100 we have the Daily Candles and the Bollingers. Again this is all about the Resistance and Support I have already outlined. My Blue Arrow is pointing to an Up Candle from Friday but really it is a bit of a Doji (in essence, a Doji is any kind of small Candle) and the FTSE100 spent much of last week going sideways with a slight slant upwards.
Here the Upper Band is at 6800 (that number again !!) and the Midpoint is at 6688 (Red Arrow) and the Bottom Band is at 6500. 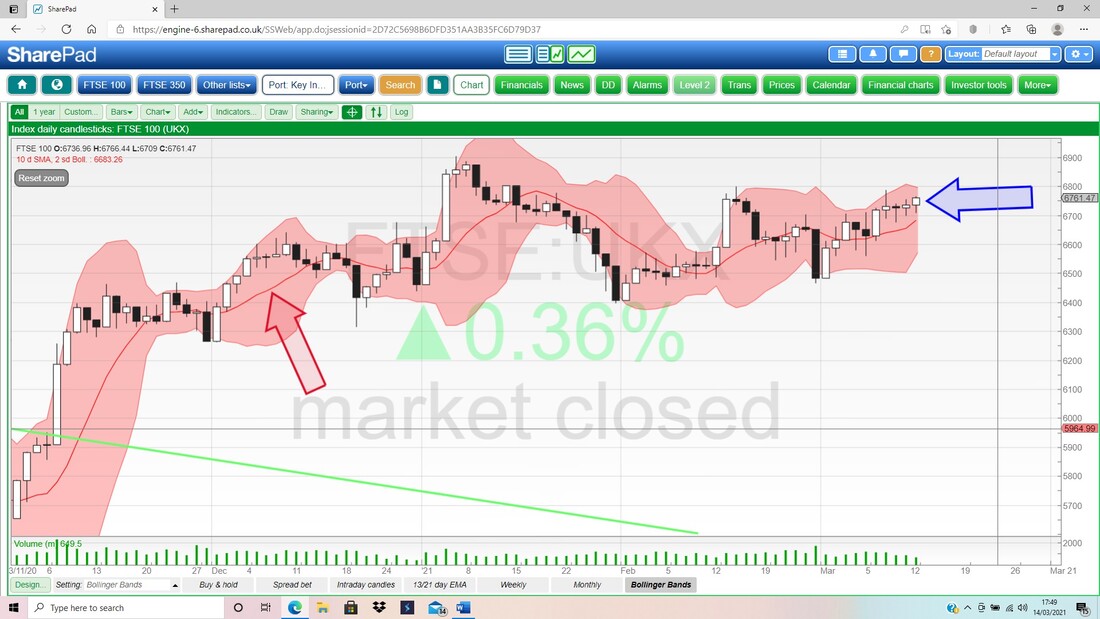
Aviva AV.
I hold AV. and am toying with the idea of buying a few more – but not much due to the lack of Cash I have. What really appeals is that it looks really cheap and it is expected to give back at least 30% of the current Market Capitalisation over the next 3 years to Shareholders; either as Cash Dividends or with Share Buybacks. AV. has been retrenching to just UK and Ireland and Canada and selling off various Country bits, which gives it plenty of Cash and Balance Sheet strength. So I fancied a quick look at the Charts. My Chart below goes back a long time (27 years !!) and my Red Line is an attempt to show the Downtrend Resistance that has prevailed over that time. Ideally, a Breakout of this Line at about 450p would be good for Bulls and a move over around 550p would be icing on the cake. The current price is 390p and obviously 400p would be a nice psychological level to get over. 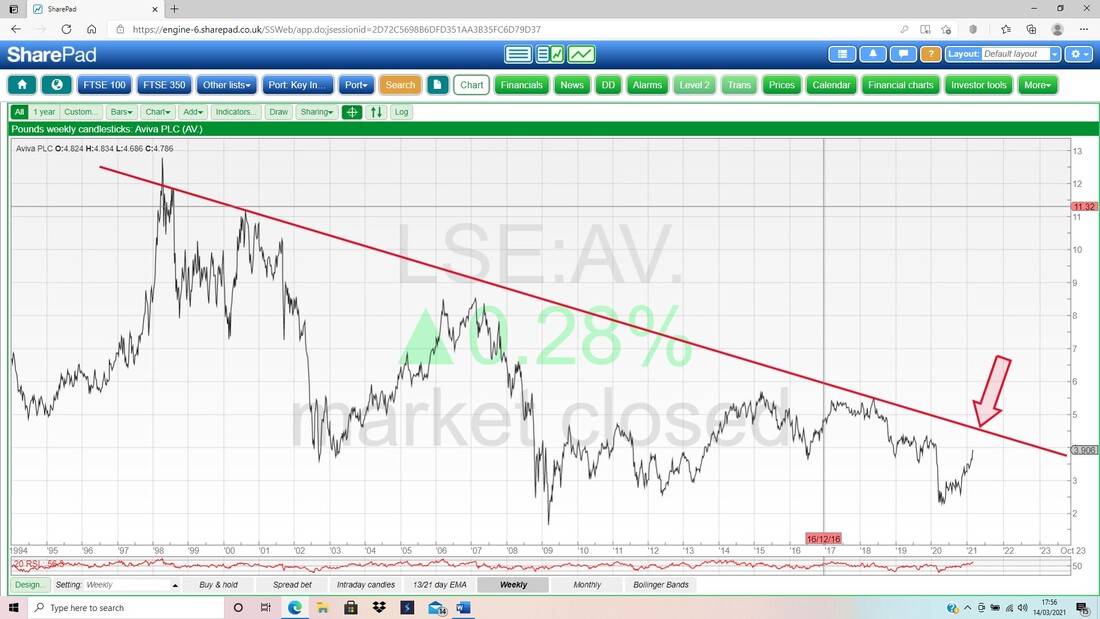
My next Chart has the Daily Candles for AV. but I am really looking at the ‘Bull Cross’ on the 13 and 21 Day EMA Lines and my Blue Arrow is pointing this out. Since that time, the Bulls have been well in charge and every time the Price drops back near the 21 Day EMA (and a bit below it), the Bulls have come in to buy again. Nice.
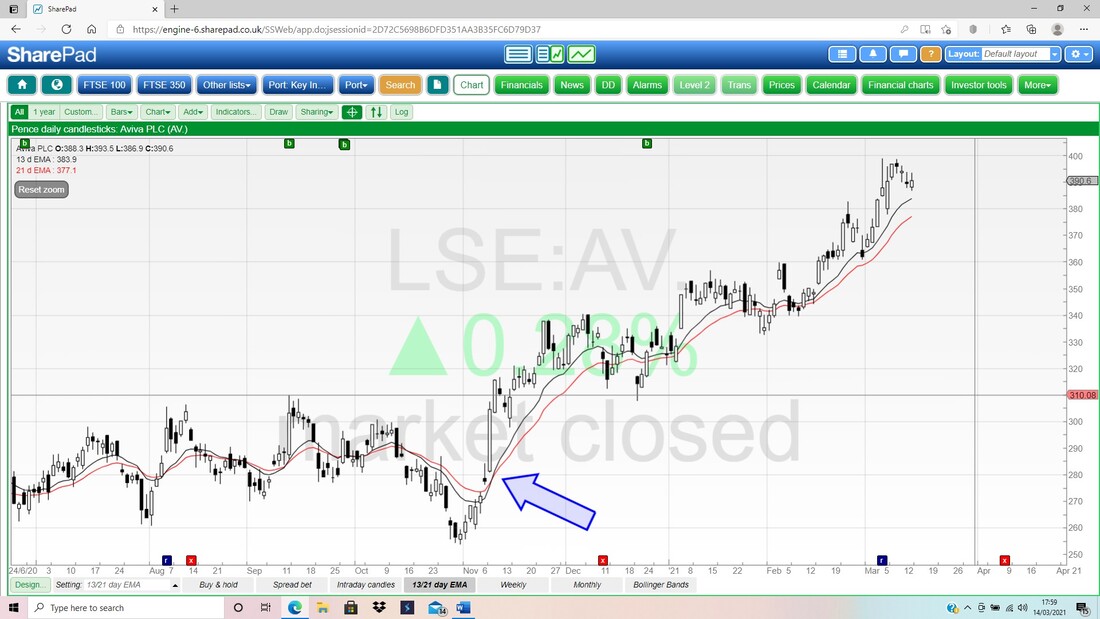
In the bottom window below my Black Arrow is pointing to a Reading of RSI 65 on the Daily RSIs and that is high. It might drop back a little more in the short term.
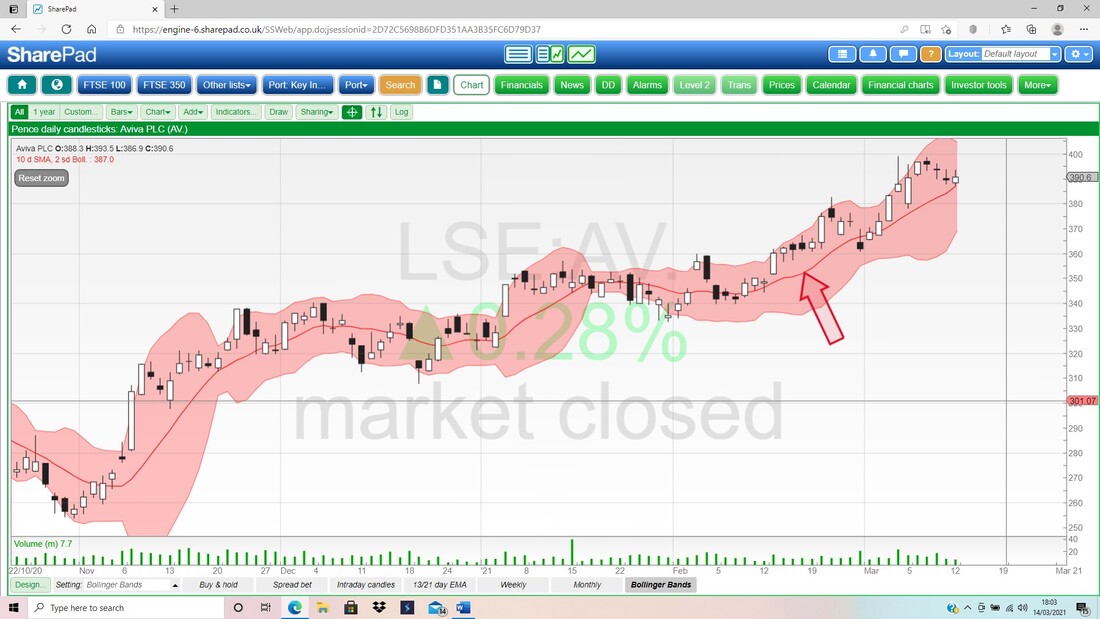
Now the Daily Candles with the Bollingers. The interesting thing here is that the Price dropped back to the Midpoint Line (Red Arrow) and then rose on Friday and this kind of Price Action has happened a lot in the recent past.
Last up tonight here is the ‘List Screen’ from SharePad as I have it configured, and it should show why I think AV. looks rather cheap. A Forecast P/E off 7 is low and the Dividend Yields for the next 2 years look chunky.
OK, that’s it. Have a good week and try to get out and about and not go too Lockdown Loony !! Cheers, WD. 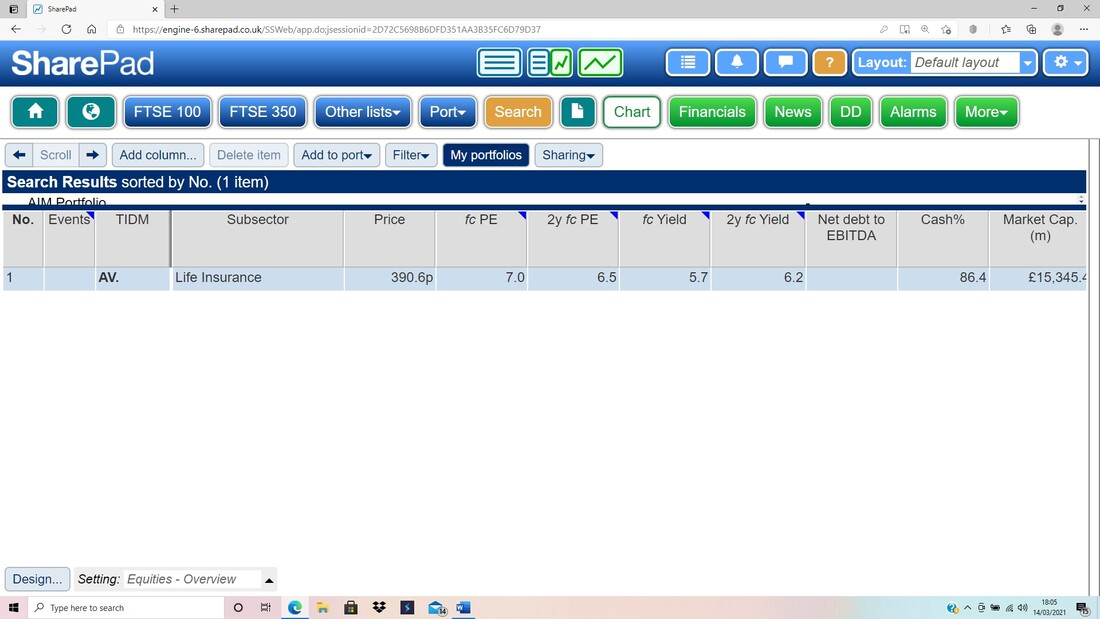
2 Comments
Kevin S
3/15/2021 11:48:06 am
Hi Pete. Thanks for your usual Sunday update - very interesting as usual. I am still unsure how long we have before this market takes a dive. There are so many examples of absolute rubbish soaring away with ridiculous SP's it is laughable.....pennt shares going up 50% in a day, spurious BITCOIN rocketing, rubbish stocks climbing multiple times etc etc.
WheelieDealer
3/16/2021 02:04:05 pm
Hi Kevin, Leave a Reply. |

Stocks & Markets WheelieBlogsThese tend to be more Markets and Stocks related and timely - the Blog Page on the Main WheelieDealer Website has the 'Educational' stuff (well that's the theory anyway !!). Archives
October 2021
Categories
All
|
