

|
stocks & Markets blog |
|
I’m starting this on Saturday night (and hopefully I can complete it tonight !!) as I am hoping to watch MotoGP all morning tomorrow and then in the afternoon/evening I am popping down to Fleet in Hampshire to visit a mate. Time is quite tight (mainly because I have spent all day watching the MotoGP Qualifying !!) so it may not be the longest Blog I have bashed out.
We got quite a sell-off during the week on the FTSE100 and the Triangle that I was talking about broke to the downside. This is clearly not good news although there was a huge bounce on Friday and it is pretty opaque with regards to how far this can continue in the coming week. I will look at the relevant Charts in a bit, and if I remember I will also look at how the Monthlies are shaping up because we have just one week left in October and the Candlesticks for September were a bit rubbish. Bearish Candles for October might suggest we will not have an easy close out to 2020. With the Economic disaster unfolding no one should be shocked.
We are also counting down to the US Presidential Election and that will most likely be pretty close when it comes to the crunch, despite the Polls showing a huge lead for Joe Biden. Trump did a surprisingly restrained performance in the last TV Debate and might have managed to capture a few wavering Voters and Biden screwed up big time with a gaff relating to his policy towards Oil – this could push a lot of Voters to Trump in the Oil States. I am not sure if Biden really achieved much against Trump – the reality is that people have such low expectations of the Orange One that he is fairly Teflon coated.
I read in ‘Investors Chronicle’ this week (page 14) that there is a lot of Economic Data coming out of France and Germany and the wider European area – these are expected to show that the Second Wave of C19 is impacting Economies as Restrictions permeate. The twist to this could be that it helps towards a Brexit Deal because the EU really doesn’t want more avoidable Economic trouble and of course that is the last thing the UK needs. I just heard on the TV News that the President of Poland has caught C19. What is it with all these Politicians? They are like Virus Magnets. Anyway, I think we hint at some of this stuff in our latest ‘Twin Petes Investing’ Podcast TPI 34 and as always you can find that on various Podcast Platforms such as Apple, Overcast, Spotify, Audioboom etc. (you need to go to the ‘Conkers Corner’ Channel) and you can listen to it here on Soundcloud: https://soundcloud.com/user-479955511/conkers3-wheeliedealer-34-how-to-find-winning-stocks-ixi-g4m-rmg-sdi-rec-elix-gsk-ai As usual, we include loads of Stocks in it and also a fair chunk of educational type material, such as the concept of Market Beta and something I tripped over called ‘Badwill’. Last Week Bit of a strange week for me with my Portfolio getting kicked a bit through most of the week (but fortunately the blows were tempered by my FTSE100 Shorts), but then having a big rebound off a miraculous turnaround on Friday, with the result that I ended up dead flat on the week. The bounce on Friday was pretty widespread but I had a few large gainers and the king of these was McCarthy & Stone MCS which received a Takeover Bid and jumped around 40%. I am pleased with this because MCS has been a frustrating holding, although unfortunately I will still take quite a large loss on it – probably around 40%. I don’t get too stressed about this though because the simple reality is that not all my Investments will work out as I would like, and I look at things at a Portfolio level rather than on the individual Stocks as such. The fact is I was much richer on Friday than I was on Thursday !! I rarely wait the whole time for the Cash from a Takeover to come through, although I won’t sell straightaway because there is a small possibility that another Bidder will emerge – that is unlikely but I will give it a few weeks to play out. I am not desperate to spend the Cash or to reinvest it with the Markets a bit moody, although if I leave it too long there is a risk that the Takeover could fall through and that would be a bit annoying. As a result of all the Ups and Downs, my Portfolio is now up 0.8% YTD since January 1st and I am very pleased to be back into the black after dipping into the red during the week again. It would be really nice to build a nice buffer of profit for the YTD so any wobbles are easily absorbed without seeing red, but sadly I am some way from that I suspect. I also got reminded by Golden Prospect GPM that the Warrants I am sitting on need to be taken up by the 30th November. I sold my GPM Shares ages ago but sat on a small amount of the Warrants which have a value but it is tiny in relation to my Portfolio. I don’t really want exposure to Gold and don’t want more GPM obviously, so I will close the Positions in the coming week if I get around to it. Blog Slate I finished off the article I was writing for a Magazine and I whizzed that off to the Editor a few days ago and they seem to like it and it will get published in due course. It was rather lengthy so they are going to chop it a bit, but my intent is to publish the full version on my Blog page in a couple of months or something. Once it goes out in the Magazine I will highlight it to WD Readers and it will be Free to see. I think you will like it because it covers topics that I don’t remember seeing anywhere else and is very much ‘Real World’ stuff that I am sure Private Investors (and Traders) will be able to relate to. I was pondering a Blog about Director Deals but that got usurped by an idea I had to write about the Volatility of Returns on a Portfolio and I think Readers will like that. I have been running some random ‘Models’ which look at 10 year periods of Returns for a Portfolio, and it throws up some interesting observations and no doubt some conclusions once I have been able to think about it a bit. I have read over the years how lower Volatility Portfolios will give better Returns over a long period of time, and I wanted to investigate this and see how likely to be true this is. If so, I will also cover some ways in which we can reduce the Volatility of our Returns. Well, that’s the rough plan I have at the moment and with luck it won’t take me too long to write it. I noticed my ‘Little Black Book’ with Stock Ideas is getting quite full up again and if I can find the time, I will update that page on WD2. Historical Dramas from Times long gone by As always the Blogs I have scribbled over many years can all be found on the ‘Blog Index List’ page on WD2 and they have a Search thing and also each Educational one has a Link so you can find it easily. From that list I bring you the blog below which is a Stock Buy Checklist and within it you can find links to other Checklists I have written: https://wheeliedealer.weebly.com/educational-blogs/stock-buy-checklist-aim-blue-sky-story-stocks Time for some Charts then……… FTSE100 Following the usual protocols, all the Charts I show are Screengrabs from the superb SharePad software I use and if you click on them then they should get a bit bigger so you can see more detail. I had to start with the Triangle because I am totally fixated by this !! If you read my Blog from last weekend, then you should recognise much of this and the key point is that we have a Triangle between the Red Line at the bottom marked by my Red Arrow and the Green Line above (the Hypotenuse) marked by my Green Arrow. This Green Top Line is squeezing down the Price and on Thursday last week it popped out of the Red Line at the bottom and it then recovered with a Hammer Reversal Candle which is marked by my Black Arrow. The Low of the Hammer was 5716 and that is now critical Support that must hold. However, if it does give way, then my Red Ellipse over in the bottom left-hand corner of my Chart shows a wide Zone of Support which could help avoid a huge collapse. On Friday we got a big Up Candle and it is already up against Resistance with 5960 being likely fairly strong, and above this the Green Line could be a challenge and particularly 6000 and 6040. I am 50% Hedged on my Portfolio via some FTSE100 Short Spreadbets (see my ‘Trades’ page on WD1) and from this evidence I am in no rush to close my Hedges yet. 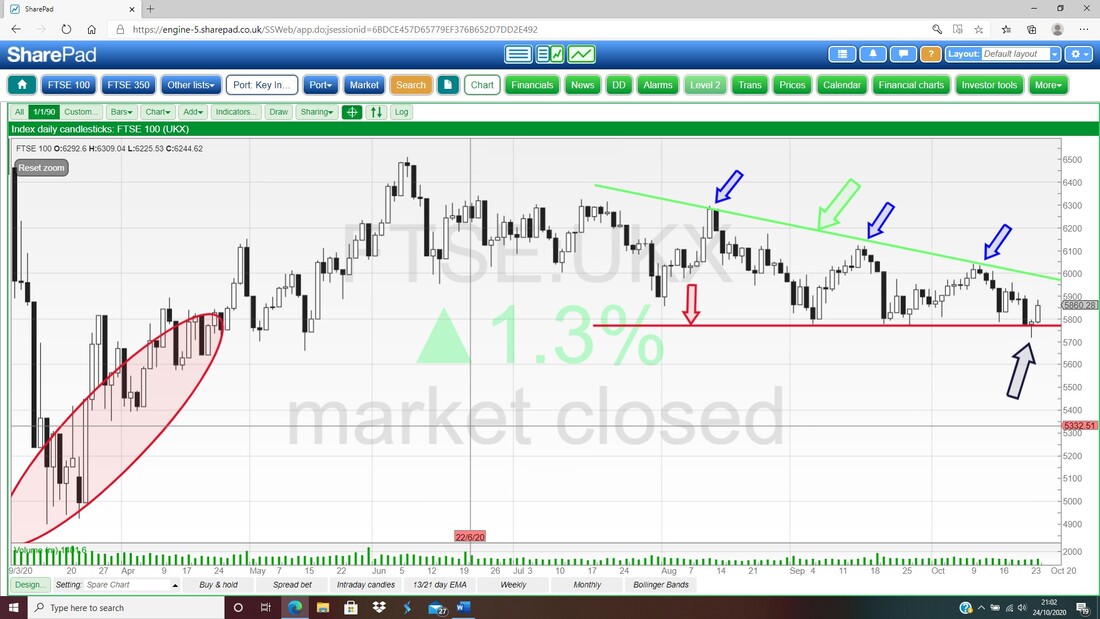
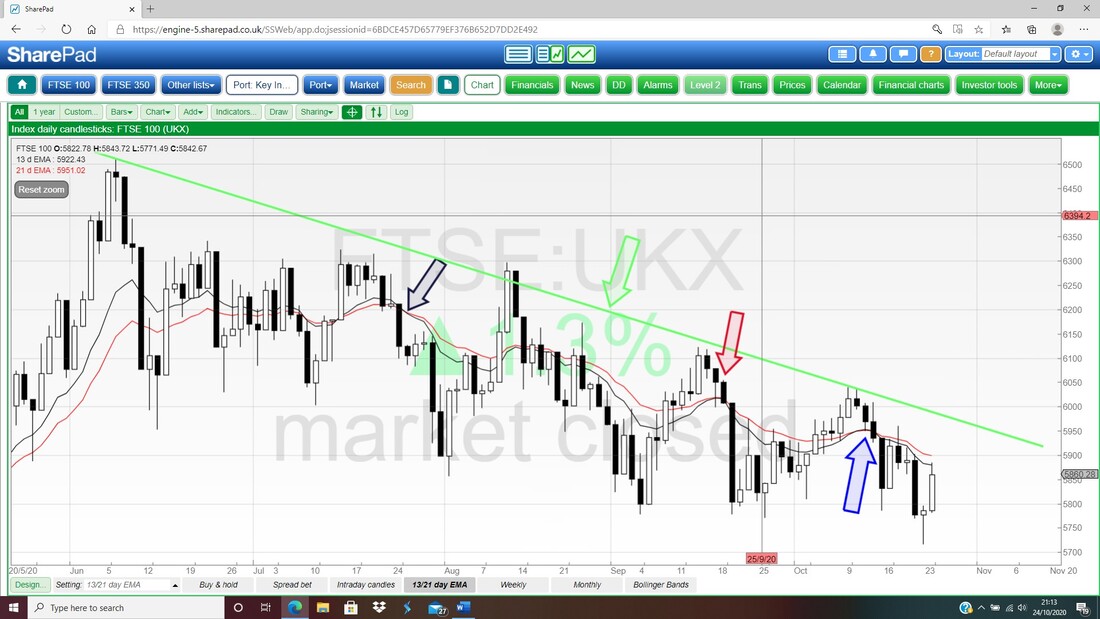
Next up most definitely one of my favourite Signals and what I am looking at here is the Blue Arrow which is marking a ‘Bear Cross’ between the Black Wavy 13 Day EMA Line (Exponential Moving Average) and the Red 21 Day EMA Line. This is still in ‘Bear Mode’ and will be until we get a ‘Bull Cross’ where the Black 13 Day EMA moves above the Red 21 Day EMA.
Next we have the Monthly Candlesticks for the FTSE100 but you must take what I am saying here with a big dollop of salt !! My Red Arrow is pointing to a Long Tails Doji Candle that has formed up so far for October but it is not valid for another week when the full Candle will be completed.
As it stands, October has clearly been a choppy month and if it remains as a Long Tails Doji then it is possible that the FTSE100 could turn up off of this. Note where my Blue Arrow is that the Candle for June was a ‘Bearish Shooting Star’ and the FTSE100 fell down from this Peak. 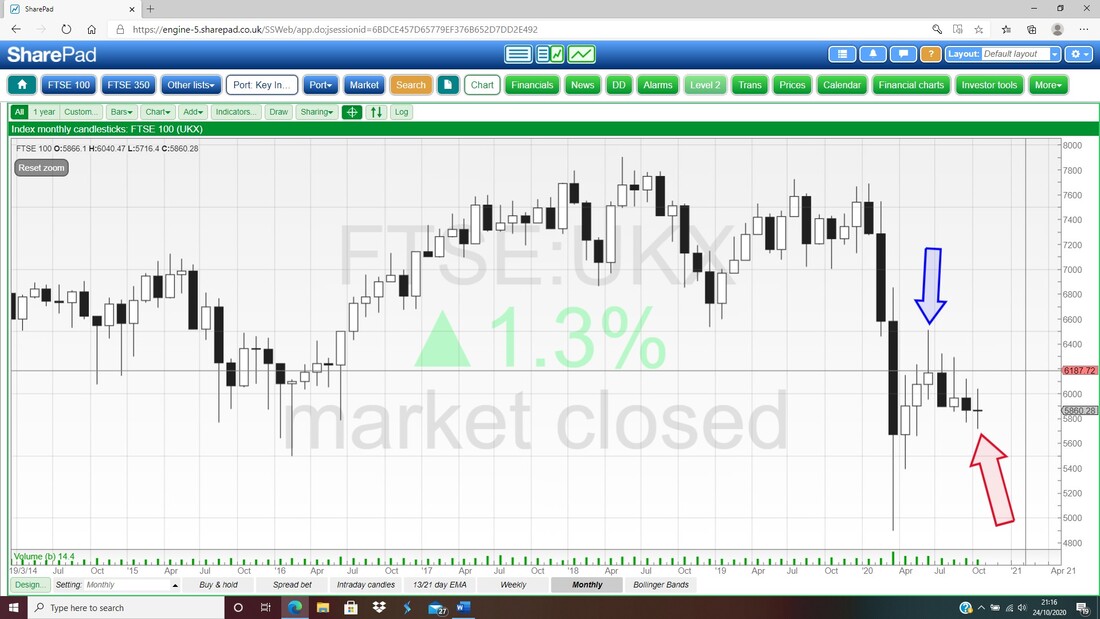
My Chart below has the Weekly Candles for the FTSE100 and my Blue Arrow is pointing to a Hammer shaped Candle for last week and it is very possible the FTSE100 can move up off of this, but in the context of a fairly tight and defined Downtrend Channel (as marked by my Green Ellipse and in line with the infamous Triangle) I suspect it might not get far.
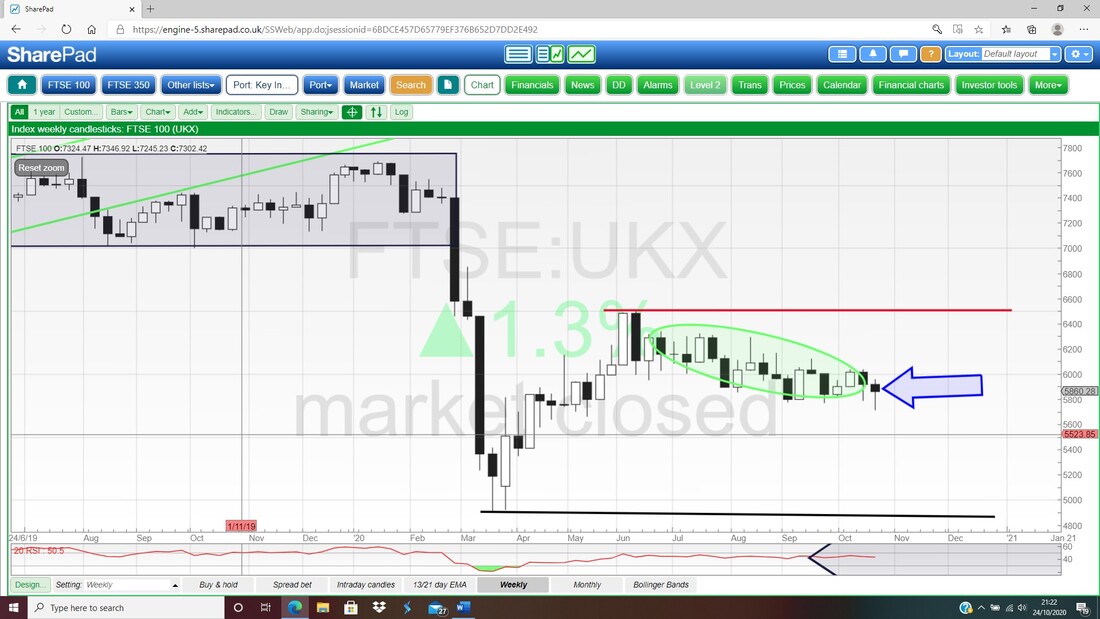
In the bottom window below we have the RSI (Relative Strength Index) for the FTSE100 Daily and on a Reading of RSI 42 where my Black Arrow is, this is not far off the Neutral 50 Level and is not at all Oversold. My hunch is that we will not see strength in the FTSE100 until we get a proper low RSI Reading down around RSI 28 or so, which will enable the Market to ‘clear’ in a Bull Capitulation.
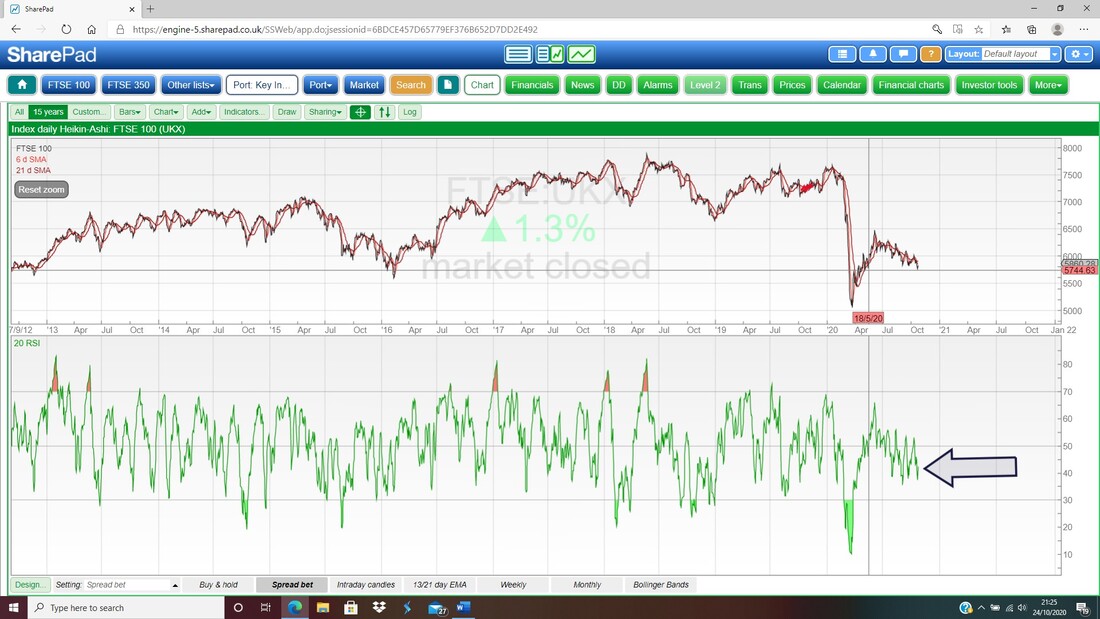
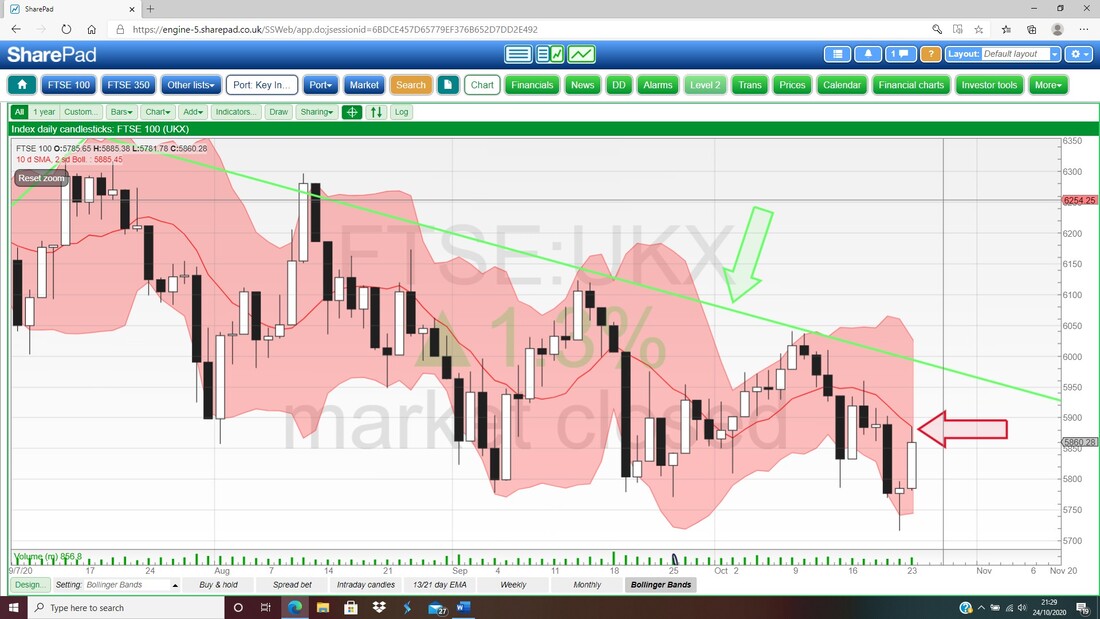
I wasn’t expecting much from the next Chart which has the Daily Candles for the FTSE100 and the Pink Zone is marking the Upper and Lower Bollinger Bands. However, it turns out to be quite interesting because my Red Arrow is pointing at the Red Bollinger Midpoint Line and note how on Friday the Price rallied up to that Midpoint Line at 5885 and then fell back. That could be a problem.
Brent Oil Composite
Oil has quite an impact on the FTSE100 so I always have a look at what is going on. My Chart below has the Daily Candles for Brent Oil Comp and my Green Arrow is pointing to a big Black Down Candle from Friday. Next Support is $41.85 but the really important Support is down where my Red Horizontal Line is at $38.85 (Red Arrow). To the upside, Resistance at $43.67 needs to be got over and then $44.31. My Black Arrow is marking a Bull Cross between the Black 13 Day EMA Line and the Red 21 Day EMA Line but note how they are now converging and if we have weakness at the start of the coming week then I would expect a Bear Cross to be triggered. 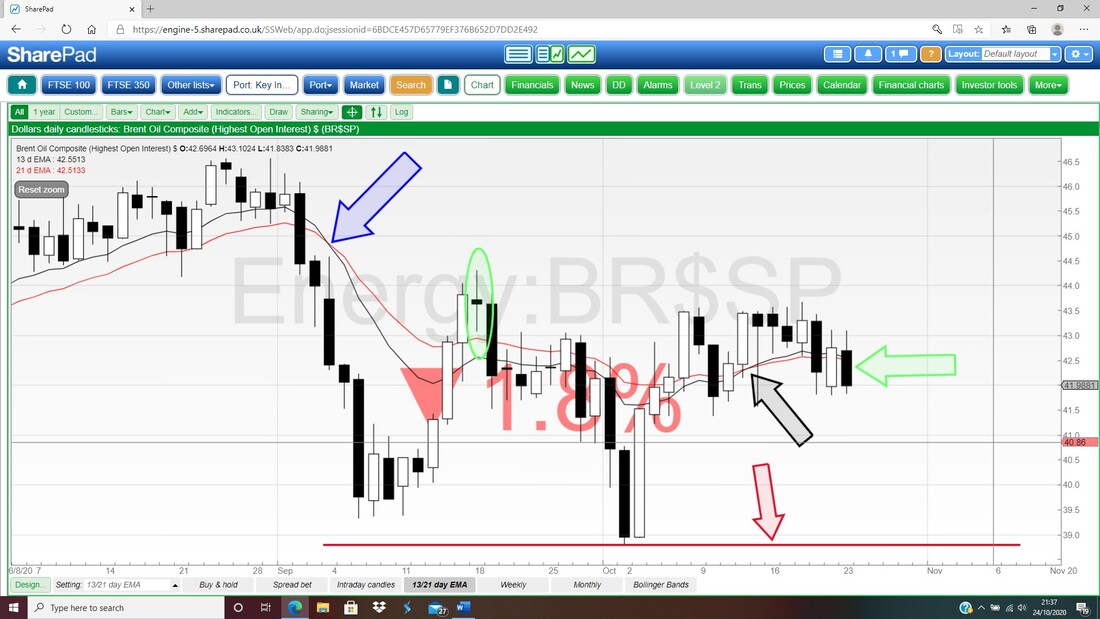
S&P500
I won’t show too much here because I want to nail this Blog and get it uploaded to the website. My Chart below has the Daily Candles for the S&P500 and my Green Arrow is pointing to a Hammer shaped Doji Candle from Friday which really just shows that the S&P500 is chopping about in a bit of a Range, which it has been doing all last week. To the downside, Support at 3415 from Thursday must hold and to the upside there is Resistance at 3477 then 3500 and up to 3550 where my big Red Ellipse is. I think I mentioned last week how the Red Ellipse and the earlier Black Ellipse could mark a Bearish ‘Double Top’ pattern and we need to watch out for this. However, my Blue Arrow is marking a Bull Cross between the Black 13 Day EMA line and the Red 21 Day EMA Line and that is in force still. 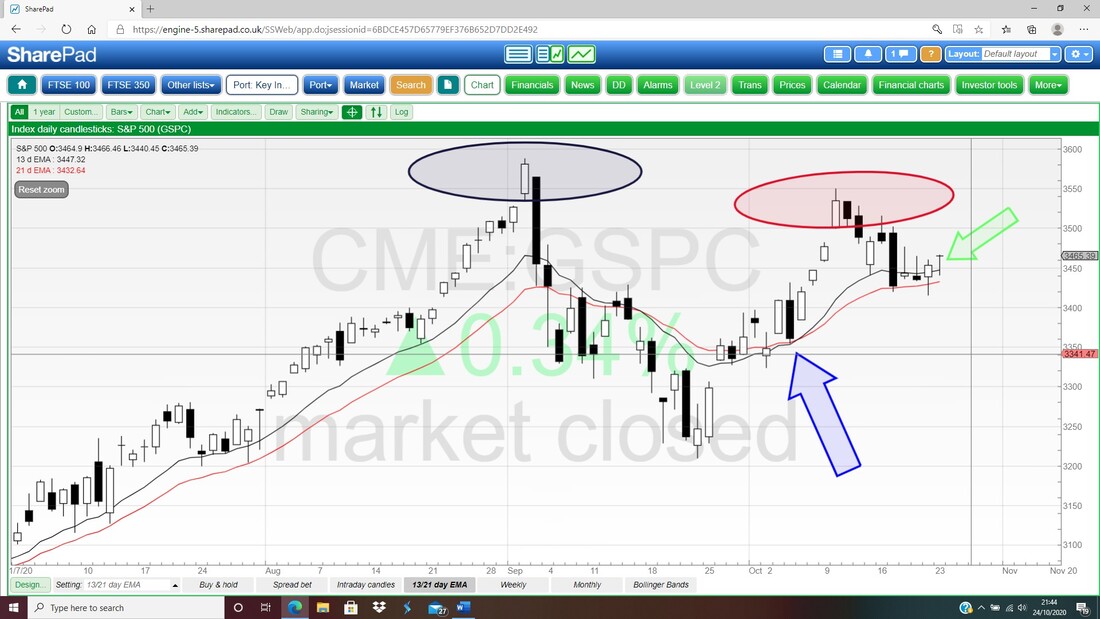
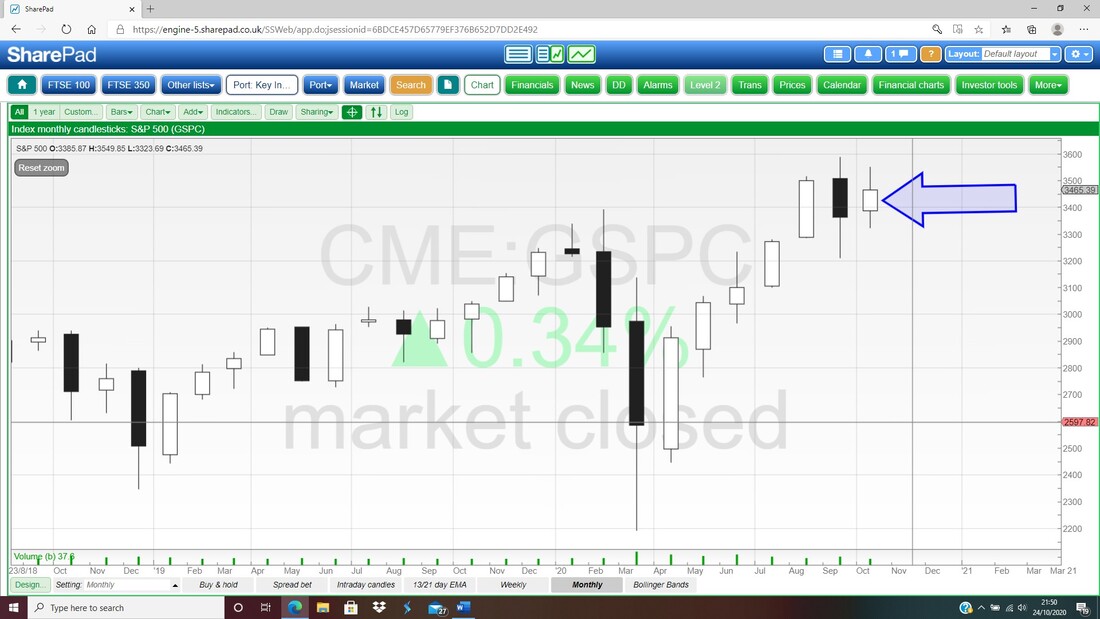
Next we have the Monthly Candles but my Blue Arrow is pointing to an incomplete Candle for October and at the moment this looks promising for the Bulls. The Candle for September was a big ugly Black Down one and this could be a Turning Point down, but if the S&P500 can either show some strength or at least go sideways in the final week of October, then that would be a good sign.
On the Weekly Candles for the S&P500 below my Blue Arrow is pointing to a Doji Candle from last week and after the sort of ‘Spinning Top’ Doji from the week before, this could be turning down a bit. On a more positive view, it could just be chopping sideways. The key is to watch the Support and Resistance Levels I mentioned on the Daily at the start.
Right, I will finish it there. Good Luck for the coming week and don’t let the Clock Change depress you too much !! Cheers, WD. 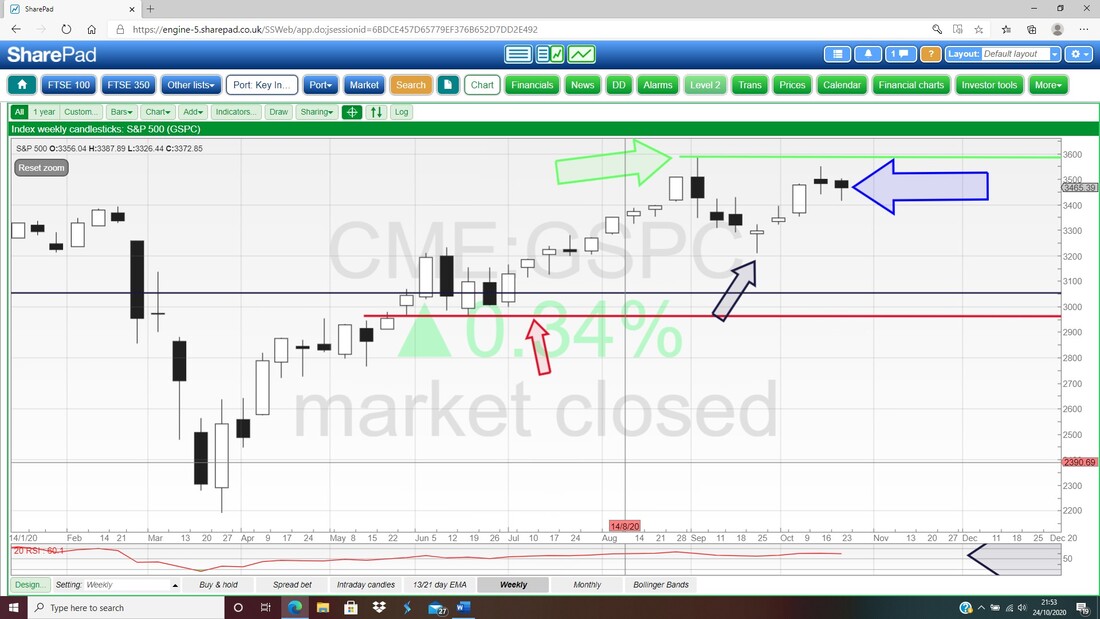
2 Comments
Kevin S
10/25/2020 09:27:44 am
Hi Pete,
WheelieDealer
11/1/2020 01:46:27 pm
Hi Kevin, Thanks for the comments. Leave a Reply. |

Stocks & Markets WheelieBlogsThese tend to be more Markets and Stocks related and timely - the Blog Page on the Main WheelieDealer Website has the 'Educational' stuff (well that's the theory anyway !!). Archives
October 2021
Categories
All
|
