

|
stocks & Markets blog |
|
I’m sure my old college buddy, Martin, will recognise my slight play on a common phrase we often used back then; but with the deeply depressing march of time it has got to the stage where a mere 2 pints can really muck me up !!
I blame the Lockdown and the unwritten rule I have that I will not allow myself to drink booze at home on my own (of course, in practice this rule is not actually cast iron !!), for my miserable intolerance to alcohol. So of course last night, I ended up having just this couple of real ales which made me feel ropey as hell today and as a result I am starting this blog about 3 hours later than ideally I should have.
Seeing as we now live in a full-on Police State and where snitches and grasses are as common as East Germany under the Commies, I can’t tell you what I got up to last night, but clearly catching any Virus was the last of my worries with how pants I felt this morning.
Last Week Bit of a funny one where it seemed like very hard work and there were several days when Markets were a bit wobbly; but then later on Thursday there was a huge Intraday Reversal in the US and this set-up a nice Recovery on Friday which the Bulls gleefully grabbed with both horns. As a result of these shenanigans, my Portfolio dropped 1.4% which wasn’t too much damage really and if luck goes my way then perhaps I can recover that small hit quite quickly. We have potentially another ‘funny’ week ahead of us because it is the Spring Bank Holiday in the UK and also US Memorial Day on Monday 25th May, so I would expect the tail end of the coming week to be low volumes and potentially a bit weird (that means we could get a lot of chopping about and big falls or big gains are equally likely !!). As usual I will get onto the Charts in a bit but my gut sense at the moment is that we might have a bit of Sideways Range trading to come for a while. Markets have bounced very well in anticipation of the Lockdowns being removed but clearly the World’s Economy is in a complete mess as Politicians have perpetrated perhaps the largest Policy Error ever. It is deeply depressing that we have such lunatics running our Countries and it is pretty obvious that if a proper Epidemic hits us we will have no defence in terms of Financial Firepower and I cannot see how we avoid years (if not decades) of slow Economic Growth at best – resulting from higher taxes and/or more Government Spending cuts – it is beyond belief how we could have got into this dire situation. Having said that, with all the Financial mucking about that the Central Bankers and ‘clever’ Policy Makers are undertaking, don’t be shocked if more QE and ever more negative Interest Rates continue to drive Equities up as the only game in town that pays any kind of Return (apart from Gold but I am very dubious about that). Blog Slate A few days ago I bunged out an Educational Blog on WD1 which hopefully gives Readers a good summary of my Approach to tackling the Markets and also has Links at the bottom to loads of previous Blogs that I have written on various topics related to management of my Stocks/Trades etc. Earlier today I had the sudden thought that I could link the concept of Ramping Stocks with how a Virus whips through a ‘virgin’ population as an Epidemic spreads – I think there is a blog I can write about this and it could be quite informative and hopefully reiterate the risks and dangers that Rampers present and warn a few more ‘virgin’ Newbies to be careful. Before that though, I want to write something about how I think Funds are best used and that will probably not be too long to write and perhaps I can get them both done quite soon. On top of those we are probably due to record another TPI Podcast later this week – no peace for the wicked and all that. And of course I still haven’t managed to do that ‘Weekly Performance’ page so I really need to refocus my attention on getting that finally written. Ah, before I forget, I updated the ‘Little Black Book’ on WD2 a few days ago with a load more interesting Stocks that could form a decent starting point for more research. From previous bouts of over-indulgence I have certainly been revisiting the Blog Archives in a big way lately (if you go to the ‘Blog Index List’ on WD2 then you can find the full list with Links for all the Blogs I have ever written), and tonight I am digging one out from back in March 2018 which was actually an interview I did for DIY Investor Magazine: https://wheeliedealer.weebly.com/educational-blogs/interview-previously-published-in-diy-investor-magazine Right, now we get to the Charts. Brent Oil Composite As per always, the Charts I show are Screen Grabs from the excellent SharePad software that I use and if you click on them they should get bigger on your screen so you can see a bit more detail. On the Chart below we have the Daily Candlesticks for Brent Oil Composite and what I am really interested in here is the ‘Bull Cross’ between the Black Wavy Line 13 Day EMA (Exponential Moving Average) and the Red Wavy Line 21 Day EMA – where my Green Arrow is. Such a Bull Cross usually implies weeks of upside so this bodes extremely well for more gains on Oil – and I expect rising Oil to drag the FTSE100 up with it (I have a Long Spreadbet on the FTSE100 so I would appreciate plenty of upside !!). My Blue Horizontal Line (Blue Arrow) is marking Resistance at $36.4 and if it can crack through this then where my Red Arrow is pointing there is Resistance at $39.55. If it can get above this Level and really $40, then we should see it back up to the $50 area pretty swiftly. My Black Ellipse is marking the sort of Hammer Candle which seems to have marked the Capitulation Bottom – this was the day that WTI Crude went hugely Negative and all the News Media were running the story. Note also my Black Arrow up in the Top Left Corner which shows a 13/21 Day EMA ‘Bear Cross’ and look how that predicted the falls. 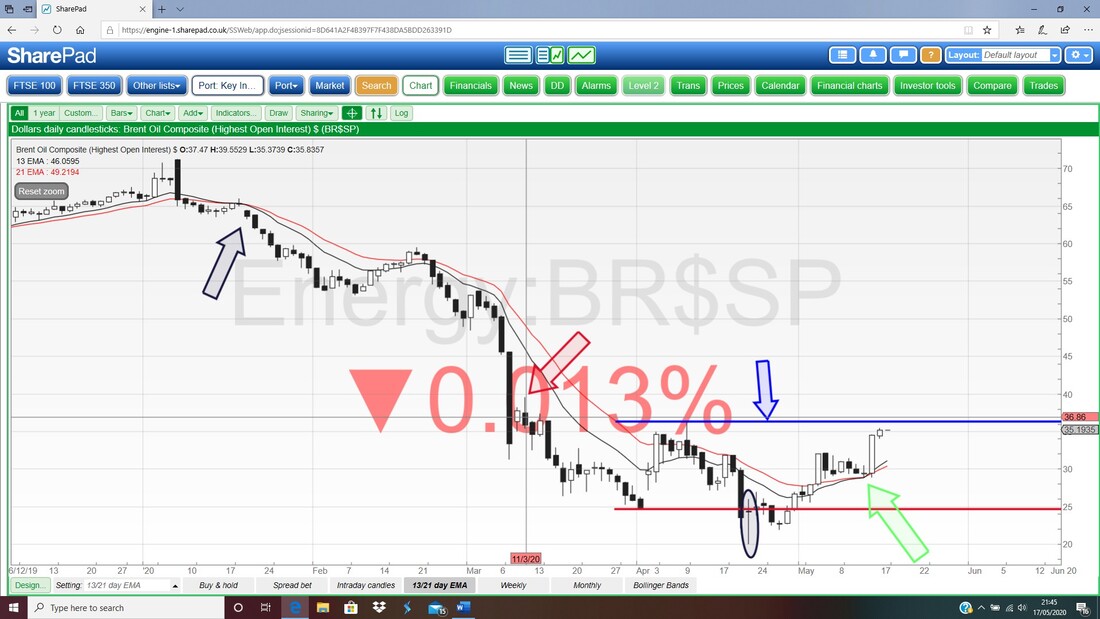
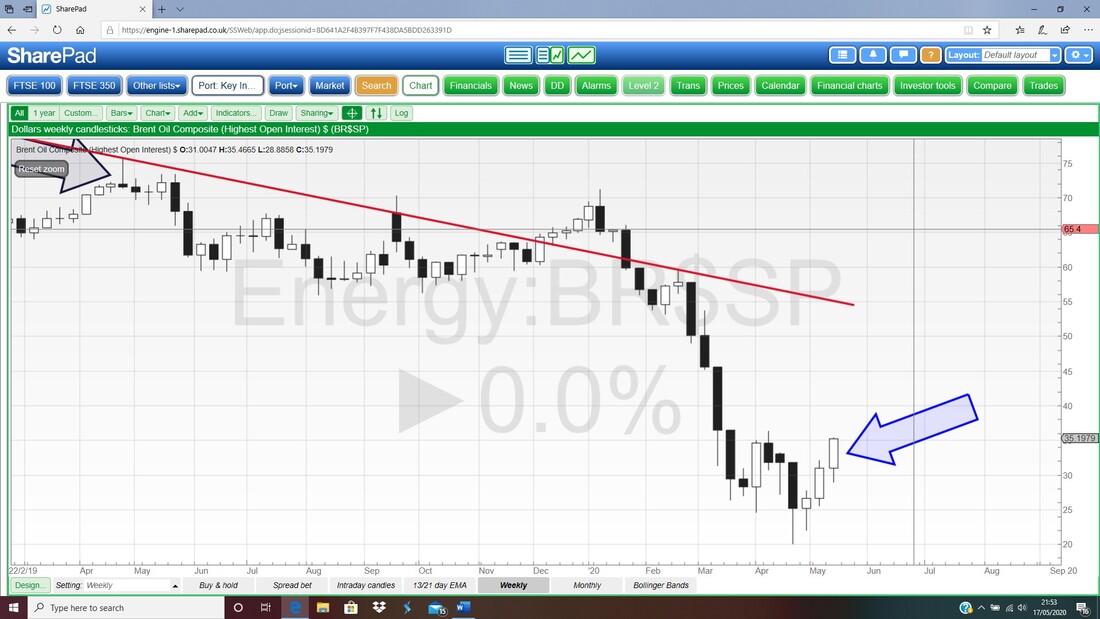
On the Chart below we have the Weekly Candles for Brent – my Blue Arrow is pointing to a nice White Bullish Candle from last week and this looks good for more gains.
S&P500
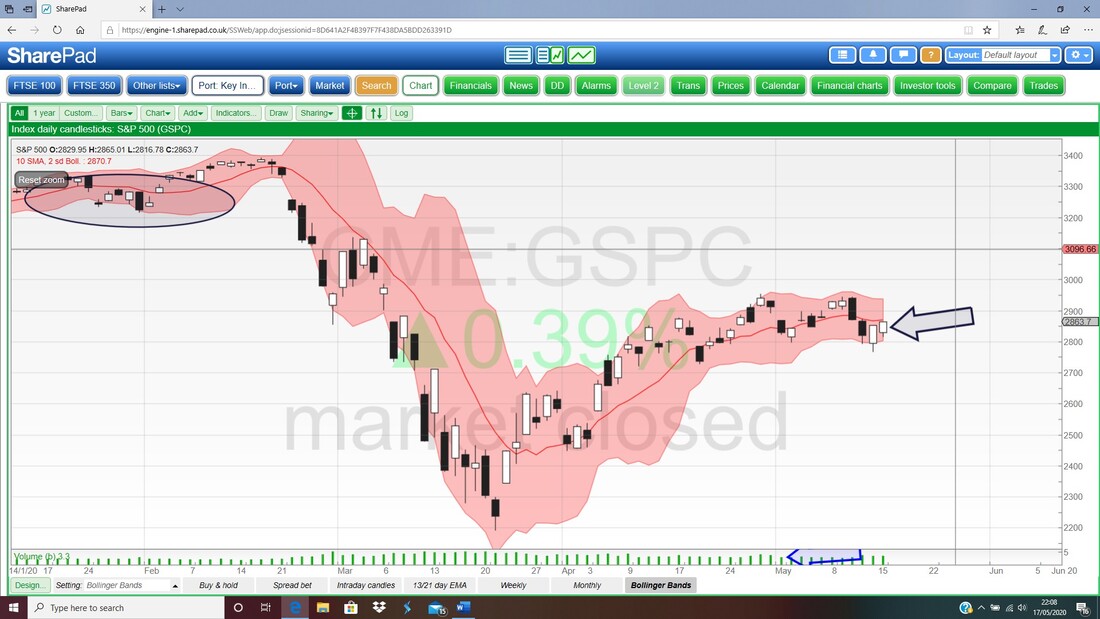
First up we have the Daily Candles for the S&P500 and my Red Arrow is pointing to a Bull Cross between the Black 13 Day EMA Line and the Red 21 Day EMA Line. This was triggered about 3 weeks ago and last week the Lines narrowed a bit but for the time being this is in Bull Mode. 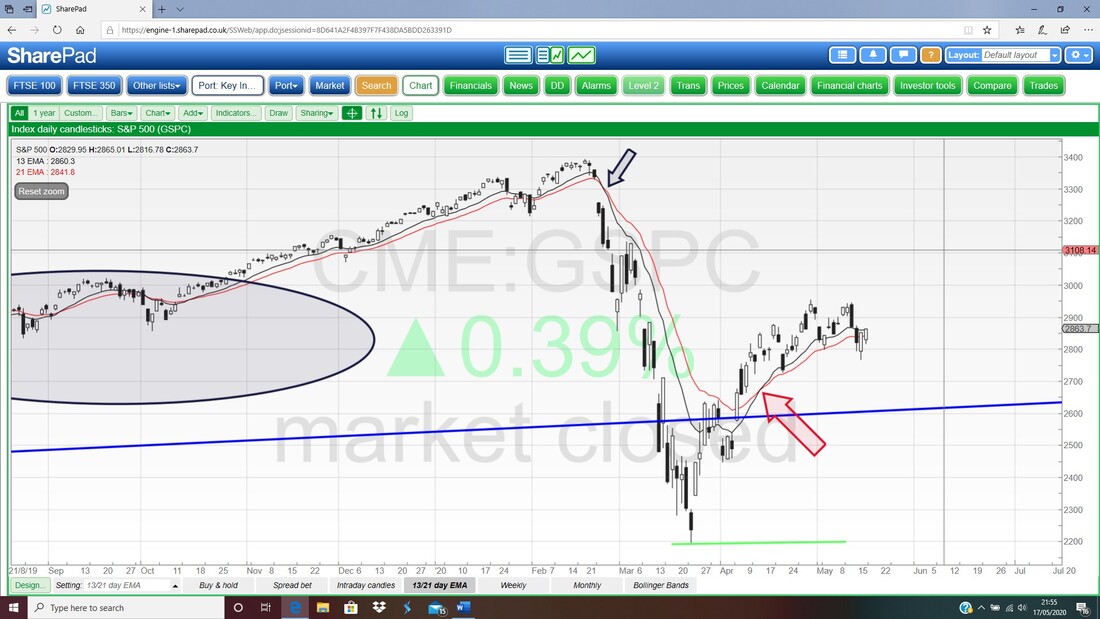
Next it is the Weekly Candles for the S&P500. My Blue Arrow is pointing to a Black Down Candle from last week but note how choppy it was with a bit of a Wick upwards and a long Tail below. What strikes me here is that the ‘Bearish Shooting Star’ from 3 weeks ago is still hanging over this Market and the Red Line (marked by my Red Arrow) marks Resistance at 2955 from the Top of this Shooting Star. Bulls must get the S&P500 through this Level.
The Low of last week was at 2766 and note how this is quite near the Green Line that I drew on this Chart ages ago when we seemed to have a bit of a Channel going on (between my 2 Green Lines). That Green Line could be Support. 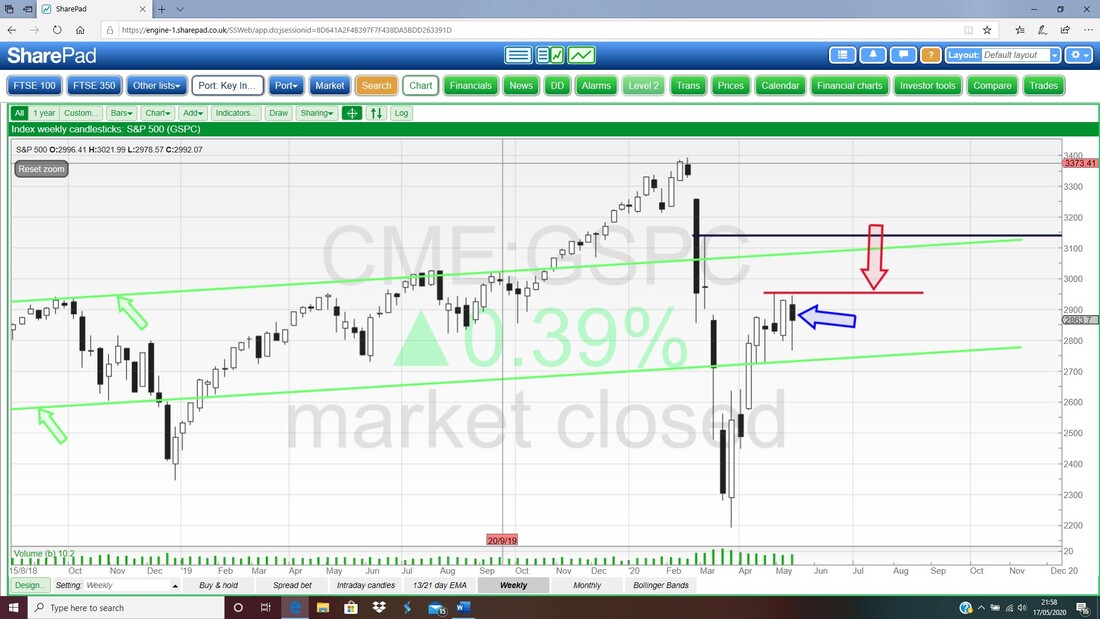
Finally for the S&P500 we have the Daily Candles with the Pink Zone marking the Upper and Lower Bollinger Bands. My Black Arrow is pointing at the Up Candle from Friday and on Thursday we had a rise off the Lower Bollinger Band which is technically nice. It is interesting that the Bands are quite tight now and usually as Bands tighten up and go narrow, this eventually ends with an Explosive move – which of course could be up or down and could happen many weeks from now. There are no guarantees the Bands will narrow but at the moment it looks that way.
FTSE100
First up we are looking very closely at the 13 and 21 Day EMAs and where my Red Arrow is we had a ‘Bull Cross’ but after this the Lines have moved very close together and the Bull Cross is still in force but it wouldn’t take much weakness to trigger a ‘Bear Cross’. I am Long on the FTSE100 so I would like to see the Black 13 Day EMA Line move promptly away from the lower Red 21 Day EMA in the next few days. 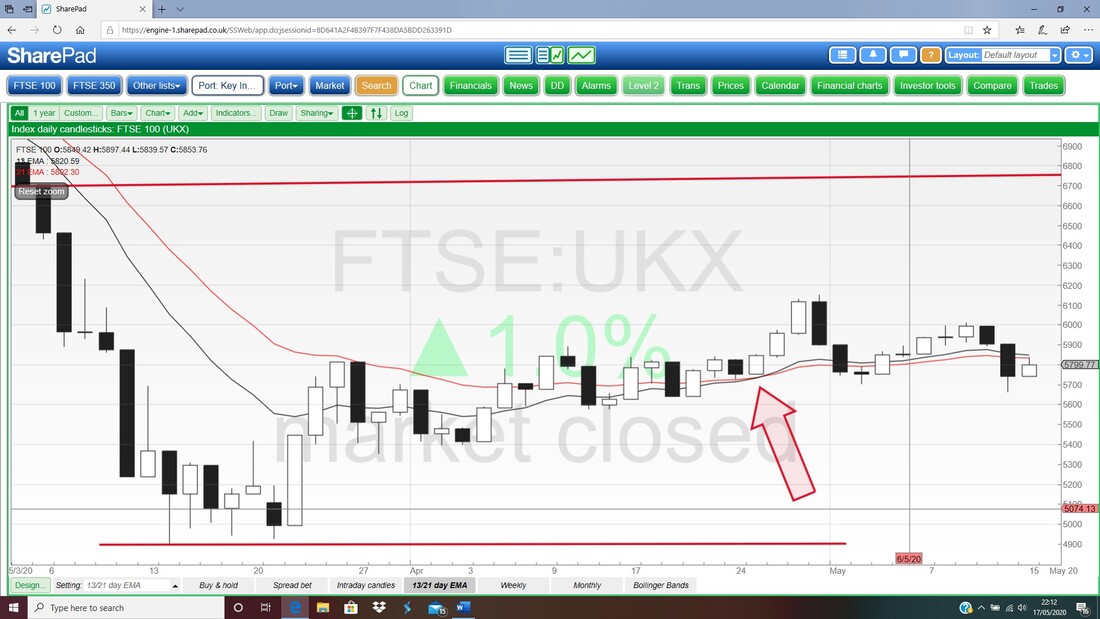
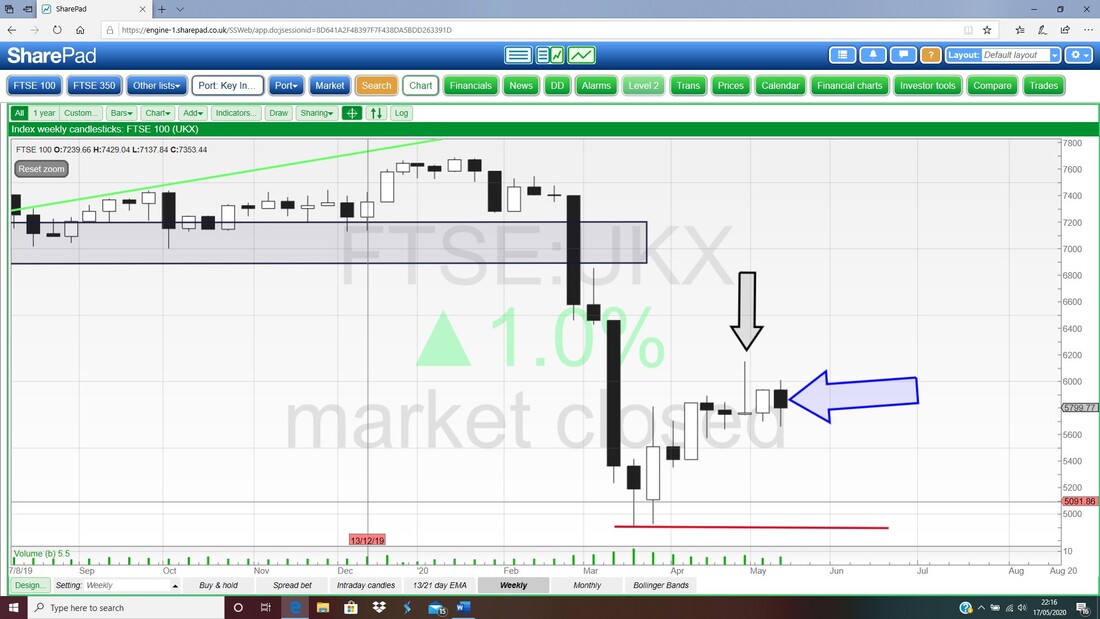
The next Chart has the Weekly Candles and this is similar to the S&P500 a bit. My Blue Arrow is pointing to a Black Down Candle from last week but again it was very choppy. The Bearish Shooting Star from 3 weeks ago where my Black Arrow is pointing is still a dominant feature on this Chart with Resistance at 6151, but note how this Shooting Star was not really ‘confirmed’ by a Lower Black Candle straight afterwards, and this gives hope for Bulls.
Last up we have the Daily Candles for the FTSE100 with the Bollinger Bands. My Red Arrow is pointing to a Small Up Candle from Friday and when you combine this with the Big Black Down Candle from Thursday, you get a 2-Day ‘Bullish Harami’ pattern. However, the context is not great as ideally you would get a Bullish Harami after a sustained move down.
But on the positive side, the FTSE100 did manage to move up from the Bottom Bollinger Band so that is technically nice. To the Upside we have Resistance at 6151 as I mentioned on the Weekly Candles and where my Blue Line is at 6231 there is more Resistance to get through. To the immediate Downside, there is Support at 5661 from the Low on Thursday – if this fails, then the next strong Support is at about 5351. OK, that’s it for this blog, good luck in the coming days and make sure you wash your mitts regularly !! Cheers, WD. 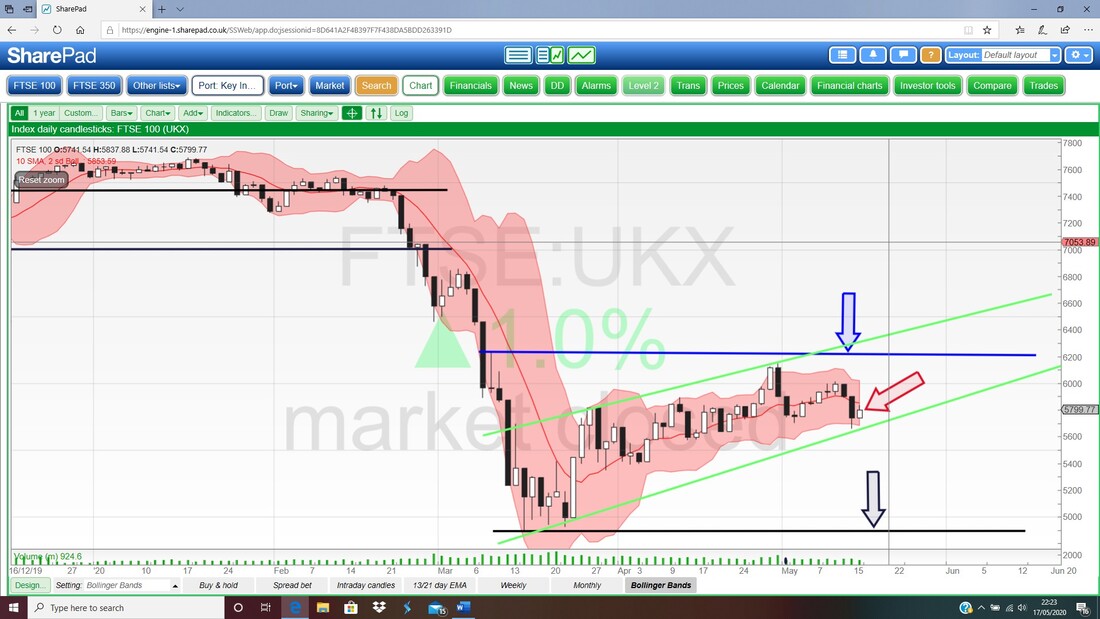
0 Comments
Leave a Reply. |

Stocks & Markets WheelieBlogsThese tend to be more Markets and Stocks related and timely - the Blog Page on the Main WheelieDealer Website has the 'Educational' stuff (well that's the theory anyway !!). Archives
October 2021
Categories
All
|
