

|
stocks & Markets blog |
|
That’s a pretty extreme bit of titling for this blog but I want to just quickly mention that after a fairly minor but very irritating problem with the WD1 Website when viewed using a Mobile device with the latest version of Android, I spoke to Weebly Support and they have suggested that I change the ‘Theme’ of my websites to a more up to date one.
I find stuff like this remarkably irksome and I just see it as a distraction from getting on with what I should be doing which is going to the pub and writing blogs and putting out tweets when I am in the mood. I am never in the mood for what to a large extent I just see as hygiene nonsense related to IT that rarely does what I like it to do for long !!
Anyway, according to Weebly Support the newer Themes are what they call ‘responsive’ and I take this to mean that they are better at adjusting to different types of screens automatically and perhaps it will ultimately mean a better viewing experience for Readers but I suspect the ‘improvements’ will be marginal if any. So last night I had a play around on the Weebly Editor and I tried out a lot of Themes but to be honest none of them grabbed me. It is pretty good because you can click on a potential Theme and then it shows you what the WD Website would look like with that applied. Trouble is none of them really appealed and after not very long at all I got quite bored and decided watching some cr*p on TV was far more pleasurable !!
Part of the issue is that I don’t want to change the ‘look & feel’ of the Websites too much because I want to keep the same sort of ‘grey’ kind of imagery and the font and stuff but a lot of the new Themes I tried are way too flashy and poncey. No thanks. I am sure I will find something I like and over the next couple of weeks don’t be surprised if you go to the Websites and they look totally different. I won’t change the Page Layouts or anything but it might be a bit of a shock when you see it for the first time !! On a sort of related matter I have been having some trouble with the upload of images to my Website and they are coming out all fuzzy. Anyway, Weebly Support have made some suggestions and I have perhaps figured out a solution but I won’t know if it has worked until I upload tonight’s blog and see how it looks. If it hasn’t worked and the images are still a bit pants, then don’t worry you should still be able to figure out what you need to see and I will keep working on it until I crack the problem. Maybe changing the Theme will help that too. I could do without crud like this especially as I hope to be picking up my Mazda MX5 at long last later this week and if the weather actually indulges me and does the decent thing and improves a lot, then hopefully I will be out having fun in that nippy little jalopy. New TPI Podcast I don’t want to spend hours and hours on this blog so I will point you in the direction of our latest Podcast TPI 18 which was released on Friday and in it we cover lots about the current state of the Markets and what to watch out for in terms of signals. Since we issued this we have had the news today that the Italian Government is locking down the Lombardi Region and this is highly significant because it indicates that even Governments in ‘democracies’ are prepared to take some pretty draconian measures in order to attempt to get this Virus under control. The nub of the problem is that measures like this that are taken to control the Virus are precisely the sorts of things that will kill the economies. The Italian economy is already extremely weak before all this and it is pretty much certain that they are now into Recession. Italy is the second largest economy in the European Union and it is highly likely that as the Virus spreads we will see the whole of the EU slip into Recession. It is difficult to see what Authorities can do to prevent this as the Demand-shock from people staying at home and with lots of public gatherings cancelled cannot be cured just by lobbing money into an Economy which has nothing to spend it on. The US strikes me as a big potential issue because it seems like Trump is in denial and I suspect that once the Stockmarkets figure out that the US is going to suffer the same problems as everywhere else, then we might see the US Indexes take a decided move downwards. I will keep monitoring the Charts and I am ready to Short more if I see the need. As I mentioned on the Podcast, despite the falls so far, we aren’t really all that far away from the recent elevated Peaks when the Markets were clearly very complacent. Here in the UK we had a big rise in the number of Infected Persons today (Sunday) and there is little doubt we will follow a similar path to all the other Countries in which it has taken root. I have no idea if things will get as bad as Italy but it seems a very unreliable assumption to think that we are a special case and won’t have similar challenges. On Wednesday we have the Budget and no doubt this will have plenty of measures to try to stimulate the Economy and to soften the impacts of the Virus but I doubt this can do much. We might get a jump in the Markets but I suspect that will soon fizzle out. On Thursday the European Central Bank (ECB) has a Meeting or something and no doubt we will hear much about the Virus and the potential for Recession from that. Anyway, you can hear Podcast TPI 18 on Soundcloud on the link below and if you use Apple or Audioboom then go to the ‘Conkers Corner’ Channel and you should find it there. If you ‘Subscribe’ to the Channels then you will be notified as soon as new Podcasts are released and we expect to be doing them fairly regularly: https://soundcloud.com/user-479955511/conkers3-wheeliedealer-18-coronavirus-related-investing-volatility-ftse-spt-hnt-gns-aapl Last Week Well, we had a bit easier time of it last week after the big whacking we got the week before and my Portfolio slipped 1.5% and I feel I got off quite lightly. For 2020 so far I am down 8.3% which is pretty painful but I am more Hedged now which should help a bit going forwards if we get more grief; and if Support fails in coming Days I will be Shorting more. As I have mentioned on Tweets recently, my Strategy is to hold tight with the Stocks I have and to Hedge to an extent on the down-leg and then when we start to rebound I will be looking to go Long on an Index and gain more on the Recovery phase. Of course this is not easy to do but there are many Indicators which I will be using to highlight when we are over the worst and the way to play it best will be to scale in to a position and to scale out. My expectation is that the current difficulties are going to be with us for many months and one of the key things I will be looking for is a clear indication that the number of new Virus Cases in Western Countries is starting to decline – the Markets might start to stabilise once this happens I suspect. We shall see and of course I will be using a few simple Technical Indicators on the Charts to tell me when to make my moves. It won’t surprise me if we have around 6 months of aggravation now as the Summer is often pretty rubbish and it would line up with the normal length of Recessions and Bear Markets and stuff. This would mean that the time to Buy again could be towards the end of the year in November/December. We shall see but it helps to have a possible roadmap in mind. Blog Slate A few days ago I issued an ‘Educational’ Blog on WD1 about my views on these Monthly Payment Schemes for Unit Trusts and stuff and where they can be of sense and what the pitfalls are. With the Markets like they are I am loathe to write too much about individual Stocks and I am certainly not going to be buying any so I am most likely going to be picking some blog topics I fancy writing about. At the time of scribbling this I have one in a rough draft which is about the importance of having a Strategic and Flexible Plan at times like this and that may come out later this week. I have lots of other things to write about and I also need to update the ‘Weekly Performance’ page so I have plenty to do !! ***THE TEXT ON THE SHOWS BELOW IS PRETTY MUCH THE SAME AS IT WAS A COUPLE OF WEEKS AGO BUT OF COURSE SINCE WRITING THIS THE VIRUS SITUATION HAS CLEARLY GOT MORE PROBLEMATIC AND GOD ONLY KNOWS WHETHER OR NOT THESE EVENTS WILL GO AHEAD. AT THIS POINT IN TIME I INTEND TO GO TO MELLO AND MASTER INVESTOR BUT I DO OF COURSE NEED TO BE A LITTLE CAUTIOUS ABOUT MY HEALTH*** Master Investor Show Islington This is taking place on Saturday 28th March 2020 and is held at the Business Design Centre (BDC) in Islington which is in that London. I have probably been to this for most years over the last couple of decades and it can be worthwhile both for the Speakers and the chance to meet up with other Investors, although the Companies tend to be dominated by Oil & Gas and Resources AIM stuff which is certainly not my Cup of Darjeeling. Having said that, there are usually a handful of proper Companies and at least the limited choice makes it easy deciding which Stands to visit !! The Admission Fees are pretty cheap but if you use Discount Code BFMI you can probably get a FREE ticket: https://investoraccess.masterinvestor.co.uk/events/master-investor-show-2020/ I have booked my ticket and no doubt I will be mostly hanging around the Canteen area on the top floor. There is a Restaurant of some sort next door and usually we pop in there later. Nearer the time I will tweet my plans and whereabouts out most likely. Mello Chiswick Anyway, the TWIT50 is not me but it is a cracker of a Discount Code that David Stredder @carmensfella has put out for just a few more days which gets you 50% off Tickets to the Mello Event in May at a Hotel in Chiswick and it could be well worth Readers taking advantage, as many have already. The more Stocks and Companies bit runs on Wednesday 20th May and Thursday 21st May and then there is a Funds day on the Tuesday 19th which you might fancy. I had been telling everyone that I will be there on the Friday, but that is going to be rather lonely for me !! We are due to run a ‘TPI Live’ session and we are yet to determine which day it will be – I will let you know as soon as I know, but it won’t be the Tuesday. You can find out more and book tickets using your TWIT50 Code here: https://melloevents.com/event/ These really are the truly premier Private Investor Events in the UK and the quality of the Companies presenting is of a considerably higher standard than all the Oil & Gas stuff you get at the lower priced London Shows. Not only do you get the chance to speak to loads of Companies and see a myriad of Presentations in the various rooms, you also get the opportunity to hang out in the bar with the top echelon of Private Investors in the Country and the collective wealth of the attendees must be immense. It is rare for David to give us a chance to get 50% off so make sure you go for it. If you find just one decent company that you invest in, it will more than pay for your tickets if it works out as you would like. I’ll see you there !! WheelieBash2020 When my good mate Aston Girl @Reb40 joined me and a couple of other buddies in the Pub for my birthday recently, we discussed a possible WheelieBash date for 2020 and I can now confirm after chatting to her earlier today, that the Bash will be on Saturday 5th September. So shove that date in your diary and I will give more details much nearer the time but as usual it will be FREE to attend and you just need to get your butt down to Windsor and it will most likely be at The White Hart in Winkfield which is where we normally hold it. Everyone is invited but I think we are limited to 60 spaces so first come first served and all that. If you go to the ‘Events’ page on the website you should find piccies of previous WheelieBashes. I have discovered ‘Open DMs’ on my Twitter Settings and have now turned that on so anybody can Direct Message me even if I am not following you – so feel free to get in touch and let me know you want to come to the Bash. You can email me also on [email protected] UK Investor Show **IT LOOKS LIKE I WILL NOT ATTEND THIS SHOW ALTHOUGH I HAVE YET TO CONFIRM THE ALTERNATIVE SOCIAL ENGAGEMENT I MIGHT HAVE. I WILL MOST LIKELY BE AT MASTER INVESTOR THOUGH** There are 2 big Shows that I have been to in past years which of course are Master Investor in Islington and this one that is usually in Westminster. It takes place on Saturday 25th April 2020 but at the moment I am not thinking of going to it but I thought Readers might be tempted. Anyway, you can find out details here: https://www.ukinvestorshow.com/ If you do want to go, then do a search for ‘Discount Codes’ or shout on Twitter or something and usually a FREE ticket can be tracked down. Look what the Wind blew in This Blog is from back in draughty November 2016 and in light of current circumstances it is not particularly relevant but perhaps Readers will enjoy something a bit left field and more appropriate to sunnier times !!! This is a link to Part 3 but there are links at the bottom of it to the earlier parts: https://wheeliedealer.weebly.com/educational-blogs/the-psychology-of-the-topchop-part-3-of-3 OK, better do the Charts……. S&P500 As always the images are taken from the excellent SharePad software I use and if you click on them they might get larger so you can see more detail but with the problems I have been having there are no guarantees of this !! I want to start off with ‘big picture’ stuff and try to get a sense of how far the Markets are likely to fall. The Chart below is quite a long-term one for the S&P500 and goes back to around 2008 so it shows the Bull Market since the Credit Crunch very clearly. I showed a similar Chart last weekend but I have done a few tweaks to this to point out some important (but rather scary !!) stuff. First off look at the Blue Uptrend Support Line (marked by the Blue Arrow) – this is clearly an important Line and if the Bull Market is broken then it is a simple reality that this Line will fail. That means we go below about 2600 or so and if that happens then it is very likely that people will be focused on my Black Arrow at about 2350 and this must be pretty strong Support. If that fails then we dip towards my Black Ellipse which is a Zone of Support from 2200 down to near 1800. Now we have some sneaky Technical Analysis (TA) stuff that is pretty terrifying – I can’t see it playing out this way but it is possible and we must be on our guard. It is a standard TA concept that Fibonacci Levels are very useful for indicating where Chart Prices can move to and it is pretty simple maths stuff that occurs a lot in nature and it is very predictive when doing Chart analysis. What I am interested in here are Fibonacci ‘Retracements’ which are where a Price has moved in an Uptrend (or Downtrend !!) and then ‘Retraces’ to drop back and cover old ground, but it tends to do this with the distance pulled back being 38% of the prior move, then 50% and then 66% - these are all moves back from the Peak of the prior move (I might have those exact Percentages wrong but they are close enough for tonight !!). SharePad has the ability to draw Fibonacci Retracements and Projections but I haven’t played with it yet and I want to crack on with getting this done. For that reason I have used my Calculator to work out the distances and I have put Arrows in on the Right Hand Side to point to where each of the 38%, 50% and 66% would take us. My Red Arrow is pointing to about 2100 and this would be a 38% Retracement from the Peak at around 3400. Note this would coincide with the Support Zone in my Black Ellipse so there is some sense to that level. My Green Arrow is pointing to about 1700 and this would be a 50% Retracement from the Peak at around 3400. This is below the Black Ellipse and is obviously very scary !! My Pink/Purple Arrow is pointing to about 1150 and would be a 66% Retracement from the Peak at around 3400. This is too scary to even think about !! Let’s move on because I think we are all white as a sheet now !! 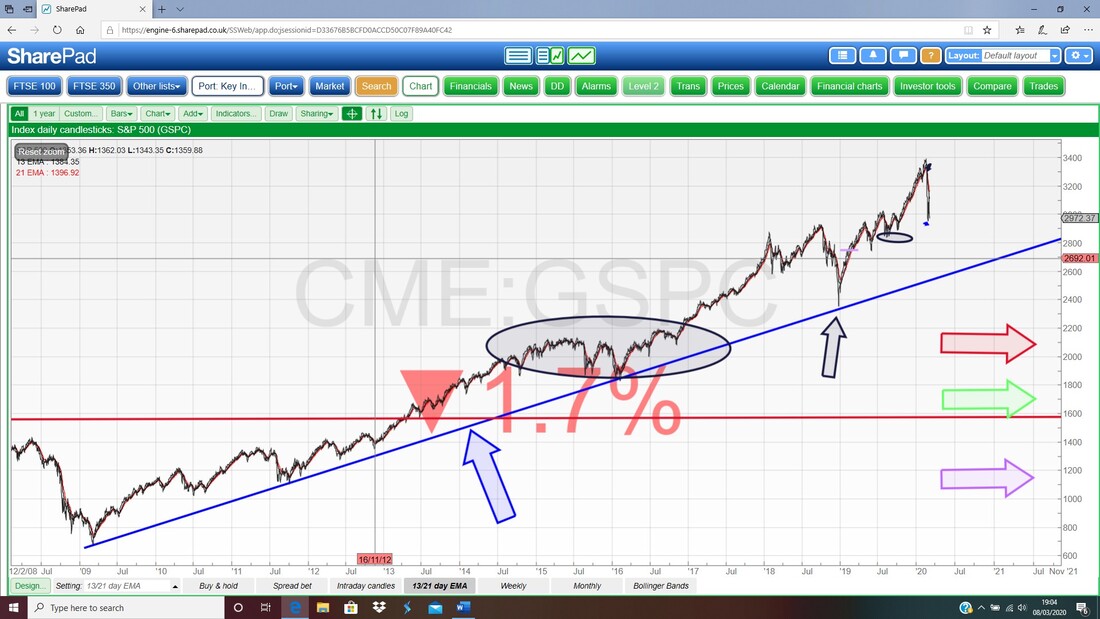
The bottom window on my Screen below has the RSI (Relative Strength Index) for the S&P500 Daily and on a reading of RSI 33 where my Black Arrow is this is a very low reading and suggests it is oversold. However, when a Market is extremely weak like it probably is now, the RSI Indicator can stay very low for a while.
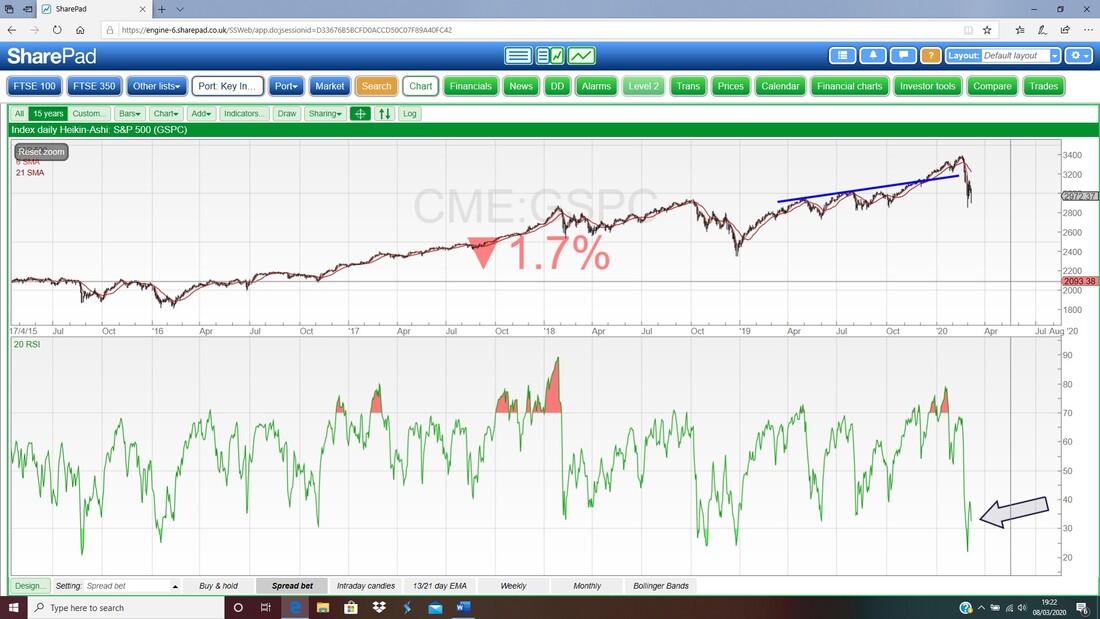
My next Chart has the Daily Candles for the S&P500 but what I am interested in here is the interaction of the Black 13 Day EMA (Exponential Moving Average) and the Red 21 Day EMA. My Black Arrow is pointing to a ‘Bear Cross’ on these EMA Lines and this is still in Bear Mode and until we get a ‘Bull Cross’ (which is where the Black 13 Day EMA crosses over the Red 21 Day EMA from underneath), this Market is weak.
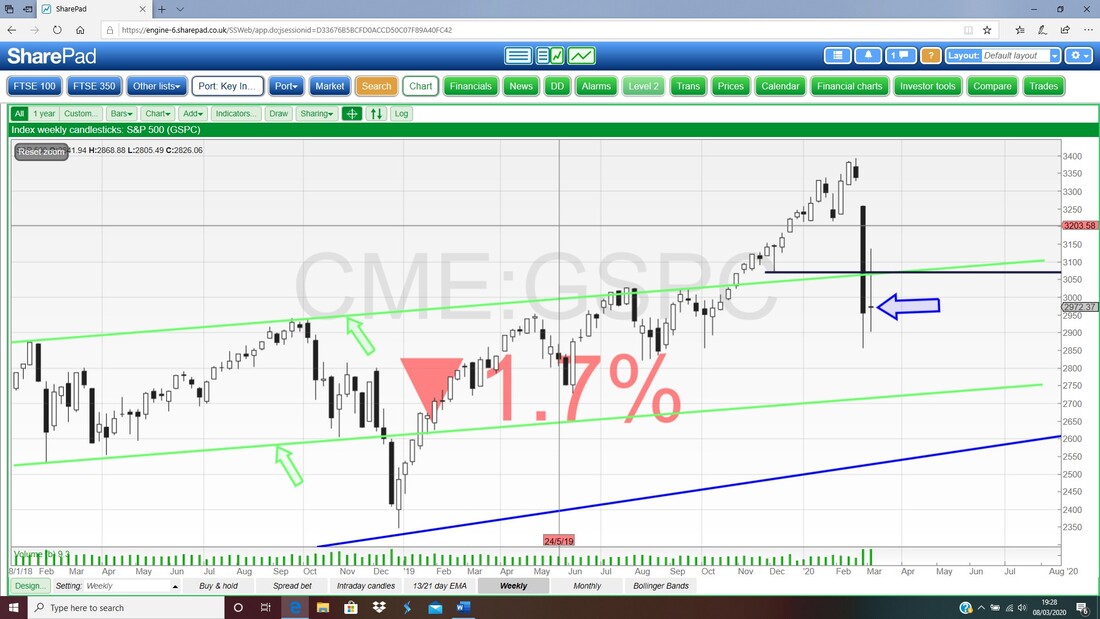
There might be some hope on this next Chart. Here we have the Weekly Candles for the S&P500 and my Blue Arrow is pointing to a ‘Long Tails Doji’ Candle which after the Long Black Down Candle of the previous Week suggests that the Bulls are fighting back. The key here is first Support at the bottom of last Week’s Candle at about 2900 and then the Support at the Low of the previous Week’s Candle at about 2850.
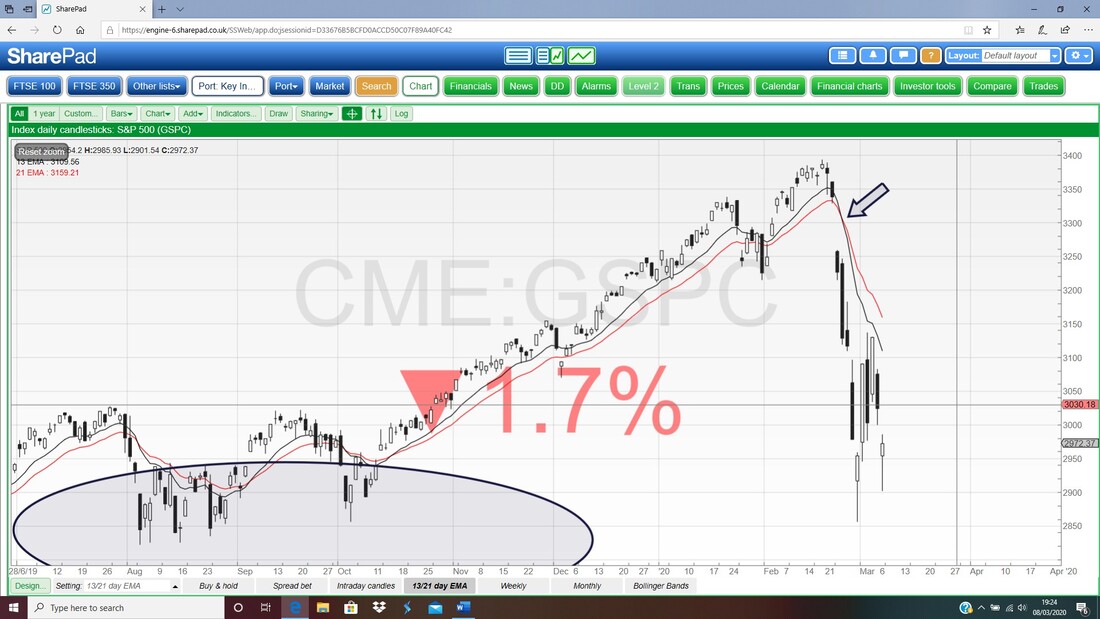
This last Chart for the S&P500 has the Daily Candles and the Pink Zone marks the Upper and Lower Bollinger Bands. My Black Arrow is pointing to a sort of Hammer Candle from Friday and note how it found Support at the Bottom Bollinger Band which is quite nice and this suggests we could see a move up.
It strikes me there is a bit of a Sideways Range here between my Green Line at the Bottom (Green Arrow) which must hold as Support at about 2855 and my Blue Line at 3127 (Blue Arrow) which capped the recent attempt to rally. If that Green Line fails as Support that is a Sell Signal and I will Short the S&P500 more. 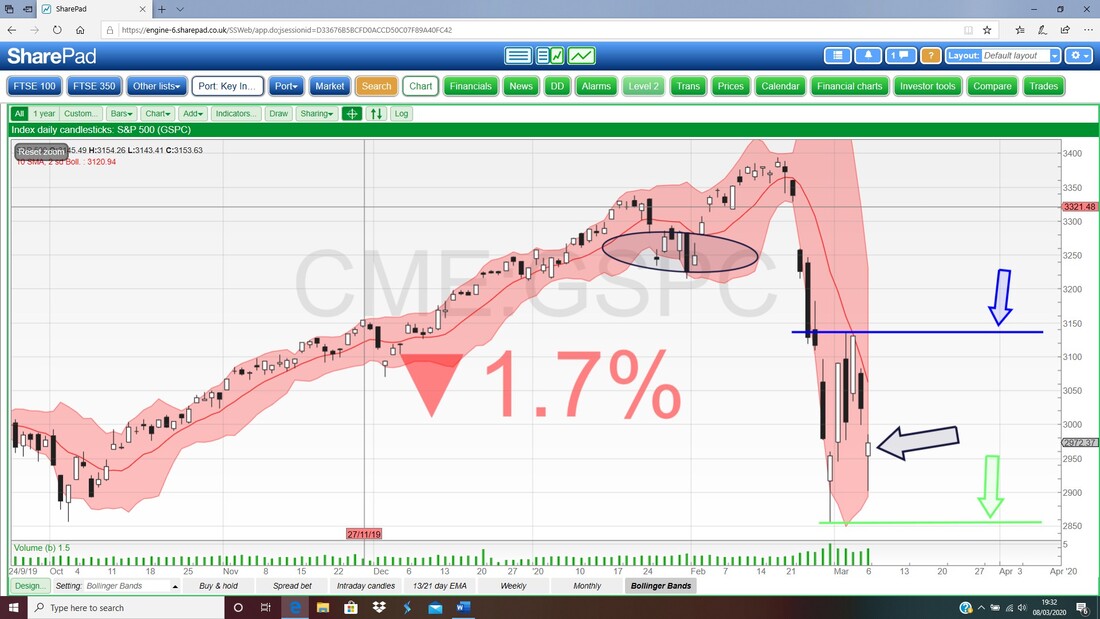
FTSE100
I don’t want to spend ages on this so I will whizz through some stuff. First up is the Weekly Chart for the FTSE100 and my Blue Arrow is pointing to what is mostly a Down Candle for last Week and this looks pretty Bearish. 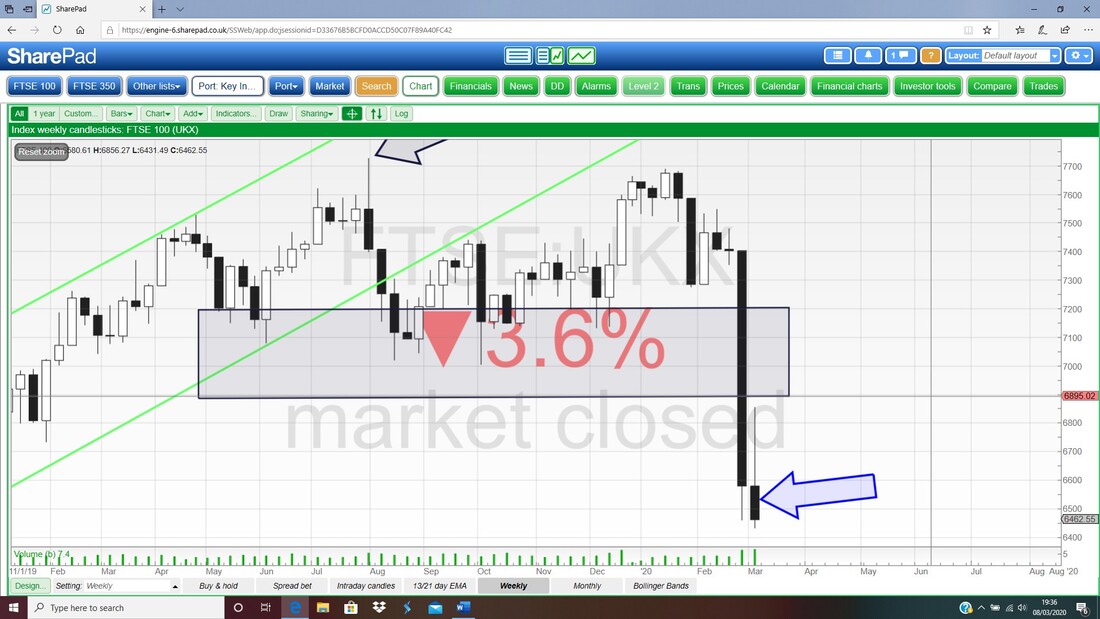
In the bottom window below we have the RSI for the Daily and on a reading of RSI 25 this is extremely low. It can stay low for a while but this is an extreme level so I would expect a bounce of some sort soon. However, don’t get too excited because any bounces could fizzle out quite quick with the current environment.
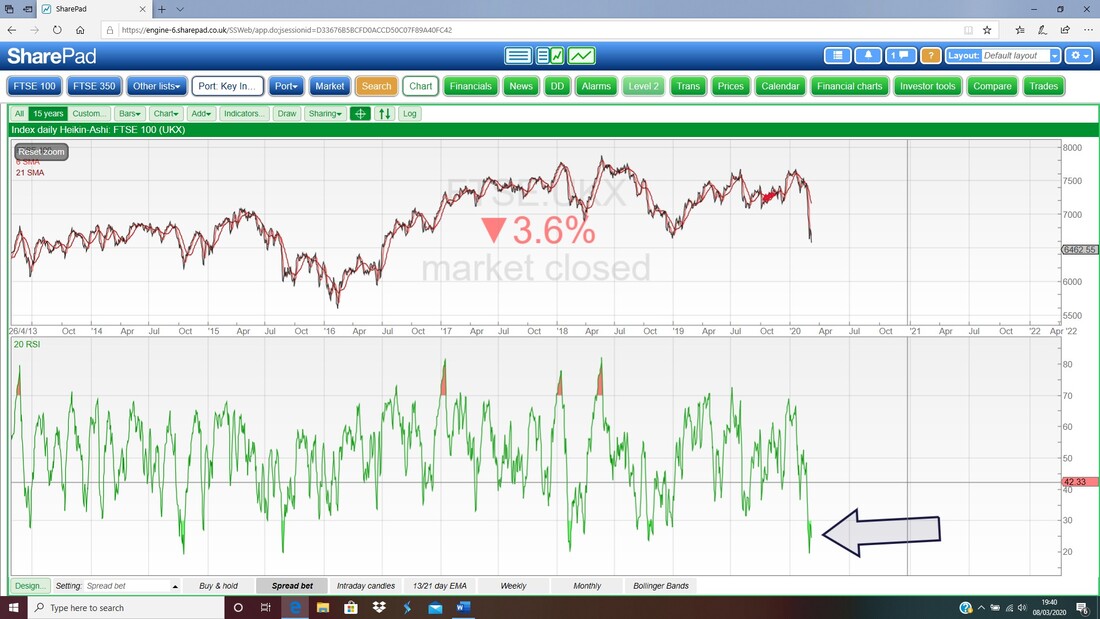
The 13/21 Day EMAs are still in Bear Mode but I won’t show them this week.
Finally we have the Daily Candles with the Pink Zone showing the Bollinger Bands. Yet again it looks like a bit of a Sideways Range and at the Bottom we have my Blue Line (Blue Arrow) at about 6460 and note how the Big Black Down Candle from Friday (pointed at with my Red Arrow) broke below this Blue Support Line during the day on Friday but it managed to Close almost pretty much on the Blue Line. If the FTSE100 pushes below this Blue Line and Closes below it that would be bad and really be a Sell Signal. Up at about 6856 we have my Green Line (marked by the Green Arrow) and this could cap any attempts to rally. If the Price can get over this Green Resistance Line that would be good news. OK, that’s it for this weekend – good luck in the coming week and don’t do anything rash and stupid. Stay calm and think things through properly before rushing to lose your money !! Cheers, WD. 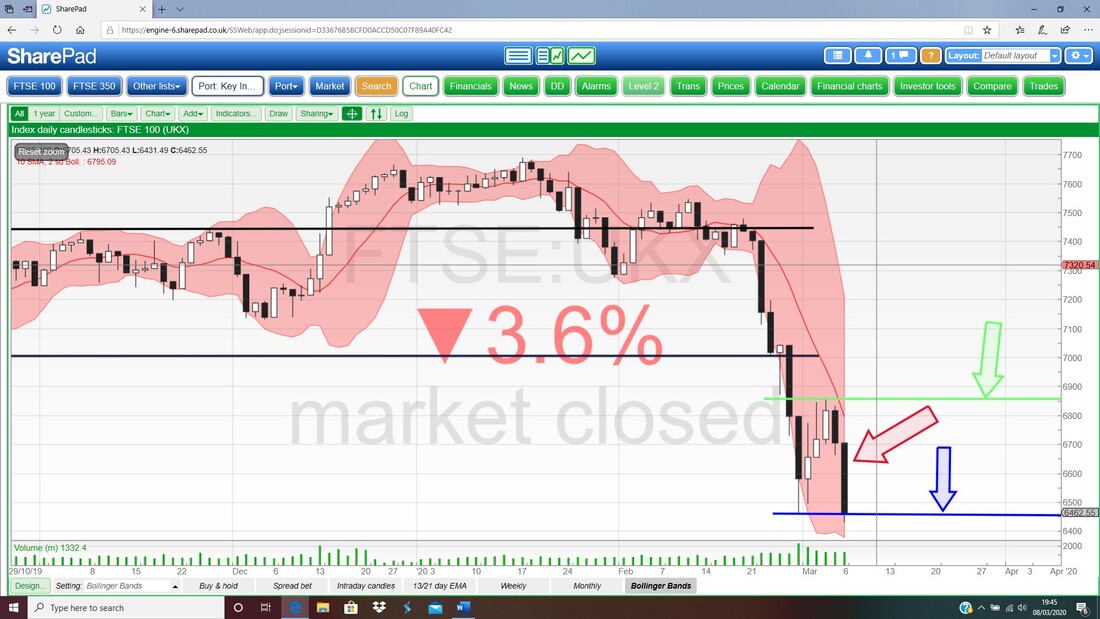
0 Comments
Leave a Reply. |

Stocks & Markets WheelieBlogsThese tend to be more Markets and Stocks related and timely - the Blog Page on the Main WheelieDealer Website has the 'Educational' stuff (well that's the theory anyway !!). Archives
October 2021
Categories
All
|
