

|
stocks & Markets blog |
|
I’ve been reading a lot and hearing a lot about how we could be about to enter into a massive Economic Boom, in the style of the ‘Roaring 20s’ which was the period running up to the Wall Street Crash in 1929 and when everything went a bit crazy after World War 1 and the Spanish Flu etc.
It is quite an attractive story and it would be very nice if it comes true, but as with anything I hear regarding Investment and the Economy, I always ask myself “Is this true? Is this likely to happen?” etc. In essence, when it comes to your money you must believe nothing and question everything.
A big argument behind a possible Boom is that there is a lot of Cash on the sidelines and massive pent-up demand because loads of people have been locked away in their homes and unable to spend money, whilst getting paid on Furlough or ‘working from home’ and just adding to their Bank balances. It is a sad fact of the C19 Crisis that it has been truly horrific for millions of people in so many ways, but for others (myself included) it has actually not been all that bad and we have even come out much wealthier than when the fiasco started.
This is not as clear cut as it seems though and I will outline some factors in the bullet points below that suggest why the ‘Roaring 20s Mark 2’ could be a lot of wishful thinking:
Anyway, plenty there to think about next time you hear of the huge Boom that is coming. As with everything, it might not happen and positioning your Portfolio for an upcoming Boom might be too much of a one-sided stance. I am happy if we get a Boom and it would be great, but equally I am ready to Hedge big time if I sense that this is a mirage, and I can do that extremely quickly. My hunch is that we will get a rebound once C19 is beaten back a lot, but I suspect it won’t last long and the problems of Over-Regulation and Wealth Inequality and insane Political Policies such as globalization will drag on growth and keep Western Economies stagnating. New Podcast TPI 42 On Friday we released the latest ‘Twin Petes Investing Podcast’ number TPI 42 and as per normal, you can find it under the ‘Conkers Corner’ Channel on pretty much all the leading Podcast platforms (just look for number 42). If you have not heard it or if you use SoundCloud, then you can listen via this link. As always we cover loads of Stocks and lots of subjects around Portfolio Management and it is very much unscripted and hopefully quite ‘natural’: https://soundcloud.com/user-479955511/conkers3-wheeliedealer-42-1400-return-pton-bynd-tstl-sdi-ua-rbgp-mano-duke-gaw-heiq Last Week Quite a strange week I found and we have ‘President’s Day‘ in the US on Monday (so US Markets are shut) so this might have distorted things a bit. Ironic really when you think that The Trumpster was on trial and I just heard that he’s got away with it. I can’t complain because my Portfolio gained another 1.5% which was much better than seemed likely as we ground through the week. I have a tiny Short on the FTSE100 but I suspect I will be closing that very soon – I will look at the Charts in due course on this blog and from what I noticed on my ADVFN App on Friday night, it looks like the FTSE100 has broken-out to the upside and I probably don’t need the Hedge at the moment. I am pretty much 100% invested in Stocks but do have a little bit of Cash lying around and I am mulling over which particular Stock to buy more of. I have plenty of choice and may do something in the next few days, depending upon what happens. I also have a fair bit of Cash building up as my Spreadbet Account has been doing very nicely and throwing off Cash – so I am nearly in a position where I feel confident enough to feed a little bit of that Cash into my Income Portfolio and most likely buy into Supermarket REIT SUPR as I discussed on a recent Podcast (the one where I kept calling it PRSR !!). I’m being very cautious though (no change there then !!) as it strikes me there are Bubbles pretty much everywhere and the world has gone quite nuts. Of course Markets can stay illogical for a very long time (and most probably will !!) but I am ready to Hedge heavily if I sense things are going off the rails. There are lots of silly things happening which is never a good sign. Quite simply, it is far too easy for any old fool to make money……….(and there seems to be plenty of young fools lining up to be slaughtered as well !!). Blog Slate Unfortunately, there is not much good news here. I am still having problems with my stomach area and struggling to get much done. As a result, I have done nothing on the ‘Buy Rationale’ Blog I am supposed to be writing and all I managed apart from recording the new Podcast was to update the ‘Little Black Book’ page on WD2 which has lots of Stock Ideas that you can take away and look into. I had some blood tests a few days ago and I am due to see my General Practitioner on Monday, so hopefully I can get some progress happening on whatever is ailing me. It is getting pretty tedious now. From the Days of Greek Myths Down in the catacombs there are loads of old Blogs I have written over the last 6 or 7 years and they are festering away with a pretty unpleasant smell (it’s not me, it is the blogs, honest !!). You can find the full list of Blogs I have created on the ‘Blog Index List’ page on WD2 and all the Educational ones have Links to them so the blogs are easily tracked down (the smell gives them away as well !!). From that list I bring you this old piece of mythology. I know I have included this one a lot recently but I think a focus on Valuation is more important than ever as we are buried deep into a crazily over-valued and bubbly Market – I myself am sticking firmly to Valuation principles and I suspect buying overvalued stuff now could be extremely expensive shortly. This is a link to the last part but there are links to the earlier bits at the bottom: https://wheeliedealer.weebly.com/educational-blogs/valuation-valuation-valuation-bursting-for-a-pe-part-4-of-4 I am also including this one – I am sure many of you have read it but I regularly get asked about Spreadbetting and this is my ‘essential’ guide !! There are links to the earlier parts at the bottom of this final part: https://wheeliedealer.weebly.com/educational-blogs/how-to-use-leverage-safely-and-successfully-spreadbetting-and-cfds-part-7-of-7 OK, Charts up next then…… FTSE100 Normal stuff where the Charts I show are taken from SharePad and if you click on them they should get a bit bigger on your screen. If you fancy using SharePad or ShareScope then there are ‘Adverts’ around my Website which you can click on and if you sign up you can get 1 month’s Data for free. I also get a drink out of it so “Thank you” very muchly. I’m kicking off with the FTSE100 because I have that tiny Short running on this and I suspect I need to close it ASAP, and I just want to check the Charts and confirm my contention. The Chart below has the Weekly Candles and my Blue Arrow is pointing to a small White Up Candle and the key thing here is that it built on the ‘Bullish Harami’ pattern which was formed from the Candles of the 2 weeks before (I mentioned this in last week’s blog I think). If it can keep rising then the key Resistance here is where my Green Arrow is pointing at 6903 (in other words 6900 !!) and if it can push higher above this, then the Resistance which comes from my Black Rectangle in the Top Left-Hand Corner will come into play. This runs up to about 7725 from 7000. Down below we have Support at 6315 and 6263 and then from my Black Ellipse on the Chart. 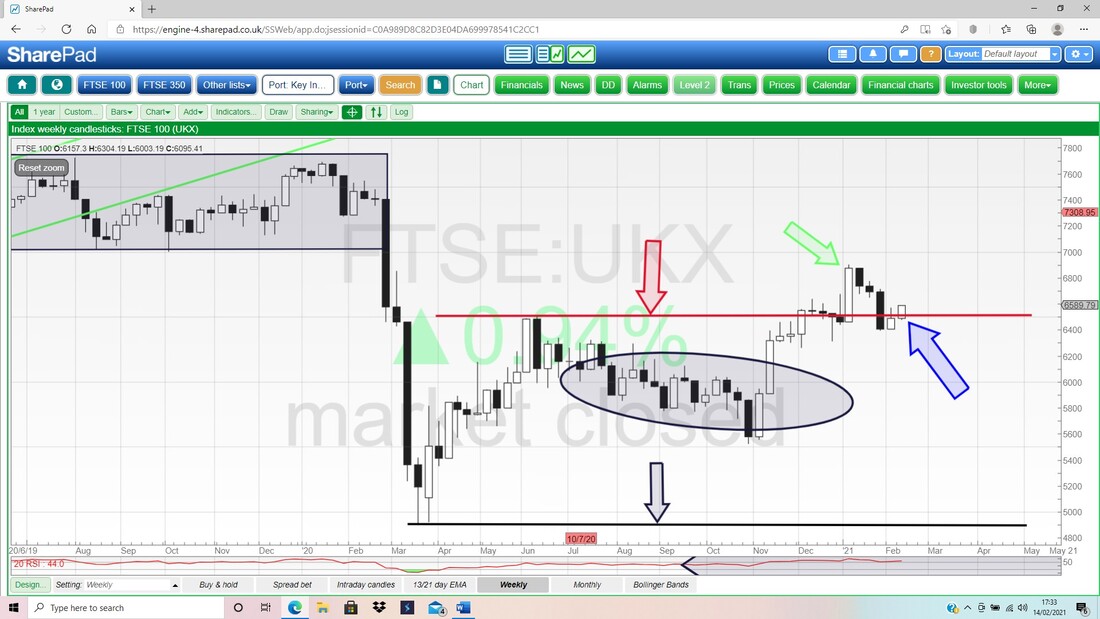
On my next Chart I am mostly concerned with the Black Wavy 13 Day EMA Line (Exponential Moving Average) and the Red Wavy 21 Day EMA Line. My Red Arrow is pointing to where we had a ‘Bear Cross’ with the 13 Day ducking under the 21 and it now looks like we might get a ‘Bull Cross’ which is of course the opposite. It is best to wait for the Cross to happen but it looks set quite well for the Bull Cross to occur soon.
The Candles shown here are Daily ones, and look how the decent White Up Candle from Friday pushed up to my Black Downtrend Resistance Line – if it can clearly move through this Line then that would be a good sign. 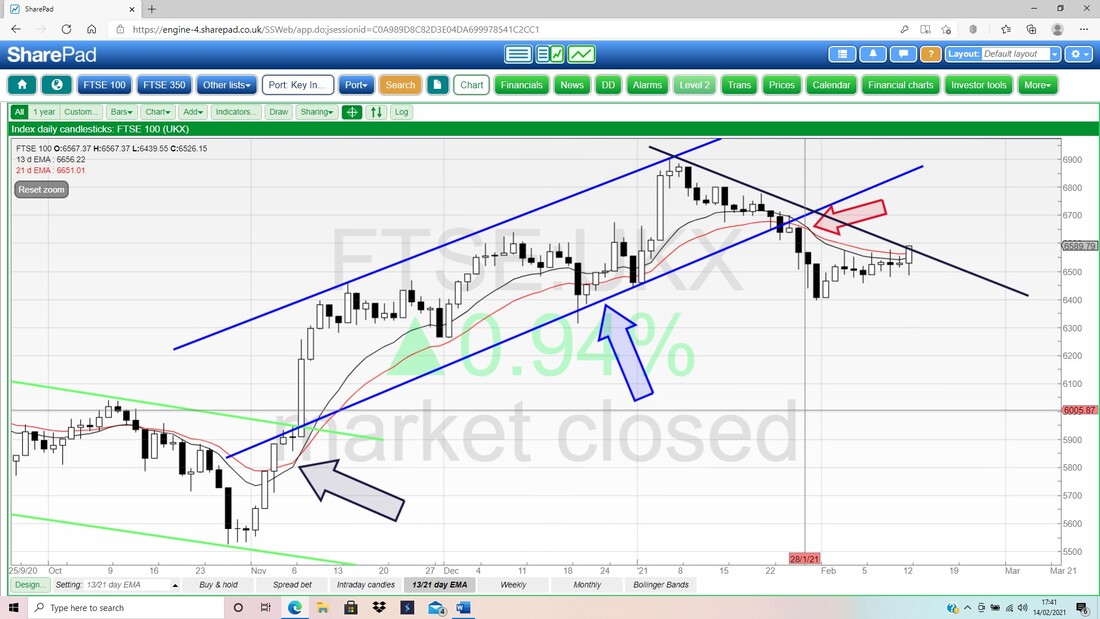
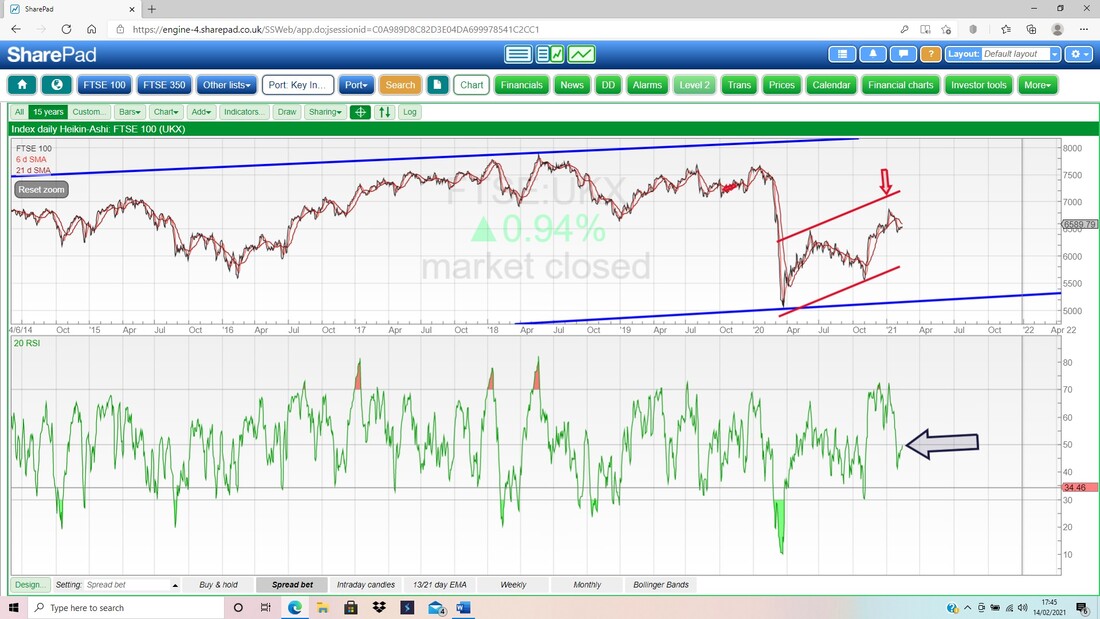
In the bottom window on the Screen below we have the RSI for the Daily FTSE100 (Relative Strength Index). Where my Black Arrow is pointing we are on a Reading of RSI 50 and this is bang-on Neutral. In other words, it is not Oversold or Overbought. The RSI is moving up and that is arguably good for Bulls but I don’t find the direction always particularly predictive; if anything such a move is best viewed as supporting or conflicting evidence when weighing up other Technical Signals.
Finally for the FTSE100 we have the Daily Candlesticks (Candles and Candlesticks are the same thing – it is just shorter for me to type Candles….) and the Pink Zone marks the Upper and Lower Bollinger Bands. My Black Arrow is pointing to the Up Candle from Friday and this Closed at 6590 pretty much, and clearly the next important step is to get over the 6600 round number.
The Close on Friday was up at the Top Bollinger Band though and it is possible that the FTSE100 drops back from this, although it can ‘hug’ the Band and go higher – which I think is very possible (if you look back near that Red Arrow, then you can see where there was a push up and the FTSE100 ‘hugged’ the Top Band). The Bands have narrowed and often that means a fairly quick move could be coming (but it could be up or down !!). An important achievement by Bulls on Friday was to get the FTSE100 up above the High from 3rd February at 6573 where my Blue Arrow is pointing – that in itself is a Bullish development because it broke through that Resistance. I won’t rush to act, but on the evidence I have seen in these Charts I think it would be best to close my Short soon. 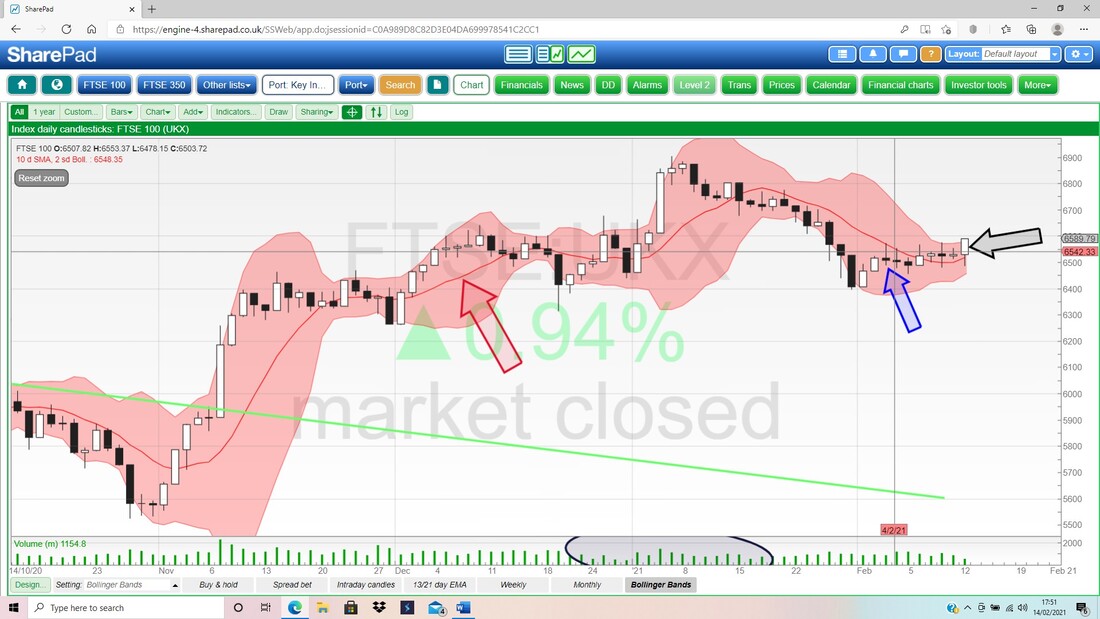
Gold Composite
I’m fascinated by Gold because everyone is going crazy buying it and Gold Mining Stocks, but I look at the Chart and it really isn’t very promising. The Chart below has the Daily Candles and my Black Line is marking the Top Resistance Line of a Downtrend Channel with my Blue Line as the bottom Support Line. Apart from what looks like an Overshoot where my Green Ellipse is, this Downtrend Channel has contained the Gold Comp Price and it has been very much in decline after peaking with much excitement at $2074. My Red Arrow is pointing to a ‘Bear Cross’ between the Black Wavy 13 Day EMA Line and the Red Wavy 21 Day EMA Line – and that is still very much in force with the Bears in control. If Bulls are going to get a grip, then we need to see a Close above $1877 firstly and to get above that Overshoot would be very promising. Support at $1788 is very important. 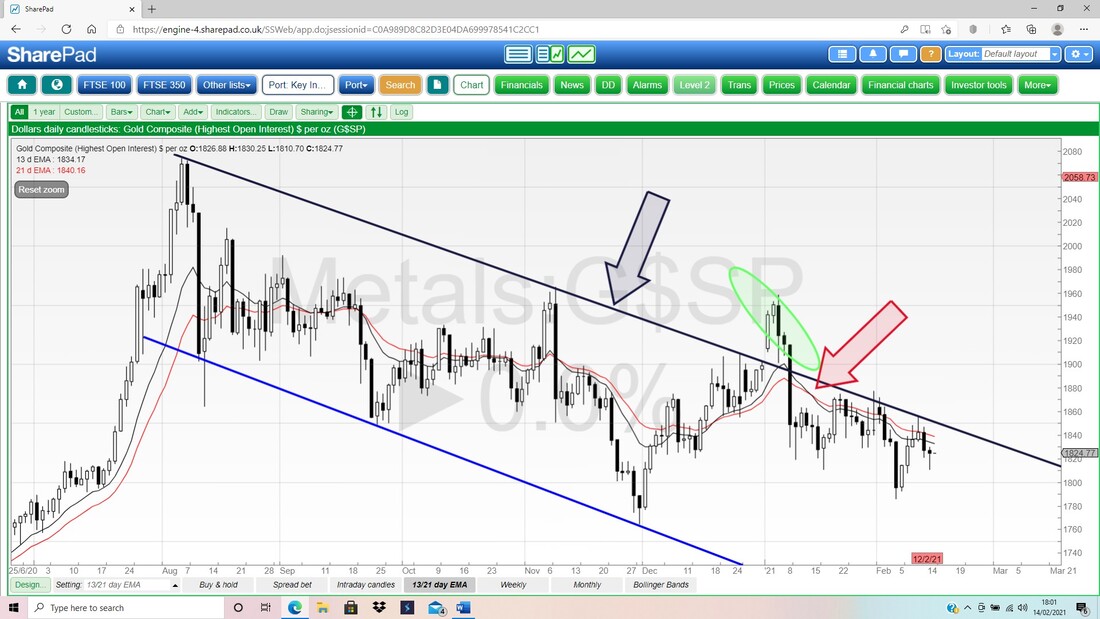
Brent Oil Composite
I won’t spend much time on this but in the bottom window on the Screen below we have the RSI for the Brent Oil Comp Daily. On a Reading of RSI 83 where my Black Arrow is, this is as high as it has been over the last 11 years and is clearly extremely Overbought. This doesn’t mean that Brent Oil Comp can’t go higher – but what is does shout is that some sort of Pullback or Sideways Consolidation is needed to calm everyone down a bit. 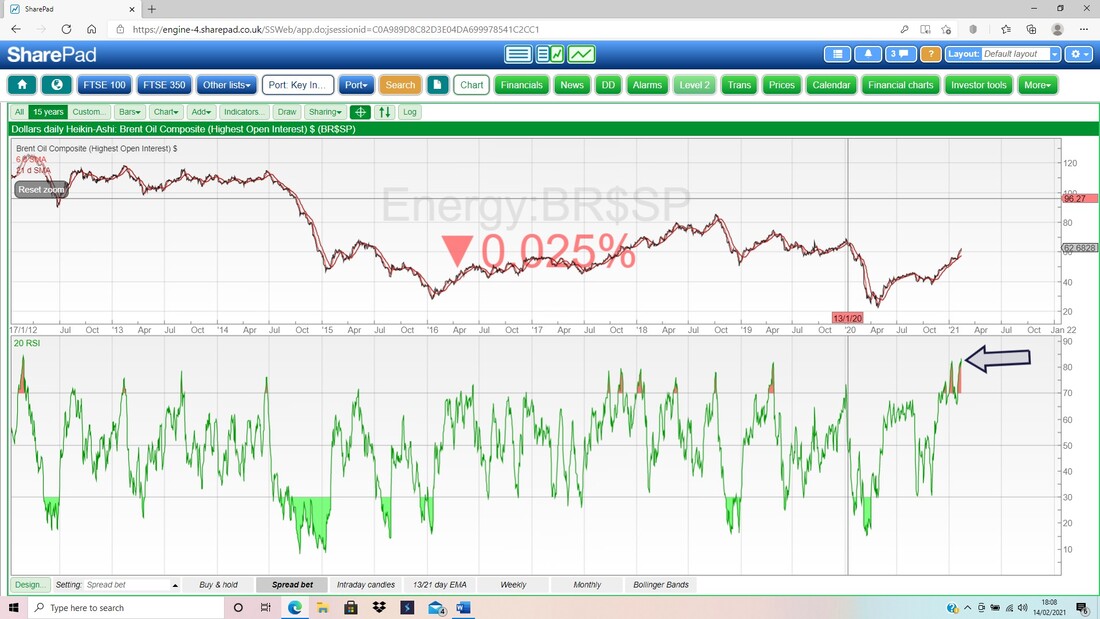
S&P500
First up the Weekly Candles. My Blue Arrow is pointing to a Small White Up Candle for last week and this is mildly promising and certainly does not suggest a Reversal. Note how the Candles are all nicely within the Uptrend Channel marked by my Black Lines (Black Arrows). This is useful because when it falls out of this Channel, that will be a good sign that some trouble is on the way. The S&P500 hit another Fresh New All Time High (ATH) on Friday up at 3937, which in itself is Bullish behaviour. US Markets are closed on Monday of course so that may mean a ‘funny’ week but I see no signs of anything dramatic in these Charts. 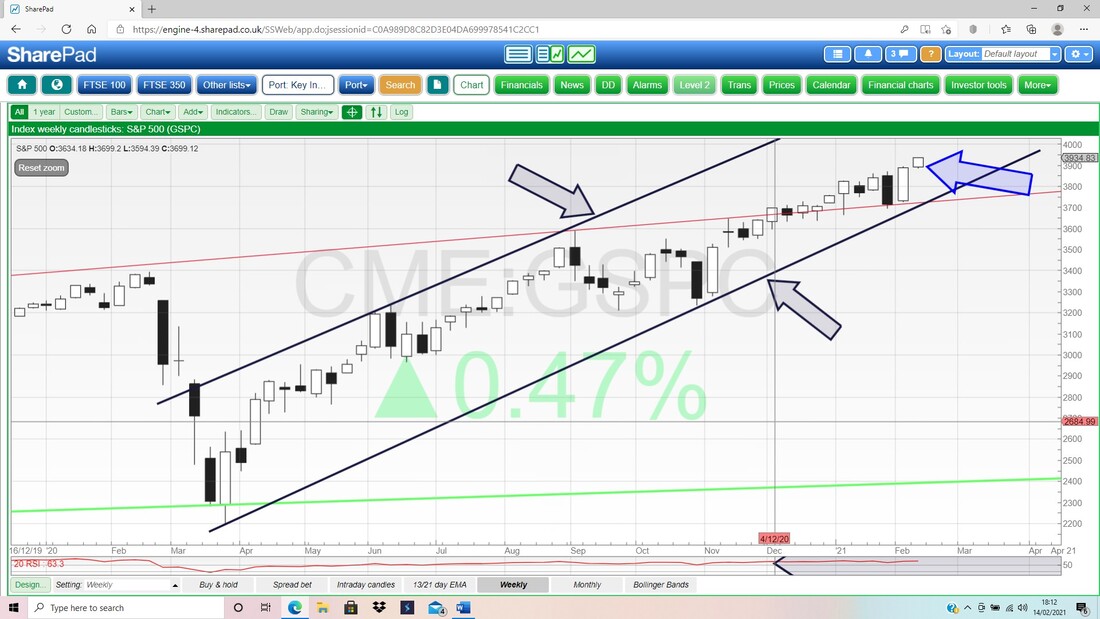
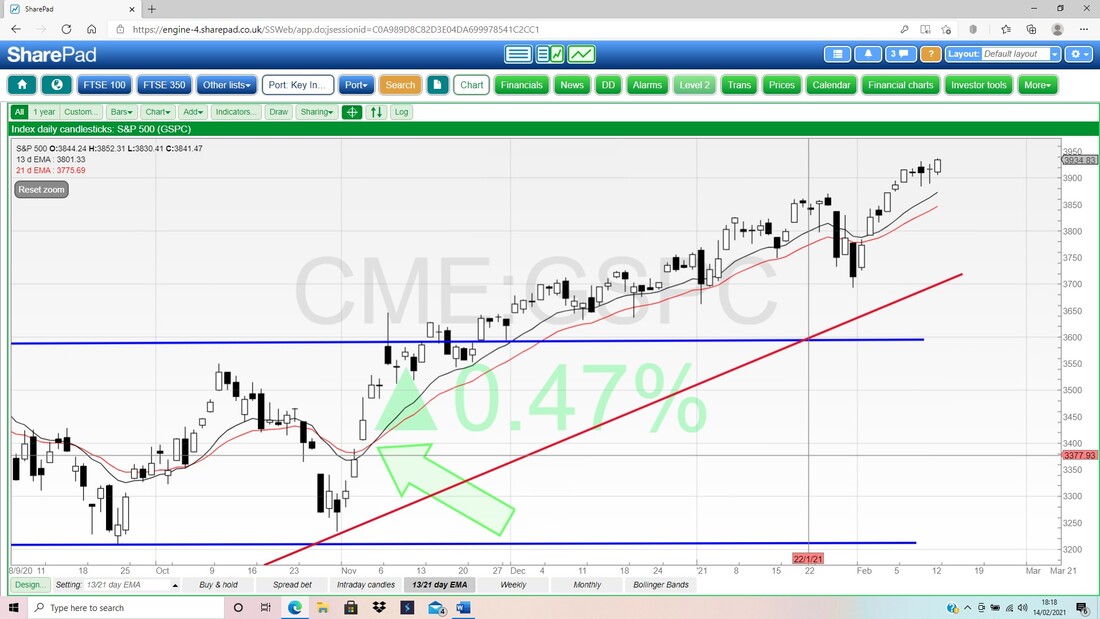
Next the Daily Candles for the S&P500 with my Green Arrow marking a ‘Bull Cross’ between the Black 13 Day EMA Line and the Red 21 Day EMA Line. This is still in force and very much Bullish.
In the bottom window on my next Screen we have the RSI for the S&P500 Daily and on a Reading of RSI 68 where my Black Arrow is this is near Overbought; but if you look to the left, you should be able to see that the RSI has often been above this in recent times. However, we need to be careful because some of the Readings like RSI 83 and RSI 89 which we have seen lately are extremely high and unusual. My hunch is that the S&P500 can go up a little more in the short term but not much.
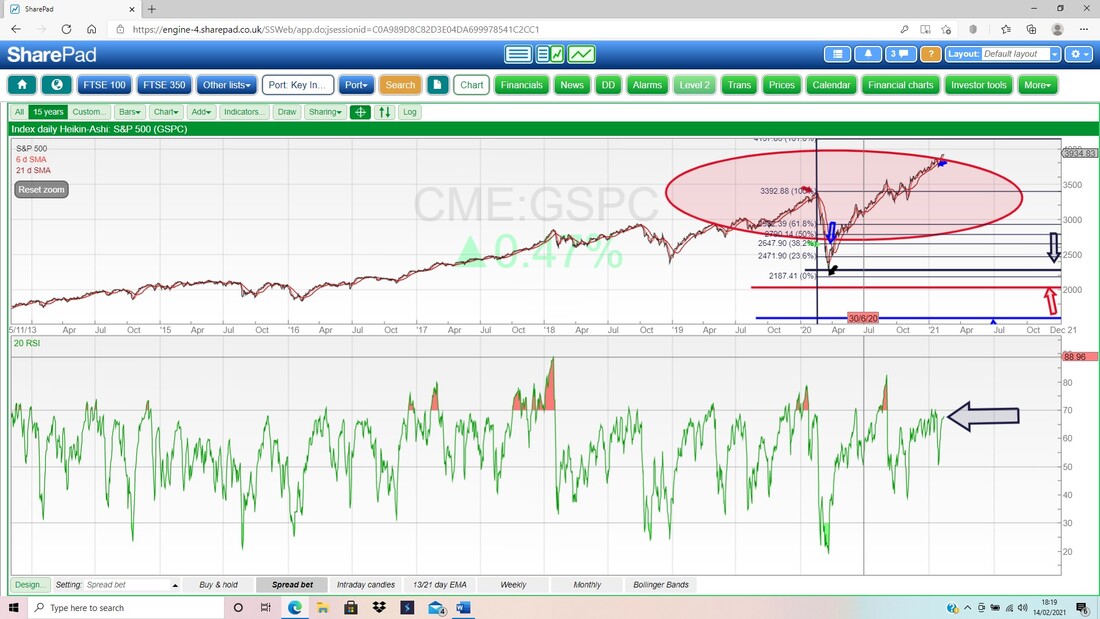
Last up for tonight, here are the Daily Candles for the S&P500 with the Pink Zone showing the Bollingers. I have shown a long time period simply because I wanted to get the Top Bollinger Band into my image and if I cut it too much then it falls off the top of the screen !!
Anyway, my Blue Arrow is pointing to that Top Band and it is at about 3975 and we might see the S&P500 go up to this before having to ease back a bit or go sideways. OK, that’s it for this Blog. Have a great week and try to stay safe and sane and all that. Oh, don’t forget to listen to the Podcast. Cheers, WD. 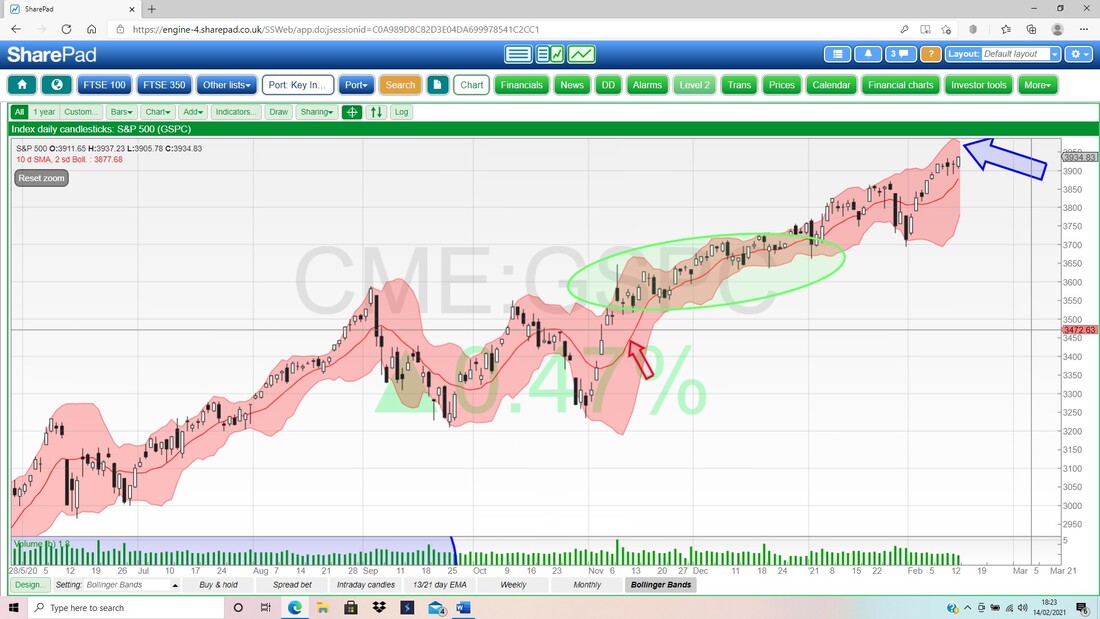
0 Comments
Leave a Reply. |

Stocks & Markets WheelieBlogsThese tend to be more Markets and Stocks related and timely - the Blog Page on the Main WheelieDealer Website has the 'Educational' stuff (well that's the theory anyway !!). Archives
October 2021
Categories
All
|
