

|
stocks & Markets blog |
|
I am sure many of us are bewildered at how we can have reached December 2019 (and worst still, we are now in the ‘Meteorological Winter’ apparently) and the final weeks of the year. Historically, December is the strongest month and assuming that we don’t get a crazy Marxist in Number 10 on the 13th December, then chances are we can keep the strength going in the Markets; but I suspect we face some sort of Reckoning soon – maybe early January will inject a dose of reality.
We might also get a ‘Santa Rally’ which tends to be quite late – I think it is something like the 17th December up to the first few days of January and if the situation looks right, then I might be tempted to place a Small Long Spreadbet on some sort of Index to try and get a bit of gain out of this historically very reliable occurrence. The S&P500 might be a good one because it is so strong anyway but I will see how things look at the time.
Last week was a bit messed up by Thanksgiving which must have skewed things with low volumes and suchlike, but at a high level the US Markets are still looking very strong and the FTSE100 is stuck in that Sideways Range and no doubt I will look at that in the Charts bit later in this blog. I have not seen it officially in writing but it tends to be the case that we get the US Non-Farm Payroll Numbers (blimey, this seems to come around so fast) on the Friday at the end of the first week of a new month and therefore it might happen this Friday afternoon. Usually it is about 1.30pm UK time and can cause some big moves in the Markets (quite welcome because Friday’s often need a bit of spice to stir the Markets up a bit).
Last Week Things have really turned my way more in recent weeks and thankfully (there I am giving Thanks just after Thanksgiving then) my Portfolio added 2% for the week which is a really strong result. No doubt Closing the Short I had on the S&P500 helped a little but a combination of some strength in the FTSE250 (my Portfolio is probably more aligned to the FTSE250 and smaller stuff than to the FTSE100) and a bit of weakness on the FTSE100 where I still have a Short, conspired to eke out a decent return. From memory I don’t think I did much in terms of Trades last week although I have taken up the ‘1 for 7’ Rights Issue Shares for Accsys Technologies AXS, which amounts to a tiny Cash sum because my Position is quite small anyway, but I am happy to put a little more in here. AXS had Results and the Placing is to finance more expansion of Wood Treatment capacity but although the progress here is steady and clearly in the right direction. It strikes me that we are many years away from AXS being properly profitable and cash generating and therefore I see no rush to put more money in – although I do think it will get there in the end. It could also be a Takeover Target because it is working with many big Chemical and Petroleum Companies and it would be a tiny bolt-on for one of those to snap up AXS. With profits some way off, I suspect we might see some opportunities to buy more AXS at a much lower price as the Markets do their usual tidal moves in and out, and I might be more tempted to add to my Position if there is a significant drop in the price (but without there being any serious problems obviously). I am still watching the movements on Gateley GTLY and I am keen to buy some. I don’t think it really suits the size parameters of my Income Portfolio although it does strike me as a pretty reliable and defensive Dividend generator – maybe I am being foolish but there are plenty of other Income Stocks I can buy instead. I will buy GTLY in my ‘Normal Trading ISA’ once the time looks right to me. I issued the second part of the Blogs on the Video Gaming sector a few days ago and I have pretty much decided which Stock I like the most. To be honest it is a very close thing between SUMO, CDM, KWS, TM17, FDEV and I probably could choose any of them and do ok. CDM was a real possibility but it ruled itself out this week by doing a pretty chunky acquisition and this will add Debt ultimately (they have been quite shrewd on the split between Cash upfront and the Deferred Consideration) and it makes CDM a lot more risky I think. It will probably turn out fine but it means that another Stock probably has the edge for me personally. So I will most likely be buying that Stock in coming weeks. I still like the look of Live Company Group LVCG but it is due to put out an Update in January so I will wait until then and see how the Numbers are looking. They are clearly exceeding expectations on the amount of Shows/Events but I want to see what that actually means in terms of the Financial Numbers. The simple reality is that a Company can appear to have all sorts of good things going for it, but if that does not filter through to the Numbers in the Accounts quite soon then it is meaningless. I am in no rush but at some point I will start looking at my Income Portfolio and might buy more of something I already hold or I might bring in a new Stock. I want to ultimately get up to 15 Stocks (I hold 12 at the moment) but I am not in a hurry and that can probably be a task for January onwards. My FTSE100 Short Hedge is relatively small now compared to my Long Portfolio of Stocks and with the General Election under 2 weeks away, it might come in handy. Ultimately, I would like to get this Short closed in the next few weeks or early in January if we get a pullback but I am happy to let it run for a while. The difference with the S&P500 Short I had was that the S&P500 Index had broken-out to a fresh New All Time High and that is a very dangerous situation to Short as the Market can rise very fast. With the FTSE100 we are still in that wide Range and nowhere near the Bullish Breakout situation that the S&P500 has. In fact, if the General Election goes to the Tories and we “Get Brexit done” then I expect a Rally in the pound and this could drag on the FTSE100 a bit. Master Investor Show Islington This is taking place on Saturday 28th March 2020 and is held at the Business Design Centre (BDC) in Islington which is in that London. I have probably been to this for most years over the last couple of decades and it can be worthwhile both for the Speakers and the chance to meet up with other Investors, although the Companies tend to be dominated by Oil & Gas and Resources AIM stuff which is certainly not by Cup of Darjeeling. Having said that, there are usually a handful of proper Companies and at least the limited choice makes it easy deciding which Stands to visit !! The Admission Fees are pretty cheap but if you use Discount Code BFMI you can probably get a FREE ticket: https://investoraccess.masterinvestor.co.uk/events/master-investor-show-2020/ I haven’t totally decided if I am going yet but I probably will and no doubt I will be mostly hanging around the Canteen area on the top floor. There is a Restaurant of some sort next door and usually we pop in there. It used to be pizzas but I think it was some sort of burger joint last year. Cenkos / Shares Magazine Growth & Innovation Show I mentioned this last week but I figured many Readers might have missed or forgotten about it so I am chucking it in again. For several years now I have been attending a very good little Conference thing that Shares Magazine and Cenkos organise in Islington at the Business Design Centre (same place as the Master Investor Show), and I have signed up to show my face there again in 2020. It is on Tuesday 11th February and is FREE to attend which of course is always welcome, and there are usually quite a few Companies attending and you get presentations by them and they usually have a Stand outside as well. It is in a side room at the BDC but is still quite large and it’s a very pleasant event I find. From the list of Companies on the website I particularly would like to talk with DUKE to really figure out what they do and I note that IXI are there and also VEL who have had a torrid time as a listed business but might have potential hidden away underneath. I have just spotted that MANO will be there as well which might be interesting. Here is a Link to book your ticket and I found that when I clicked one of the bits to order my ticket it didn’t work but there is a bit in the text that says ‘click here’ and that worked fine. See you there !! https://www.sharesmagazine.co.uk/events/event/growth-innovation-forum-2020-1 Blog Slate As I mentioned above, I issued the Second Part of those blogs on the Video Gaming Sector on Thursday night and last night (Saturday) I made a start on the ‘Buy Rationale’ blog for ‘The Chosen One’ and I expect that will take a couple of weeks to complete. I have a blog lined up for the end of the coming week which is a bit of a mix of some short ideas where there are just a few paragraphs on each subject but I am sure Readers will find it helpful. So chances are that for the following week I will issue Part 1 of ‘The Chosen One’ blogs (usually these are 2-parters). I might buy the Stock as a Starter Position before issuing both blogs though – watch this space as I will update Twitter and the ‘Trades’ page as and when and if I do buy it. With November out of the way I have no excuses for not updating the ‘Weekly Performance’ page so I will try to do this in the next few evenings – it should be more pleasant than they have been recently because my Portfolio has really perked up nicely !! I also put a Non-Fiction Book into the Bookshop called ‘Shadow of the Hangman’ and this is a good old historical yarn and is very readable and as ‘cheap as chips’ from Amazon. Perhaps an ideal Christmas Present then !! We also need to do a new TPI Podcast so I will see if Mr C is around to get something down on vinyl. From Winter’s past……. I’ve picked out this Template one because with December now upon us and the New Year really not far away, it is a good time for us to be doing some Strategic Planning for our Portfolios for the coming 2020. This blog contains lots of ideas regarding such planning: https://wheeliedealer.weebly.com/educational-blogs/yearly-trading-rules-parameters-template Right, enough already, let’s look at some pretty pictures. S&P500 As is always the case, the pictures I show are taken from the Award-Winning SharePad software I subscribe to and if you click on the images then they should get bigger so you can see more details. First up we have the Monthly Candlesticks and with November now complete we have a ‘full’ Candle and my Blue Arrow is pointing to a nice Big White Up Candle and this is bullish. 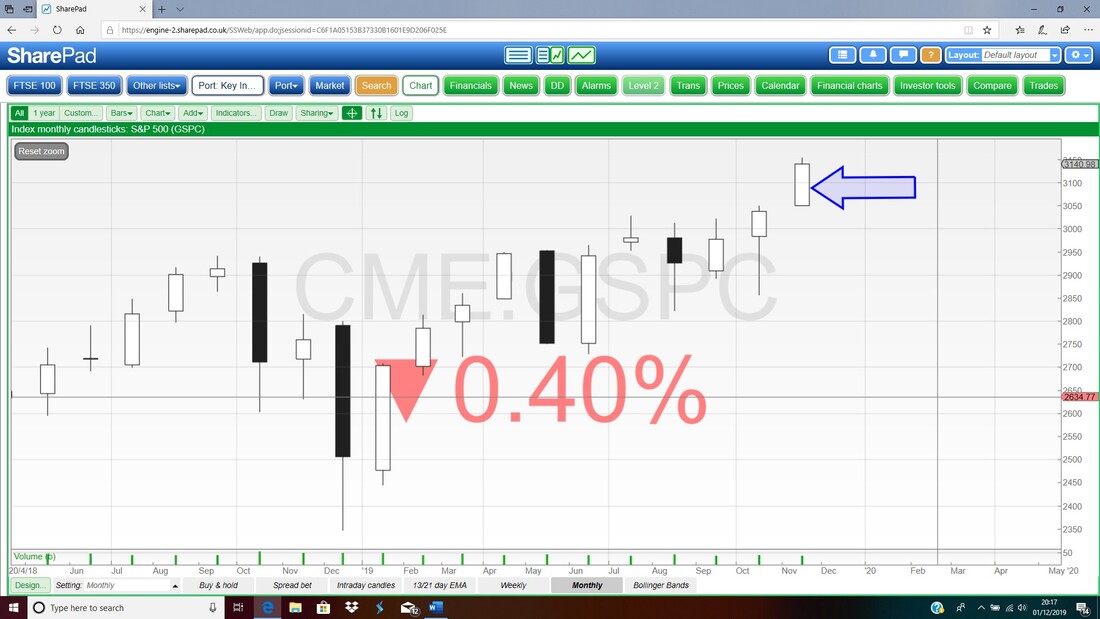
Now the Weekly for the S&P500 and pretty much the same sort of picture. Where my Blue Arrow is we have a big White Up Candle and this is bullish. OK, there is a small ‘Wick’ up above and we might get more clarity on this as we look at the Daily Candles.
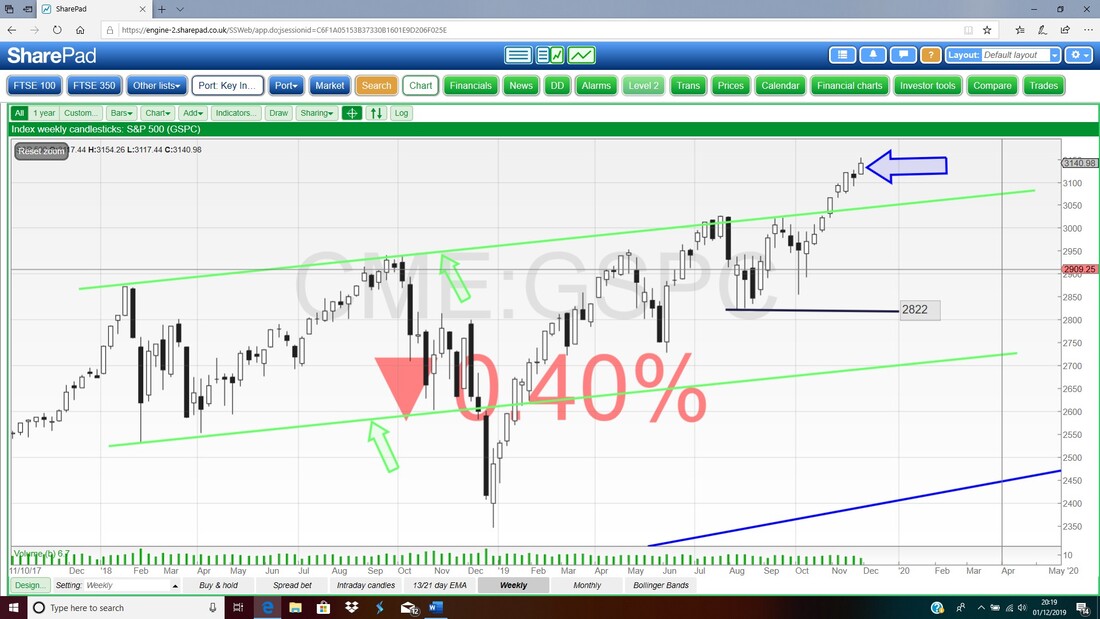
Now on the Daily Candles we have the Pink Zone below marking the Upper and Lower Bollinger Bands and my Black Arrow is pointing to where the Candle from Friday is slightly off the Upper Band and perhaps it might ease back a bit. But of course we had Thanksgiving last Thursday so this likely skews things a tad. Further down we have my Blue Line at around 3025 and if we do get some weakness then this should be decent Support.
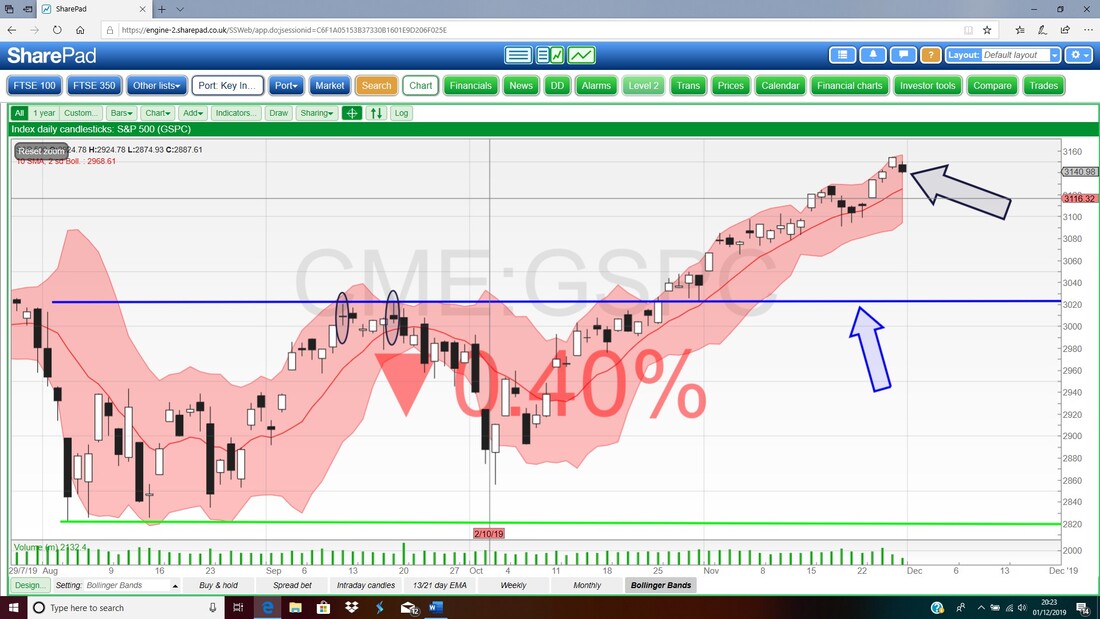
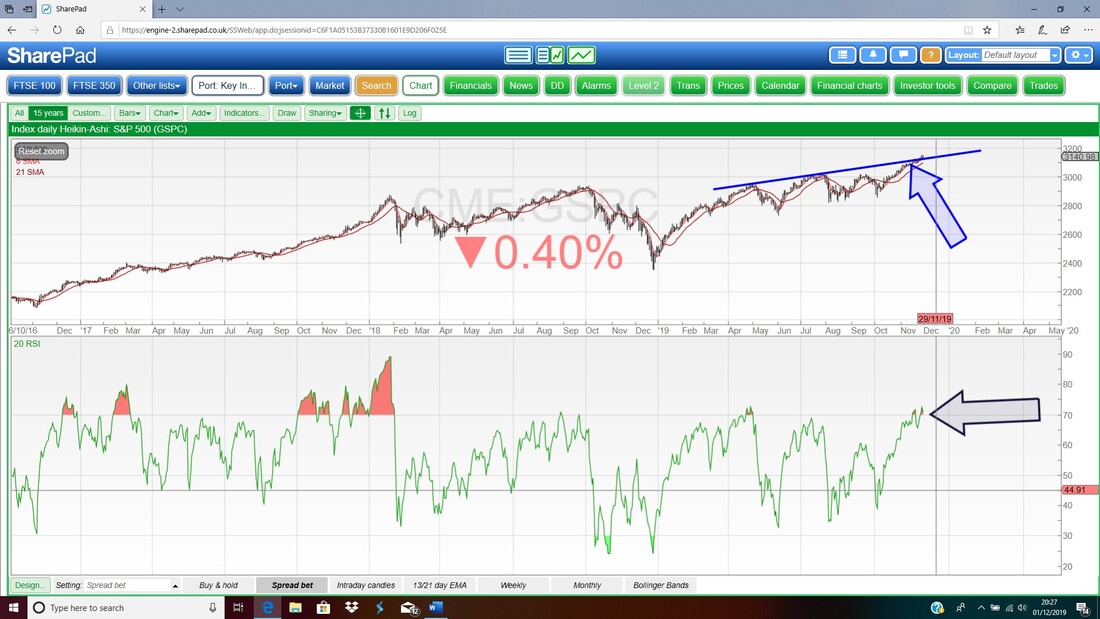
In the bottom window on the Screen below we have the Relative Strength Index (RSI) for the S&P500 Daily (my ‘T’ on the keyboard is playing up and I keep yping away with ‘T’s missing – very irritating !!) and where my Black Arrow is we have an RSI Reading of 71 which is a very high level and this is consistent with a bit of an ease back next week but I suspect it won’t come to much before Bulls charge in again.
Dow Jones Industrials Index (DOW)
Largely the DOW is like the S&P500 but I will just point out an interesting Candle on the Daily which is fingered by my big Blue Arrow below and occurred on Wednesday. It has a bit of a ‘Hanging Man’ ‘T’ shape (lucky I pressed the ‘T’ key hard !!) and this could be a short-term Turning Point and on Friday it did drop from this which is a bit of ‘Confirmation’. By the way, if you are to Trade off such signals, then you must not go Short just on seeing the Hanging Man – you need to wait for the next Day (or whatever the time period is) and you want an ‘Open’ that confirms the signal and then you can Trade in the direction the signal suggests. 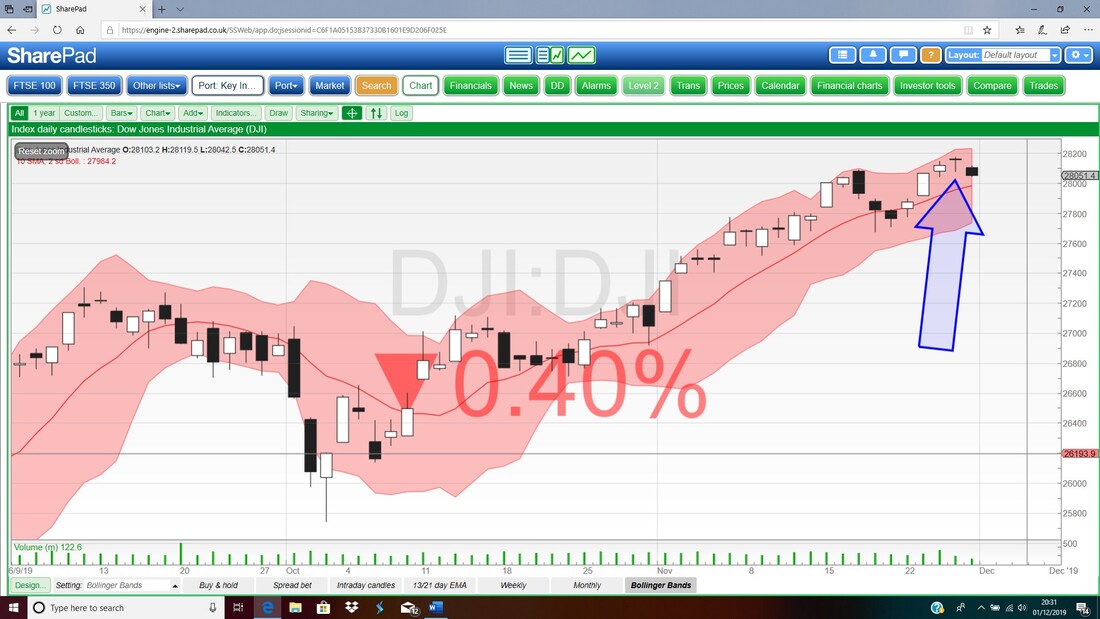
Again the Nasdaq Comp is largely the same as the S&P500 so I won’t include it this week. If you follow me on Twitter you might have noticed that most nights from Monday to Thursday around 10.15pm I issue a string of Tweets that comment on what I am seeing on the Index Charts – and I cover quite a few when I do this.
FTSE100 As always we must start with the longer term stuff and so here are the Monthly Candles now that November is complete. My Ellipse is capturing a Small White Up Candle for that month which has a bit of a Wick which is again marking the Range that we have been in between about 7450 ish and 7000. I don’t think this Candle tells us much and all we can say really is that the Range is dominating. Note that the Candle from July where my Blue Arrow is acted as a Turning Point down and if we do get a proper Rally and escape that Range, then this level up around 7750 will be difficult Resistance. 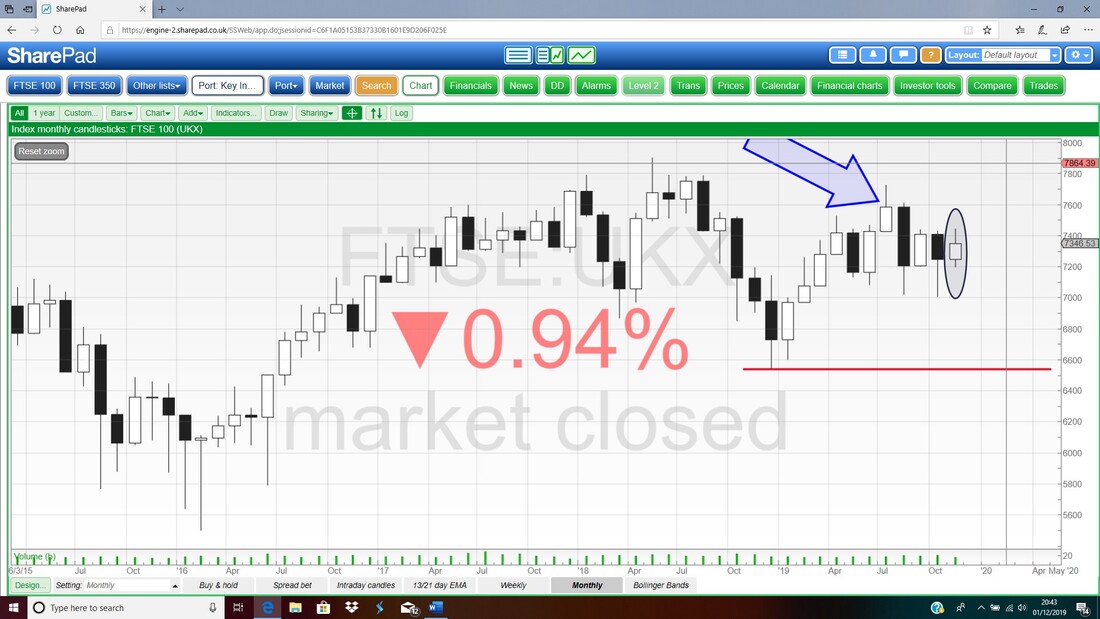
Next up the Weekly for the FTSE100 and my Blue Arrow is marking a ‘Shooting Star’ sort of shape although the ‘context’ is weak because for this to have proper Bearish power, you would need a good run up prior to it appearing. Really this Candle just builds on the Week before in terms of choppiness and there are some pretty big swings. The High from last week was 7446 and the Low from the week before was 7200 and that is quite a range really.
My Red Curve (marked by my Red Arrow) is an attempt to point out that we might have a Bearish Rolling Top – if the Support at 7000 fails then perhaps this Rolling Top is playing out. A move up above 7700/7800 would negate the Rolling Top. 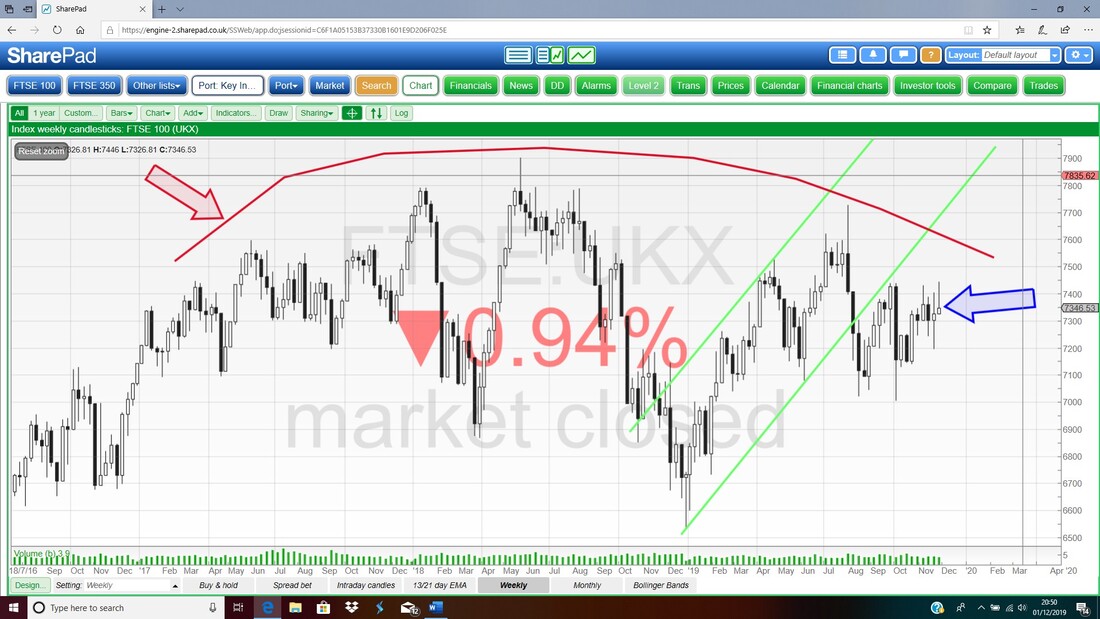
My Chart below is focused on the Black Wavy 13 Day Exponential Moving Average (EMA) Line and the Red 21 Day EMA Line. Where my Black Arrow is we narrowly avoided a ‘Bear Cross’ but note how we might be starting to line one up again. However, these kinds of Cross Signals are not as effective and useful on a Market that is choppy and going sideways like the FTSE100 is at the moment.
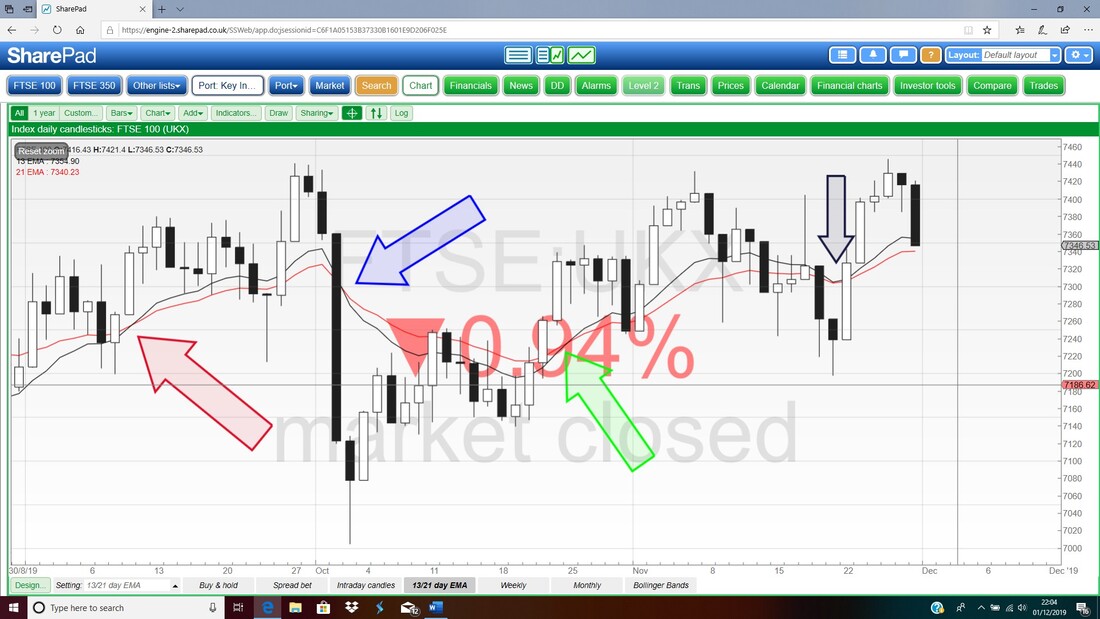
Finally for the FTSE100 we have the Daily Candles with the Pink Zone marking the Upper and Lower Bollinger Bands. My Blue Arrow is pointing to a Big Down Candle from Friday and note how this Closed at the Mid-Point Line between the Bands. This is often support but if it fails, then we could test the bottom end of the Bands at about 7220.
My Green Horizontal Line (Green Arrow) shows the top of the Sideways Range and my Black Horizontal Line (Black Arrow) shows the bottom of that Range. My Black Ellipse in the top left-hand corner marks a Zone of Resistance that comes in to play if the FTSE100 can escape the Range. 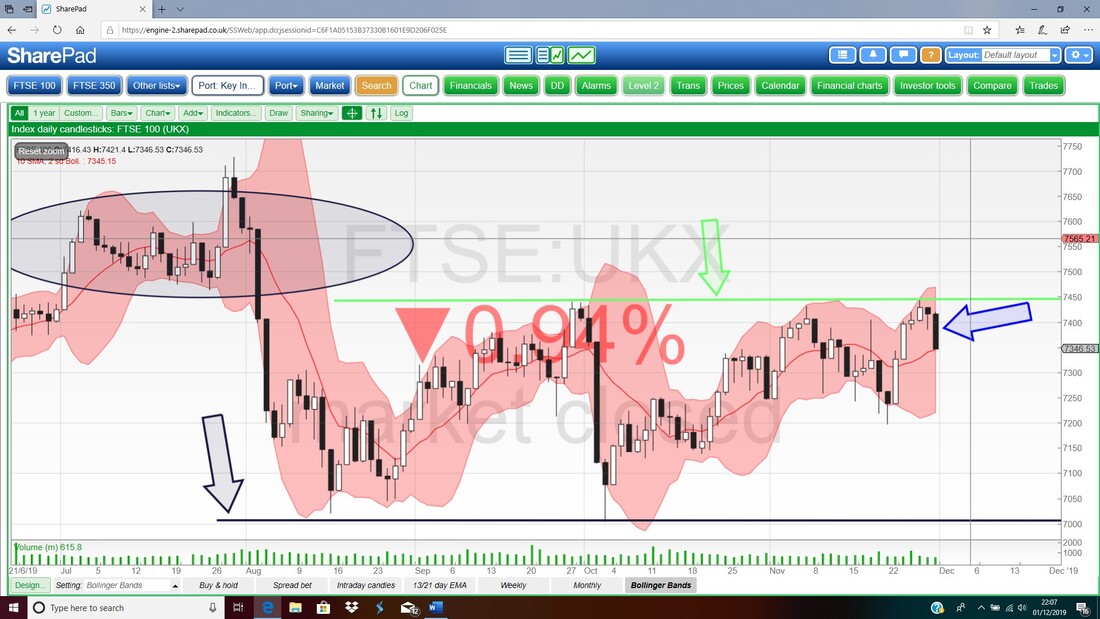
DAX (Germany)
I am just showing this because of a very clear Bearish ‘Shooting Star’ Candle on the Daily and it seems to be turning down off of this. The DAX only has 30 Megacap Stocks though and can be quite choppy. Overall all the Major Global Indexes do largely tend to move in sync. My Blue Arrow is pointing at that Shooting Star and the High is 13374 on that day. 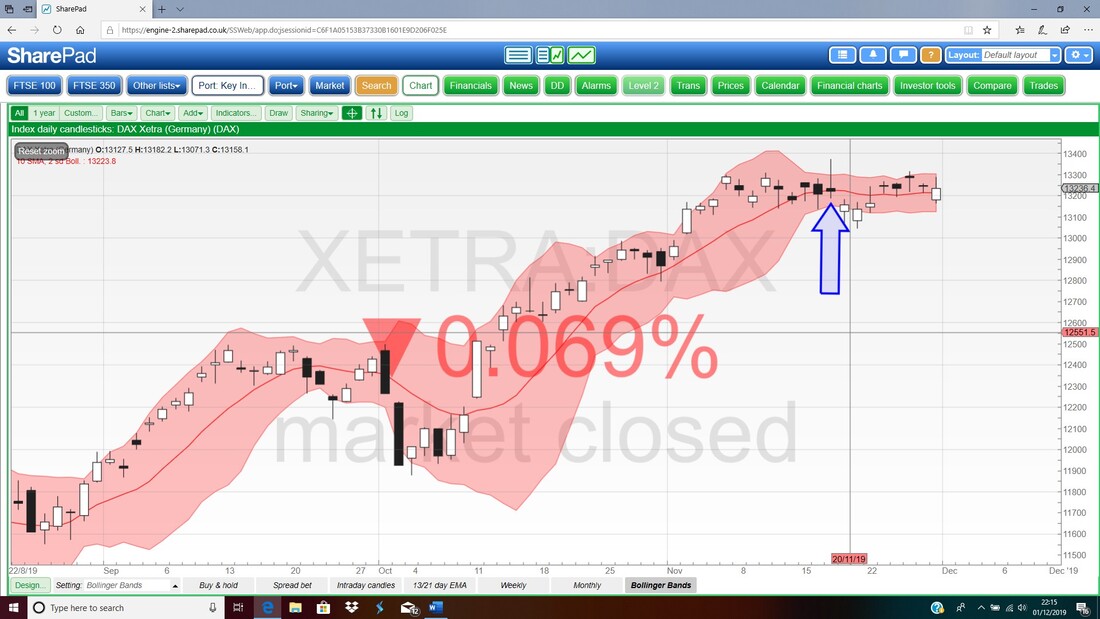
In the bottom window below we have the RSI for the DAX Daily. Where my Black Arrow is we have a Reading of RSI 63 which is still quite high and falling. Most crucially (and usefully !!), note how the Extreme High on the RSI where the Red Zone was up at about RSI 76 did predict the weakness of following days.
In general I don’t find the RSI all that useful most of the time, but when you get the Extremes – either Overbought above 70 or Oversold below 30, then it can be very helpful. Note on some Charts for small stocks and commodities and stuff, you can get some crazy extreme readings. 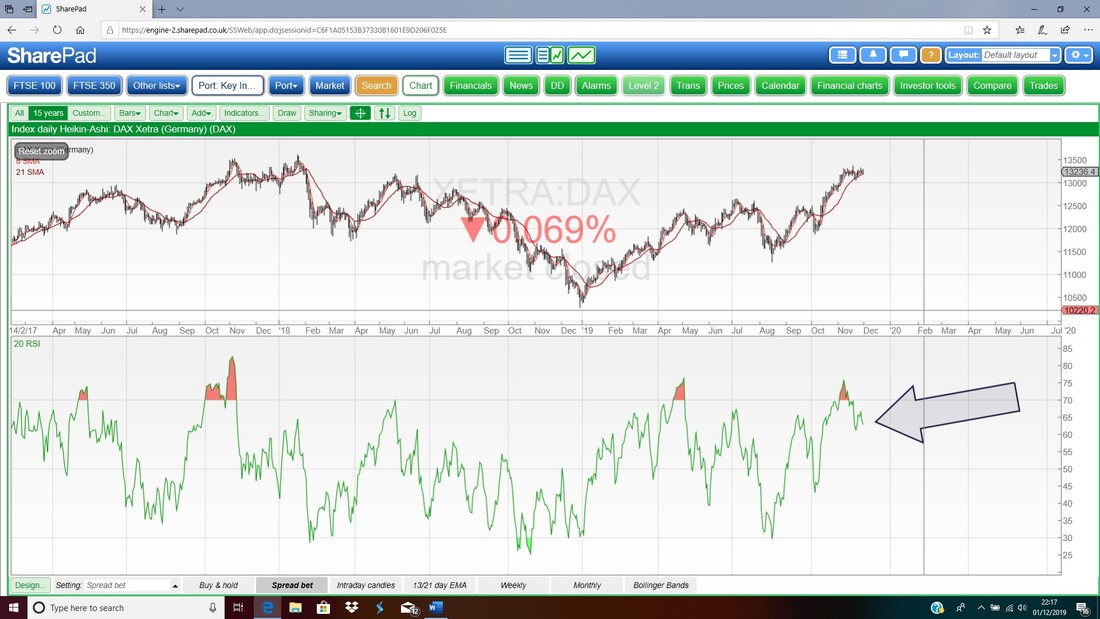
FTSE250
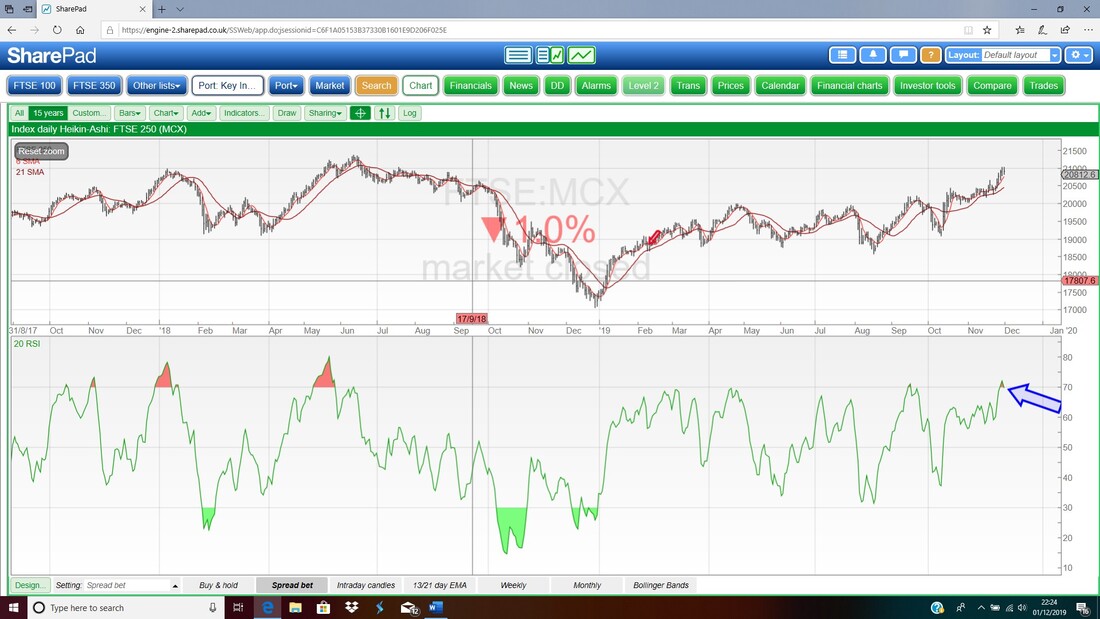
Along with the weakness in the FTSE100 on Friday, we got a Big Black Down Candle on the FTSE250 Daily where my Blue Arrow is below. It does look like a Pullback is in order but I doubt it will be anything too dramatic. The General Election is probably impacting a bit as the Polls ebb and flow. 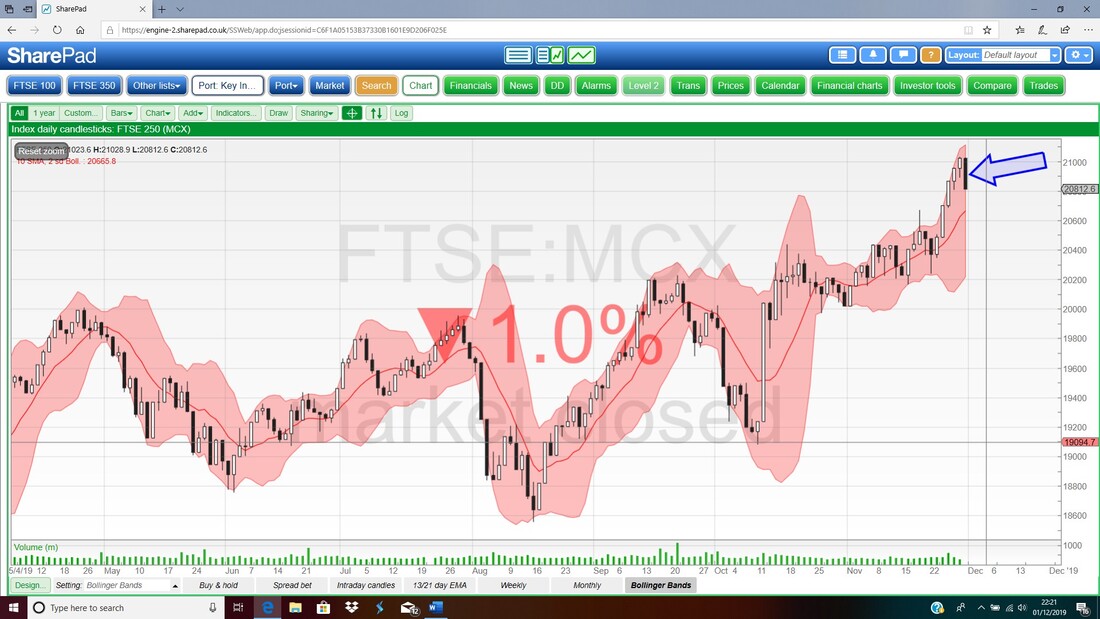
As with the DAX, note how the RSI for the FTSE250 Daily was getting very high up at about RSI 72 and now it is lower at RSI 70 and could be dropping back. Note, you can unwind a high RSI Reading with a Market that just goes sideways for a while – so it doesn’t necessarily mean we will get a drop of much size.
Gateley GTLY
As I am looking to buy some GTLY it makes sense to check out the Chart tonight. First up this is a long-term Chart I showed in the recent ‘Stock Idea’ Blog I wrote (you should be able to find it below this one on the ‘Stocks & Markets Blog’ page) and where my Blue Ellipse is, note it has broken to the upside out of the Triangle which has the Red Resistance Line at the top. This is a positive sign for Bulls. 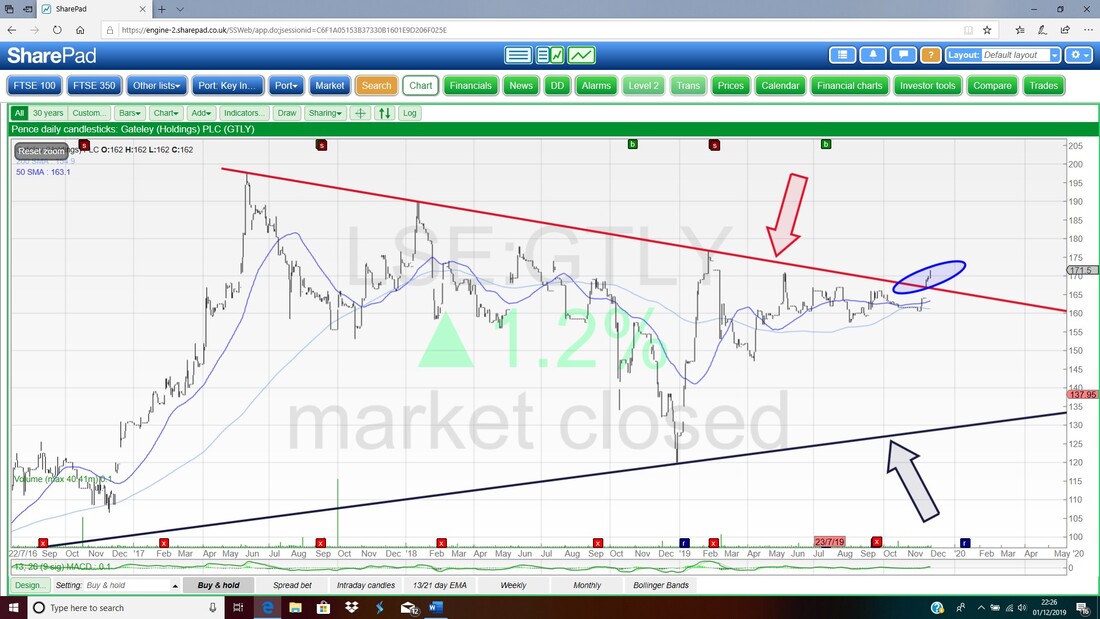
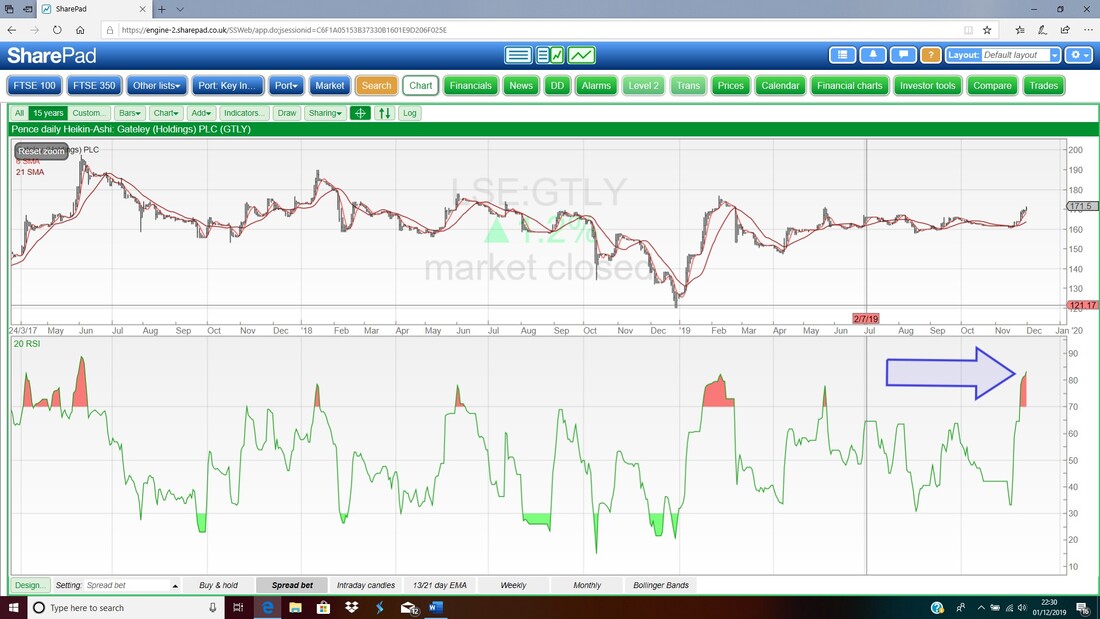
In the bottom window below we have the RSI for the GTLY Daily Chart and where my Blue Arrow is we are on a Reading of about RSI 82 and in recent history if you look to the left, you should see this is pretty much as high as it tends to get – suggesting weakness ahead after this initial jump up on the Results.
This next Chart doesn’t make my ‘job’ (if you can call it that !!) easy. Here we have the Daily Candles for GTLY and my Black Arrow is pointing to a Big White Up Candle from Friday. This suggests Bulls are still keen on GTLY so a pullback might not be as imminent as I would like. I will see how it plays out in coming days and might just buy even after the jump up – I am looking for a Starter Position and I will be adding more over time if the opportunity presents – so any drop and that would be a chance to top up. It is up near the top Bollinger Band and this along with the RSI which we just looked at suggest that a period of calmness is due soon.
OK, that’s enough for tonight, Good Luck everyone and keep your wits about you in them sneaky Markets, Cheers, WD. 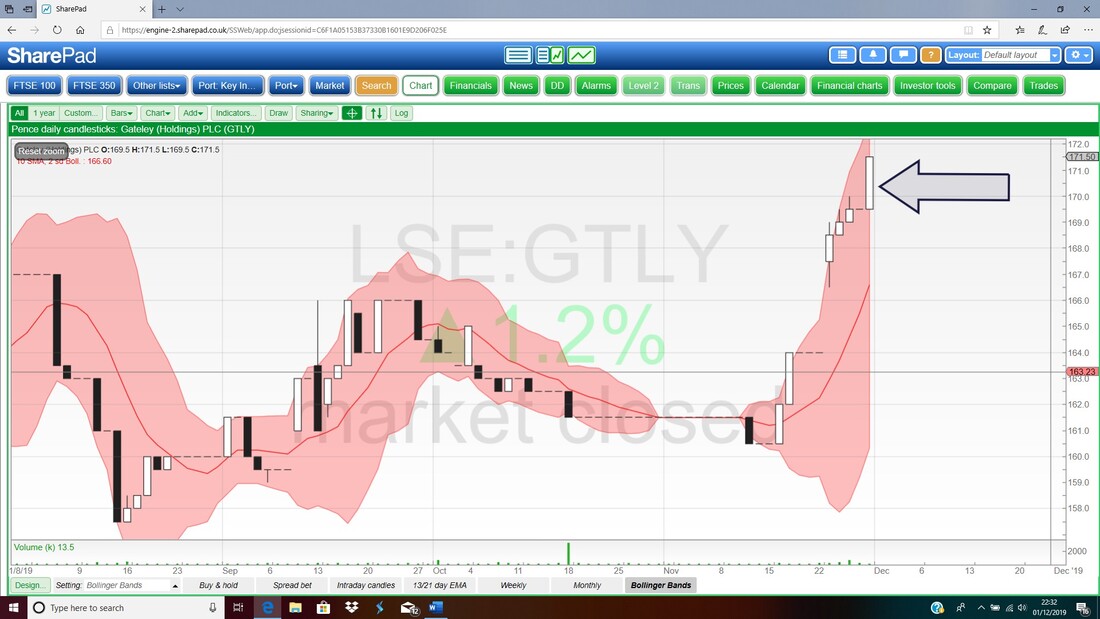
0 Comments
Leave a Reply. |

Stocks & Markets WheelieBlogsThese tend to be more Markets and Stocks related and timely - the Blog Page on the Main WheelieDealer Website has the 'Educational' stuff (well that's the theory anyway !!). Archives
October 2021
Categories
All
|
