

|
stocks & Markets blog |
|
I am extremely pleased to be able to report that last night (I started typing this on Saturday night) I went round the corner to spend the evening with some old friends and I ate a yummy pork burger, a pork banger and a chicken wanger. That is the first meat that has passed my lips for about 2 months and my goodness it was lush. I also knocked back at least 3 pints of booze and didn’t roll home (I was rather wobbly !!) until after 2am.
Even more sweetly, I actually feel fine today and the pain from my stomach is at a very low level and almost entirely gone. It is so nice to be able to say that my health is getting better without a doubt and I am hoping that the new box of lansoprazole tablets, that I should receive in the next few days, is the last lot I need to take. I know several people who take these pills as a daily thing but I am eager to get off them because despite not noticing any side effects, I generally have an aversion to shoving chemicals into me unless I have no other choice. Beer is a different matter obviously because that is a plant-based health product.
Latest TPI Podcast
On Friday we released TPI 53 and we cover loads of stuff and stocks in it as usual. You can hear it via SoundCloud and YouTube at the links below and if you go to the ‘Conkers Corner’ Channel on all the major Platforms, then you should find the full archive of ‘Twin Petes Investing’ Podcasts there: Soundcloud here: https://soundcloud.com/user-479955511 And you can hear it on YouTube here: https://www.youtube.com/watch?v=gtQoNVymqLk WheelieBash 2021 We have determined that The WheelieBash this year will take place on Saturday 4th September 2021 at The White Hart in Winkfield near Windsor as usual. I am allowed 60 peeps and so far over 50 Slots have gone. It is Free to attend and if you want to come then email me or DM me on Twitter or whatever. If you go to the relevant page on my Website (I think it is on WD2) then you can see all about WheelieBashes from previous years. It kicks off at 12.00 Noon and if you want food you need to order by 2pm. They do more food in the evening, so don’t worry, you are unlikely to die of starvation. You might get an aching face from smiling, especially after the grim time we have had in recent months, and your hand might ache from taking notes of all the great ideas you hear about. It is totally informal and everybody is welcome, come and go as suits you. All ages and experiences are always represented and it is an unmissable opportunity to meet other like-minded Investors and Traders. Last Week I found it quite a tedious week on my Portfolio with lots of choppiness and generally a downwards tinge. Anyway, I took a hit of 1.5% which isn’t my idea of fun, but after the strong run up we have had, it is no surprise that we get some drops along the way. Looking at the big picture, I am still having a pretty decent year so far and I really can’t moan at all (if you look at the ‘Monthly Performance’ page on WD1 it will give you a good picture of how my year is panning out so far). Hopefully I can ride out any turbulence in the coming weeks and I will be ready for Autumn if my fears of a proper Correction do happen. But we mustn’t get despondent; my expectation is that even with a drop in the Autumn, we will get a strong Winter (as we nearly always do) and, fingers crossed, my Portfolio (and yours !!) will close out the year with nice gains. In line with my comments so far and in the Podcast, I am really not doing much and, if anything, I am looking closely at my Long Spreadbet Exposure and I am trimming a few things where I think I am a bit heavy. Last Week I shifted a bit of my PayPal PYPL Long Spreadbet and I lowered the leveraged risk I was exposed to on that to a degree (if you look at my ‘Trades’ page on WD1 you can see more details). Obviously, I am alert to any signs of a need to Hedge my Portfolio with an Index Short. Blog Slate With my health seemingly on the way to being ‘fixed’, I am hoping I can start writing ‘Educational’ Blogs again and I have loads I want to create. However, this is unlikely to happen for a few weeks at the earliest, but at least I am committed to making sure Weekend Blogs (like what you are reading now) do become their usual regular thing. However, I am also trying to get out and about and to meet up with loads of mates and suchlike now that I am feeling more up to it – so that will no doubt munch up a lot of my time. Another chewer of my time is all the jobs I have been putting off because I have been unable to get out and sort them. One I must crack on with is getting a new Wheelchair – but that always takes a huge amount of time and getting my Voucher out of the Healthcare Services is never a quick process. From previous Meat-eating times (keep it clean !!) If you look at the ‘Blog Index List’ on WD2, then you should find the full list of all the Blogs I have ever written and there are Links to all the educational ones and, on the more recent ones, there are Links to all of them. From that list I bring you this one which you might find a useful refresher (or perhaps you are coming to it for the first time – I hope you like it): https://wheeliedealer.weebly.com/educational-blogs/hedging-and-cash-for-bargains That is actually the first blog I ever wrote – it is certainly not a classic, but I guess I had to start somewhere !!! S&P500 All the Charts I show are taken from the excellent SharePad software I use and if you click on the images then they should get a bit bigger on your screen (I recommend you read these Blogs on a big screen rather than just a Fone – there is a lot of detail to be seen). I know some Readers actually look at their Charts on SharePad or whatever method they use as they read through my blogs. If you fancy using SharePad or ShareScope yourself, then you can get 1 month’s Free Data if you go to the ‘Subscribe’ page on their website and then select the Product you want, and then you should see a ‘Promo Code’ box and if you type ‘twinpetes’ into that box, then the discount will apply. You can also get this by clicking on the Adverts that are all over my websites. I get a small payment for introducing you, so thank you very much !! (it’s just a shame I can’t spend it on beer much at the moment…..) https://www.sharescope.co.uk/ I noticed also that SharePad/ShareScope have updated the landing page on their website and there is much better detail regarding the capabilities and features of their software now. In fact, Podcast TPI 50 contains a discussion with the Founder of SharePad/ShareScope, Martin Stamp. Highly recommended and of course you can find that one on the ‘Twin Petes Investing Podcast’ page on WD2. Last week the Markets were a bit soggy and grumpy so I am eager to look at these Charts and see what kind of things we need to watch out for. I will start with the S&P500 because it has largely moved up with the incredible rise in the Nasdaq Tech indexes and the latter looks very over-stretched in the short term, although I am not expecting a huge crash or anything. My first Chart is an attempt to show something I talked about on Twitter with regards to the Nasdaq, although I did not include a Chart with my Tweet. The Chart below is for the S&P500 Daily and the main thing to note first is the Blue Line (Blue Arrow) which is the 50 Day Moving Average Line. The important thing to realise is that this Line has been excellent Support for utterly ages – and there is no obvious reason by anyway weakness in the near term means that the trend is changing. My Black Ellipses are an attempt to highlight where the S&P500 got extended away from the 50 Day MA Line and note how this can only persist for a period of time before ‘Mean Reversion’ pulls the Price back down to the 50 Day MA Line. My Red Arrow is pointing to where we are now, and my hunch is that a similar move to the 50 Day MA Line is the most likely scenario. The Blue 50 Day MA Line is at about 4245 and it might overshoot and drop down to 4200 before finding Support. If you look at the Nasdaq 100 or the Nasdaq Composite, then you should see a similar phenomenon (that word always makes me think of the Muppets – and I don’t mean the UK Government). 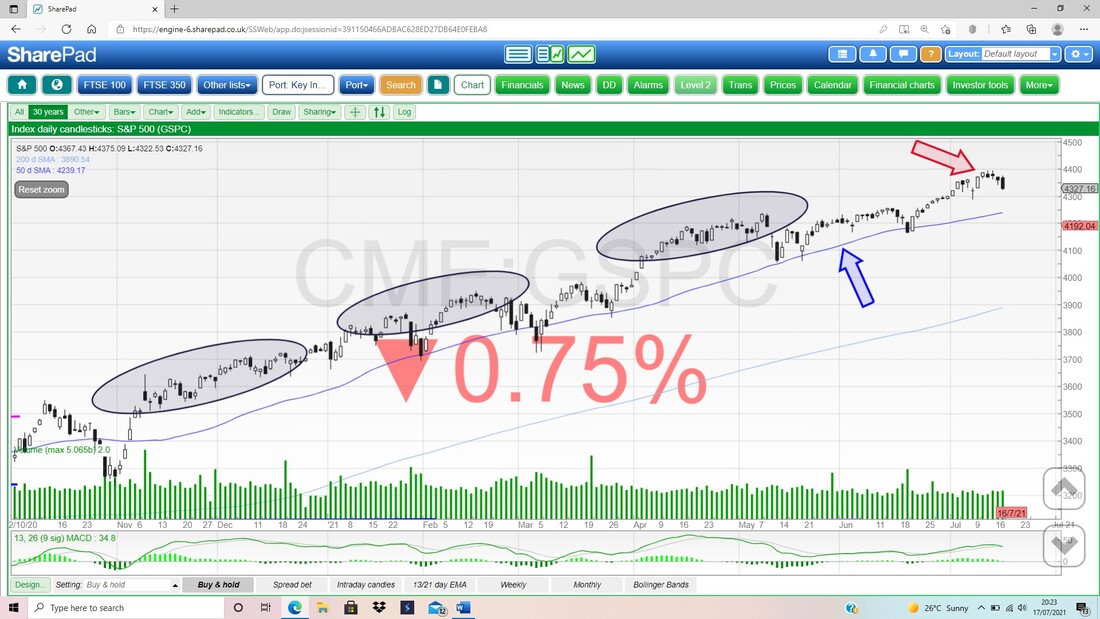
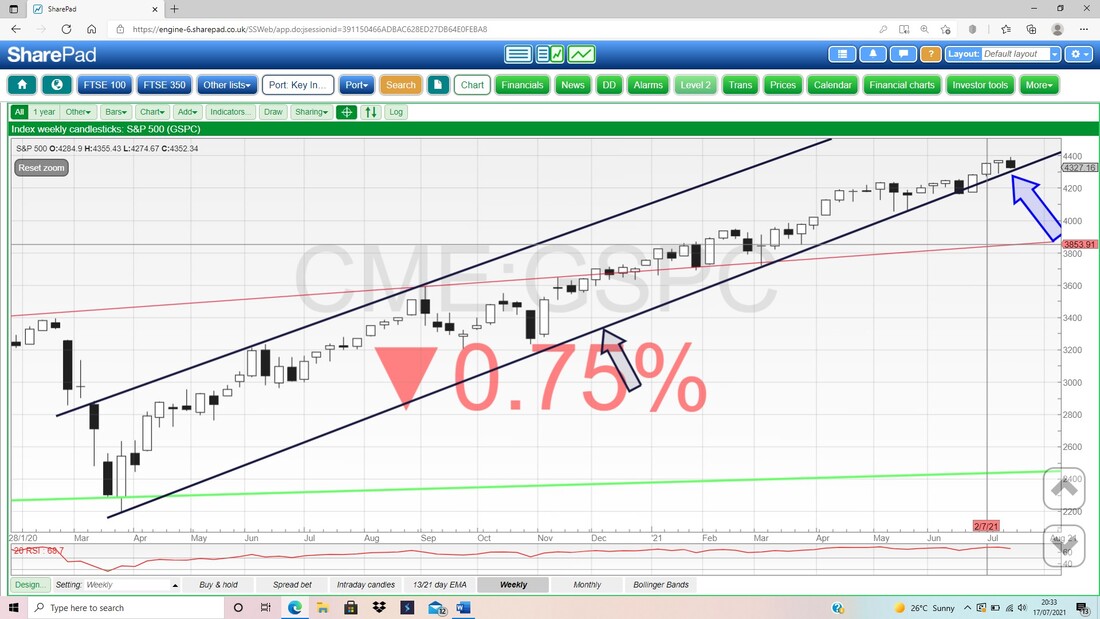
Next up we have the Weekly Candlesticks for the S&P500. My Blue Arrow is pointing to a small Down Candle from last week and this appears to have turned off of the sort of ‘Hanging Man’ shaped Candle from the week before. This doesn’t look a particularly scary Down Candle as it is relatively small and with Summer low volumes, I suspect this might not be the big problem that I know many are fearing. They might be right, but nothing I have seen yet tells me we are about to have a big Crash or something (I think that is highly unlikely, although I do expect a proper Correction in the Autumn, of perhaps 10% or so).
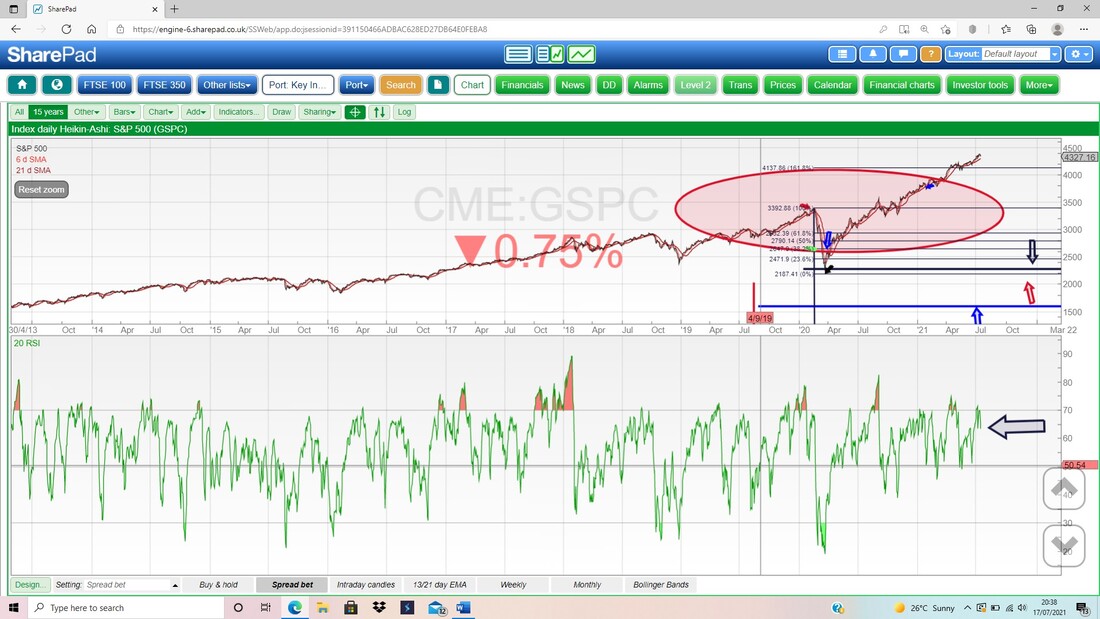
In the bottom window on my next Screen, we have the RSI (Relative Strength Index) for the S&500 Daily and on a reading of RSI 63, this is not high but it is very likely we pull back a bit more.
Next an extremely useful Signal – and at the moment it is Bullish.
What I am focused on here is the Black Wavy Line that is the 13 Day EMA Line (Exponential Moving Average) and the Red Wavy 21 Day EMA Line. Back where the Green Arrow is, we had a ‘Bull Cross’ where the Black 13 Day EMA moved above the Red 21 Day EMA, and that has pretty much been in force since then, with a bit of a challenge where my Blue Arrow is. At the moment, the 13 Day EMA is above the 21 Day EMA and that means it is best to stay on the Long tack. Shorting could work for very short periods of time, but quite frankly, it isn’t worth the bother. 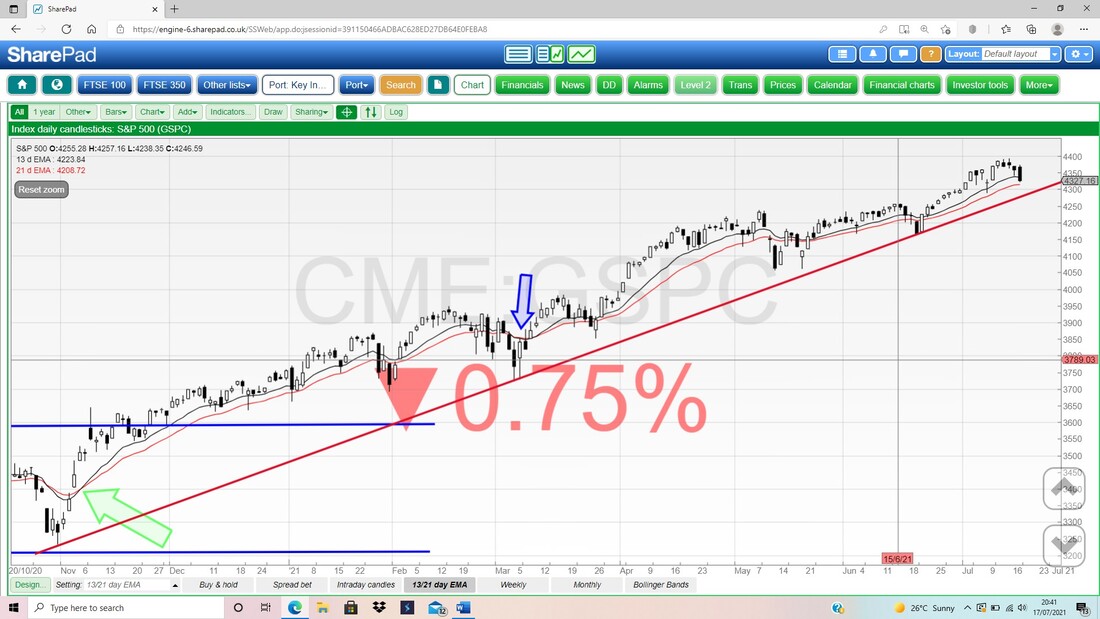
My final Chart for the S&P500 has the Daily Candles with the Pink Zone marking the Upper and Lower Bollinger Bands. My Blue Arrow is pointing to a Big Down Candle from Friday which looks pretty bearish, but bear (sorry) in mind that Fridays are often a bit weird and this is even more the case in the low volumes of the Summer months.
The Bottom Bollinger Band is at about 4320 and that could be nearby Support, and then we have Support at 4289 which comes from the Hammer Candle from back on 8th July and then we get down to 4250 and 4165. There is good Support here. 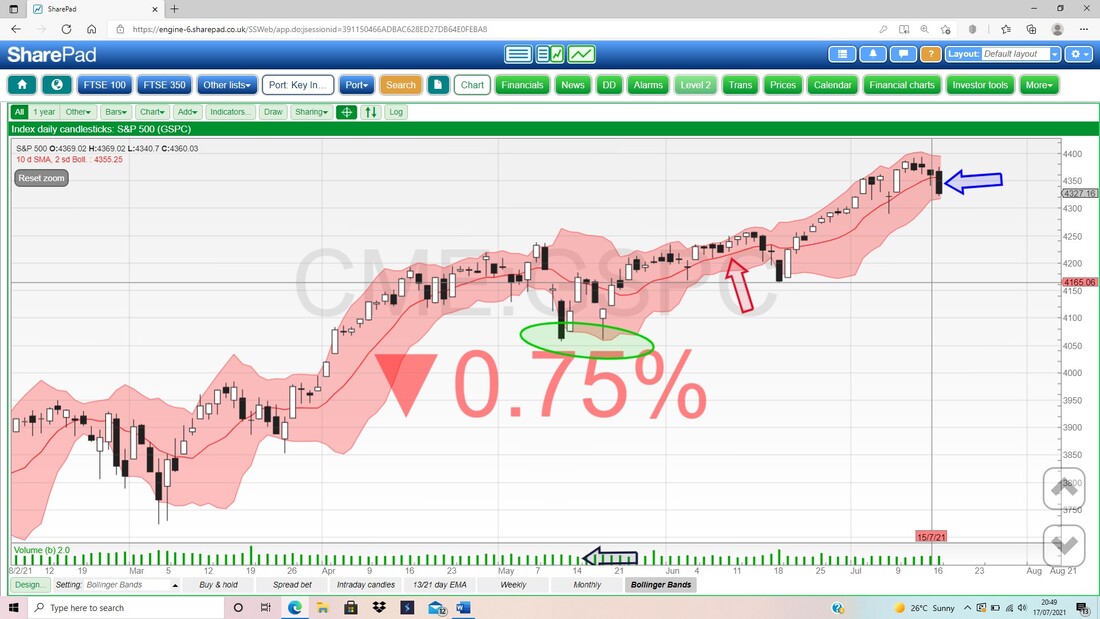
Brent Oil Composite
I like to look at the Oil Chart because of how it can impact the FTSE100 which I will come on to in a bit. My Black Arrow is pointing to a ‘Long Tails Doji’ on the Daily Brent Oil Comp Chart from Friday and the Price could turn up off of this Doji. There is good Support from the Low of Friday at about $72, and if that fails, then there is Support at $71 and $70. To the upside, we are looking at Resistance from the High of Friday at about $74 and then we move to $75 and $76. The recent Peak at $78 looks quite a challenge to get above. My Blue Arrow is pointing to a ‘Bull Cross’ between the Black 13 Day EMA Line and the Red 21 Day EMA Line. Note that is still ‘in force’ but the Lines are moving closer together so a ‘Bear Cross’ could happen soon. However, a short-term Bear Cross (or Bull Cross) can often happen, especially when Markets are choppy on low volumes. 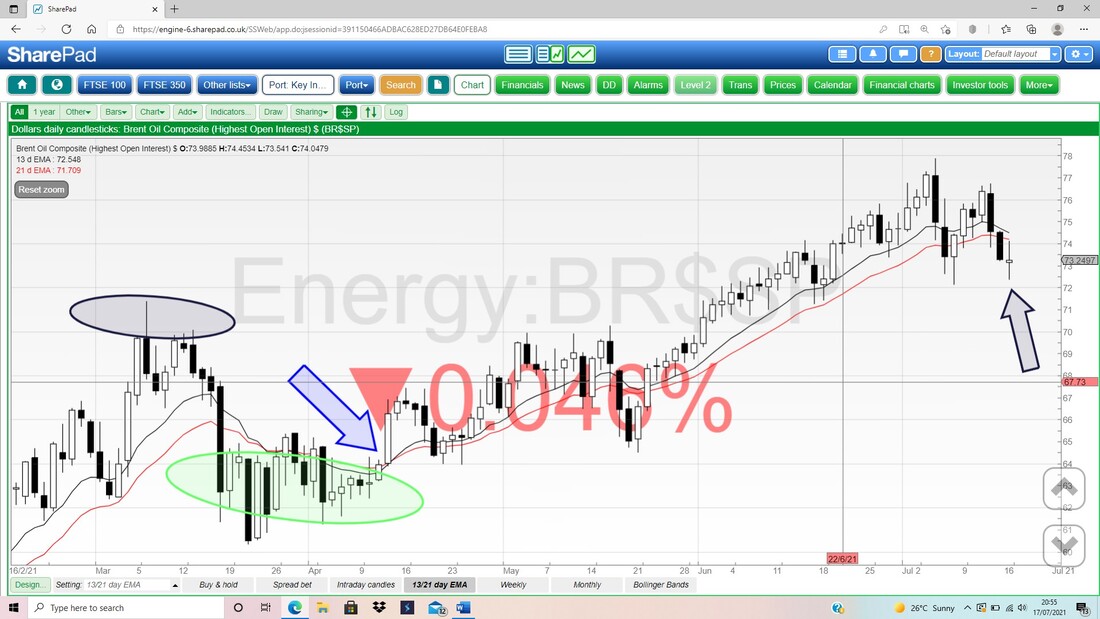
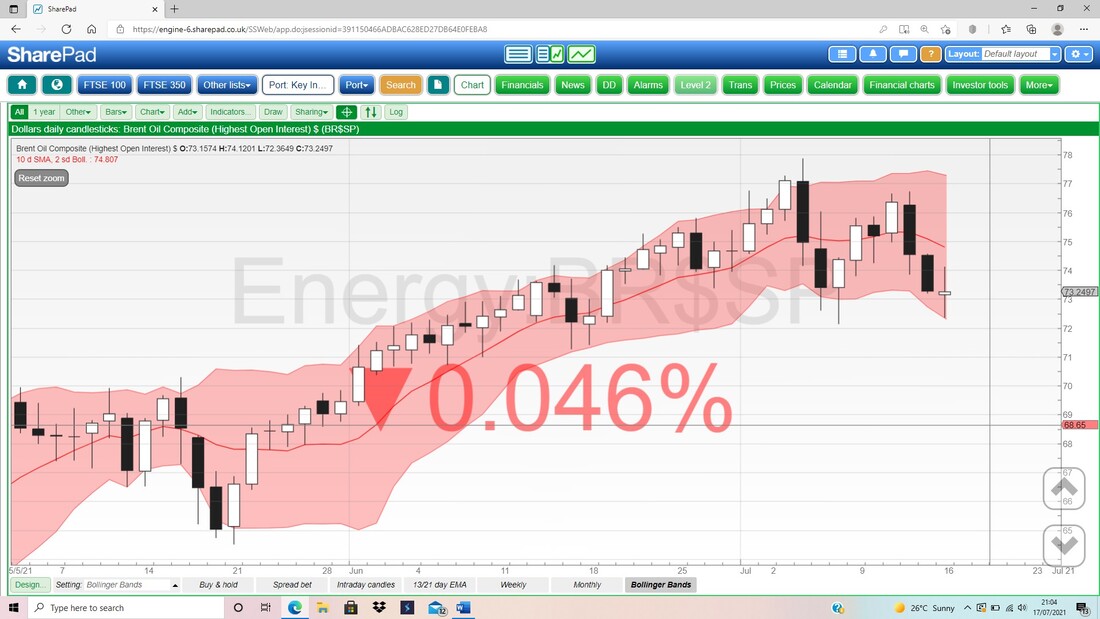
On my next Chart, look at how the Long Tails Doji from Friday is sat on the Bottom Bollinger Band. This supports the real possibility that it can move up from here.
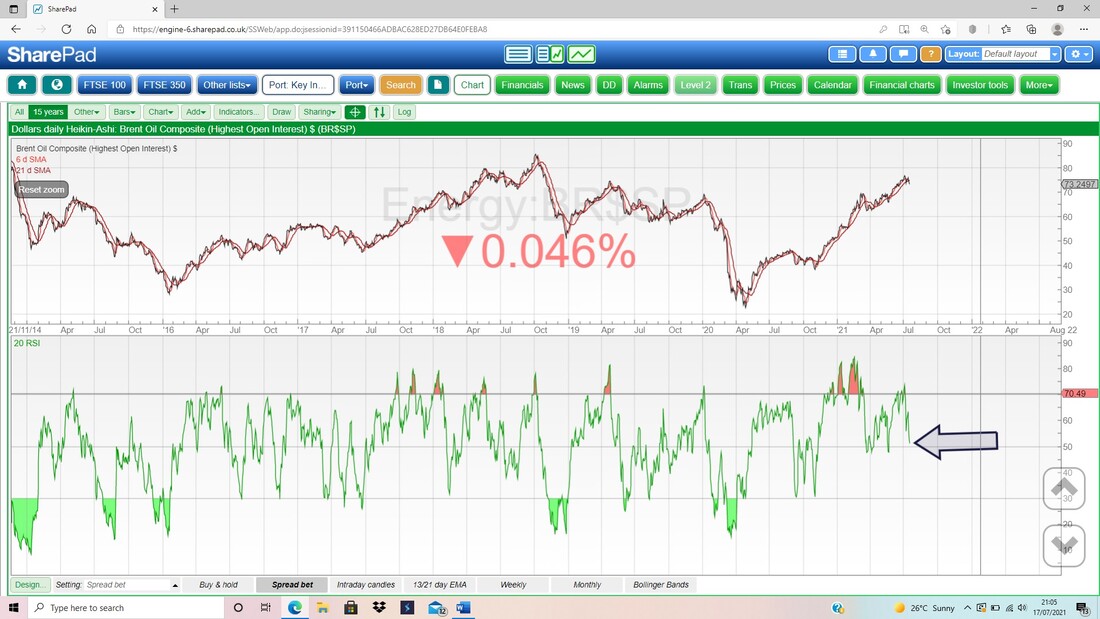
In the bottom window of my next Screen we have the RSI for the Brent Oil Comp Daily, and on a Reading of RSI 51 where my Black Arrow is, this is pretty much at the Neutral 50 Level and it could easily move up from here.
FTSE100
First up the 13 and 21 Day EMAs. My Blue Arrow is pointing to a ‘Bear Cross’ between the Black 13 Day EMA and the Red 21 Day EMA. However, as I mentioned already, when volumes are light and markets are choppy, it is often the case that a Bear Cross comes to nothing – so we could still see some rebound in coming days, and this would lead to a 13/21 Day EMA ‘Bull Cross’. There is something really interesting here. On the Brent Oil Comp Chart I showed the ‘Long Tails Doji’ and my Green Ellipse is highlighting where the FTSE100 did a similar Candle on Friday. It could turn up off of this. The Support from Friday is down at 6978 and then where my Black Arrow is we have Support at 6948. To the upside, the High of Friday was at 7056 then we are looking at Resistance at 7111, 7152 and 7170. 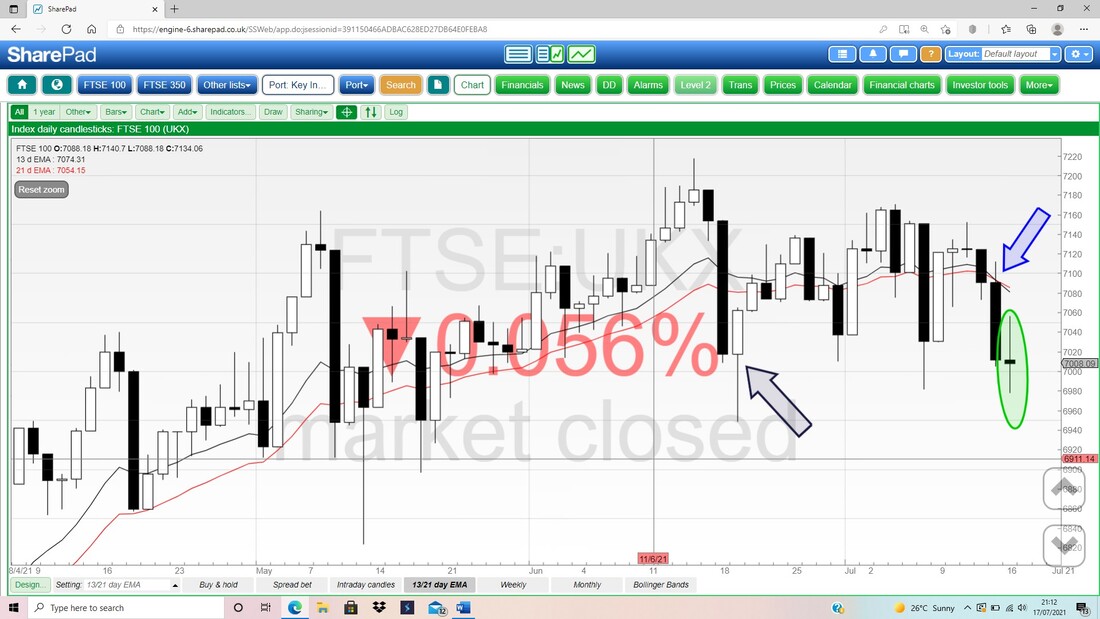
In the bottom window of my next Screen, we have the RSI for the FTSE100 Daily. On a Reading of RSI 44 where my Red Arrow is, this is clearly quite low if the FTSE100 does fancy trying to bounce but it also means it could fall a long way if the mood is a problem.
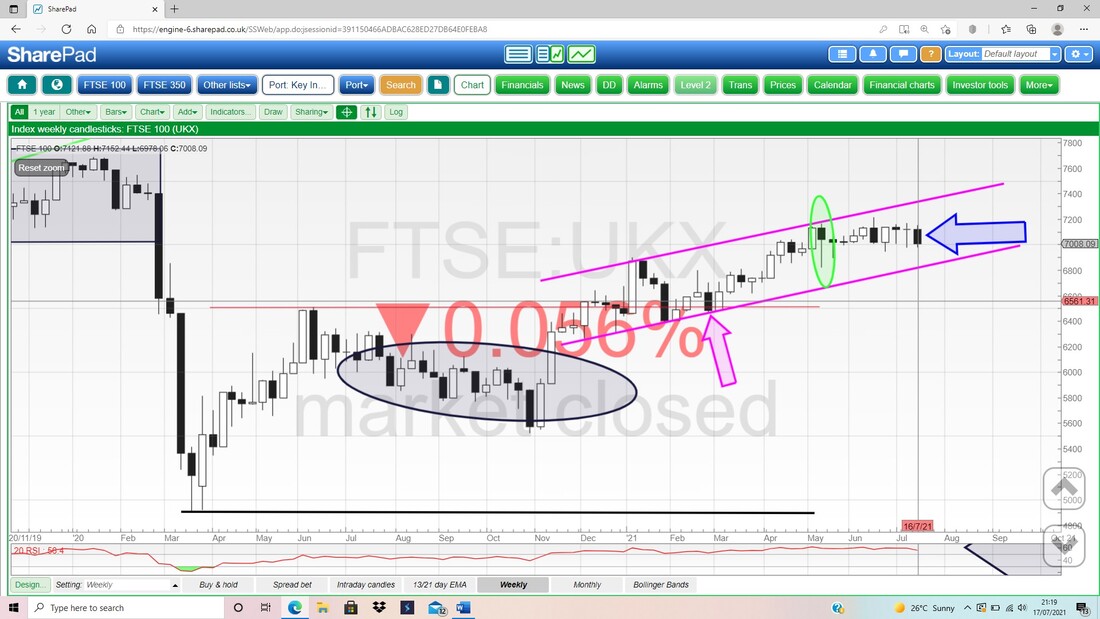
My next Chart has the Weekly Candles for the FTSE100 and my Blue Arrow is pointing to a big Down Candle from last week and this looks a bit bearish, on its own. However, note there is good Support from the Low of the Candle where my Green Ellipse is at 6823 and coincidentally, this lines up with the Bottom Support Line of the Uptrend Channel that is marked by my sort of Purple/Pink Lines (pointed at by a similar coloured Arrow).
Last up the Daily Candles and the Bollinger Bands for the FTSE100. Look how the Long Tails Doji from Friday (Black Arrow) turned up off the Bottom Bollinger Band. The Red Midpoint Line (Red Arrow) is at about 7095 and this could be Resistance.
Despite my stance at the moment that I am not seeing anything that tells me a big drop is coming, I will continue to be on High Alert and keeping my senses sharp to look for signs of trouble. As always, I will be Tweeting out what I see in the Charts, especially around 10pm most evenings, and if I see a reason to Hedge, then I will be Tweeting this out and making an entry on my ‘Trades’ page on WD1. Anyway, what will be will be, and in the meantime, best of luck for the coming week and I hope you manage to get out and about in the sunshine. Cheers, WD. 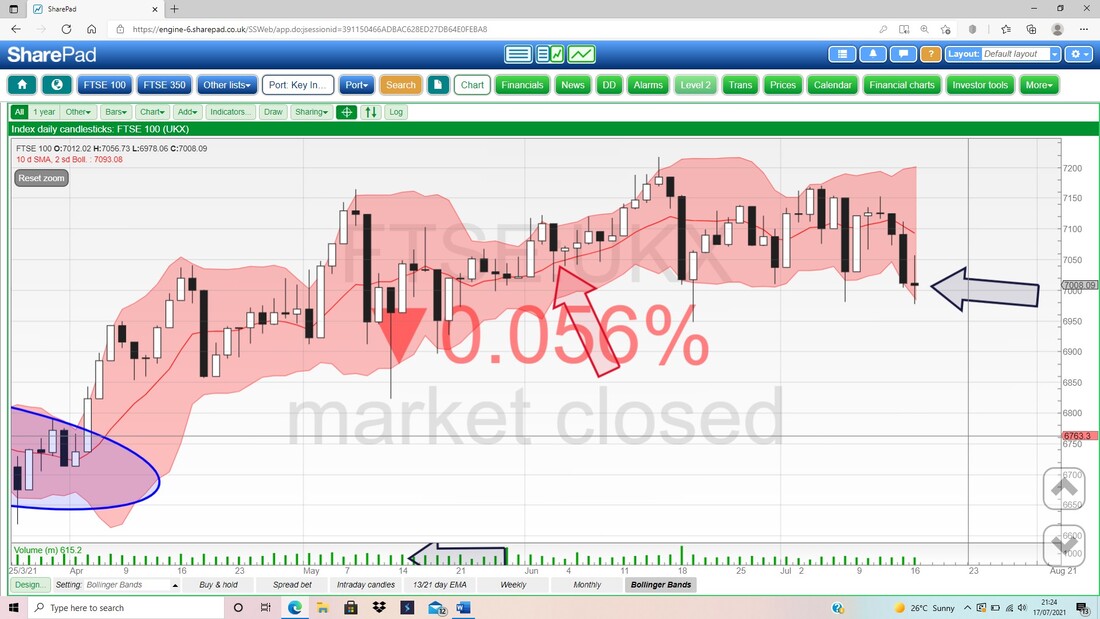
0 Comments
Leave a Reply. |

Stocks & Markets WheelieBlogsThese tend to be more Markets and Stocks related and timely - the Blog Page on the Main WheelieDealer Website has the 'Educational' stuff (well that's the theory anyway !!). Archives
October 2021
Categories
All
|
