

|
stocks & Markets blog |
|
THIS IS NOT A TIP OR RECOMMENDATION. I AM NOT A TIPSTER. PLEASE DO YOUR OWN RESEARCH. PLEASE READ THE DISCLAIMER ON THE HOME PAGE OF MY WEBSITE. IF YOU COPY MY TRADES, YOU WILL PROBABLY LOSE MONEY. I HAVE A LARGE PORTFOLIO AND I USE DIVERSIFICATION TO SPREAD RISK ALONG WITH TRICKS LIKE HEDGING AND OCCASIONALLY BY THE USE OF STOPLOSSES - IF YOU BUY ANY STOCK YOU REALLY SHOULD FOCUS ON HOW IT FITS IN WITH THE REST OF YOUR PORTFOLIO AND KEEP RISK MANAGEMENT AT THE FOREFRONT OF EVERYTHING YOU DO. BE AWARE THAT ALL INVESTORS/TRADERS GET THINGS WRONG AND MANY STOCK SELECTIONS WILL WORK OUT BADLY.
This is Part 2 of these GTLY Blogs and you can read Part 1 here: http://wheeliedealer2.weebly.com/stocks--markets-blog/stock-idea-gateley-holdings-gtly-part-1-of-2
Director Share Sell
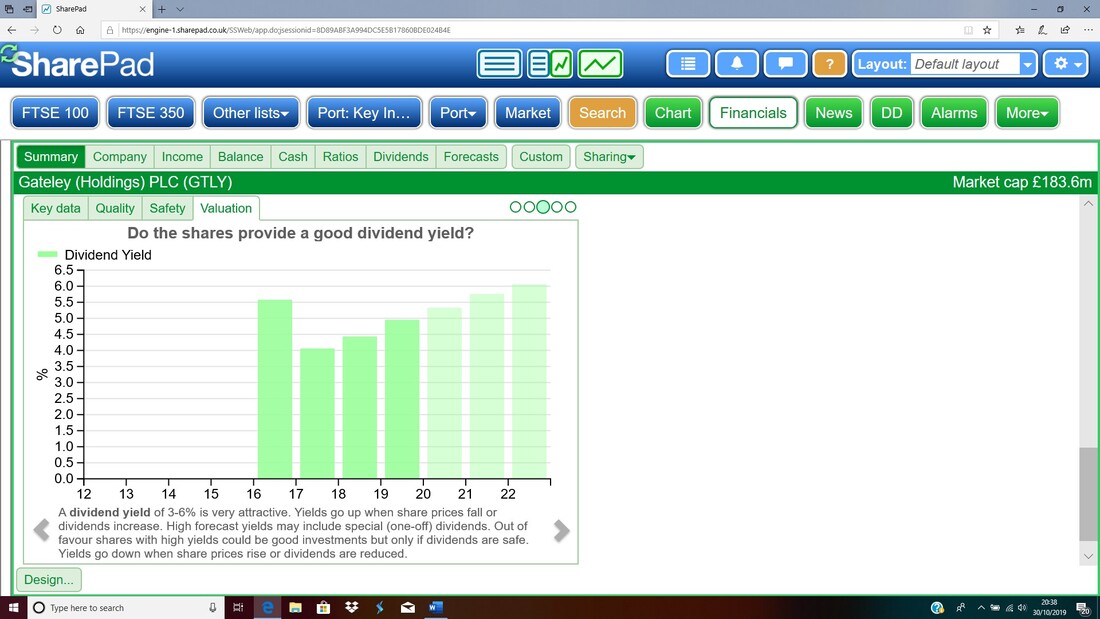
Since I published Part 1, on the 5th November 2019 there was a Share Sell by Jonathan Stott (who is described as a ‘Member of the Operations Board’) of 30,000 Shares at 155p which gives a total value of £46,500. You can read the RNS here and there is no reason given for the sale: https://polaris.brighterir.com/public/gateley_plc/news/rns/story/rg03jzx I have had a poke around on the GTLY website and looked on SharePad and looked in the Annual Report and can find no mention of this chap. He does not appear to be a major shareholder and of course there are a wide variety of reasons for why he could be selling. On its own it is not something that would worry me too much but if we saw more Director selling then that could be something to consider. SharePad ‘Phil Oakley’ Charts There is an excellent feature in SharePad which was created by Phil Oakley when he was with them and it has lots of Charts that show various aspects of a Company’s financial performance. In the ScreenShots below I will pick out various ones that I think are interesting/important with regards to GTLY. I took these ScreenShots on 30th October 2019 but I don’t think they have changed at the time of publishing this blog. The Chart below shows the Dividend progression since GTLY Listed and the ‘greyed out’ Bars are for the Forecast Dividends. Obviously if something goes awry then the Forecast Dividends may not appear, but on the assumption that GTLY has the potential to be a steady growth business, then the chances are that the Dividends will arise for Shareholders. 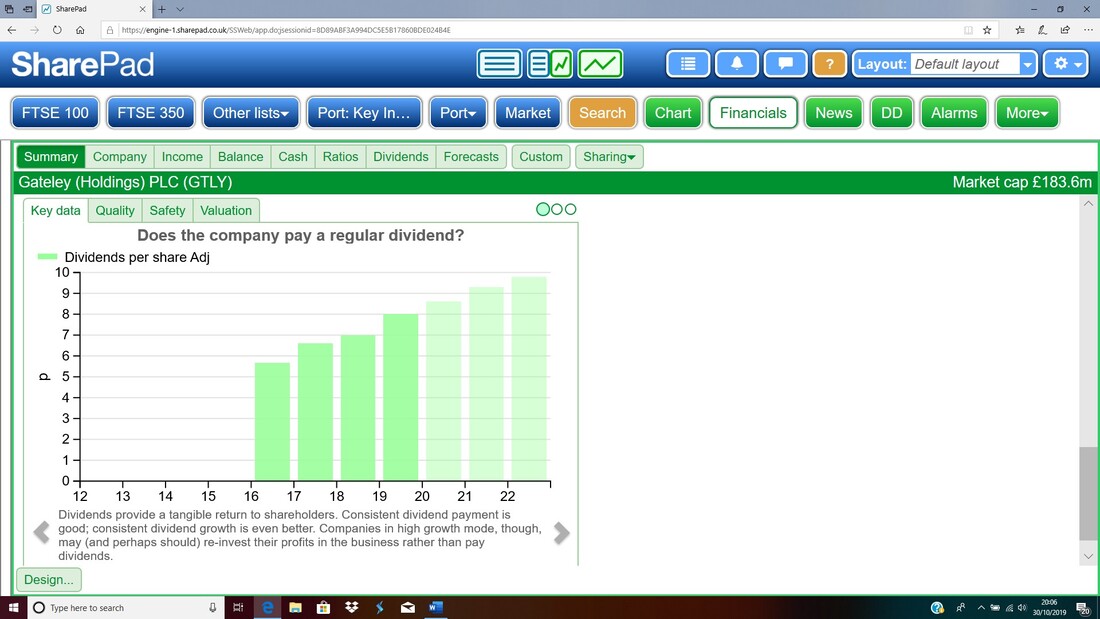
This next screen contains information on Revenues (Turnover) and EBIT (Earnings before Interest and Tax) from before the point where GTLY Listed. Clearly Revenues have been growing nicely and this is expected into the future, but the Profits (EBIT) have not grown as fast although they are crawling up.
The drop in EBIT seems to coincide with when GTLY Listed and I would assume that in the first year of Listing there would have been one-off costs for the Listing process and then in subsequent years I suspect GTLY have had to pay more to attract good staff and this has increased Costs and lowered Profits. I went to the Reports and Presentations bit on the GTLY website which is here and under the 2015 section I found the following text from the ‘Full Year Results for the year ended 30th April 2015’, and this seems to explain the dip in the Profits: https://gateleyplc.com/investors/investor-relations/results-reports/ “Adjusted Pro-forma Pre-tax Profit was up 32.4% to £9.8m (2014: £7.4m). Adjusted pro-forma numbers are stated after excluding income or expenses that relate to non-underlying items. Non-underlying items include one-off professional costs in respect of the Group's future strategy, on-going property lease restructuring costs and additional costs resulting from the release of operating lease incentives in accordance with IFRS, whereby lease incentives are now recognised over the full term of the lease.” 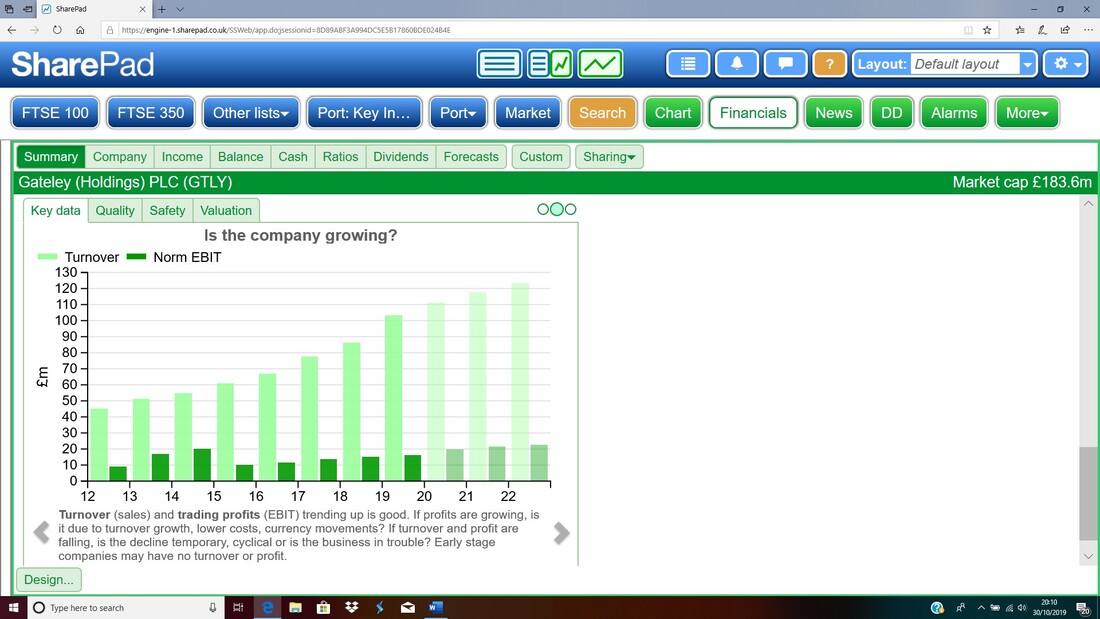
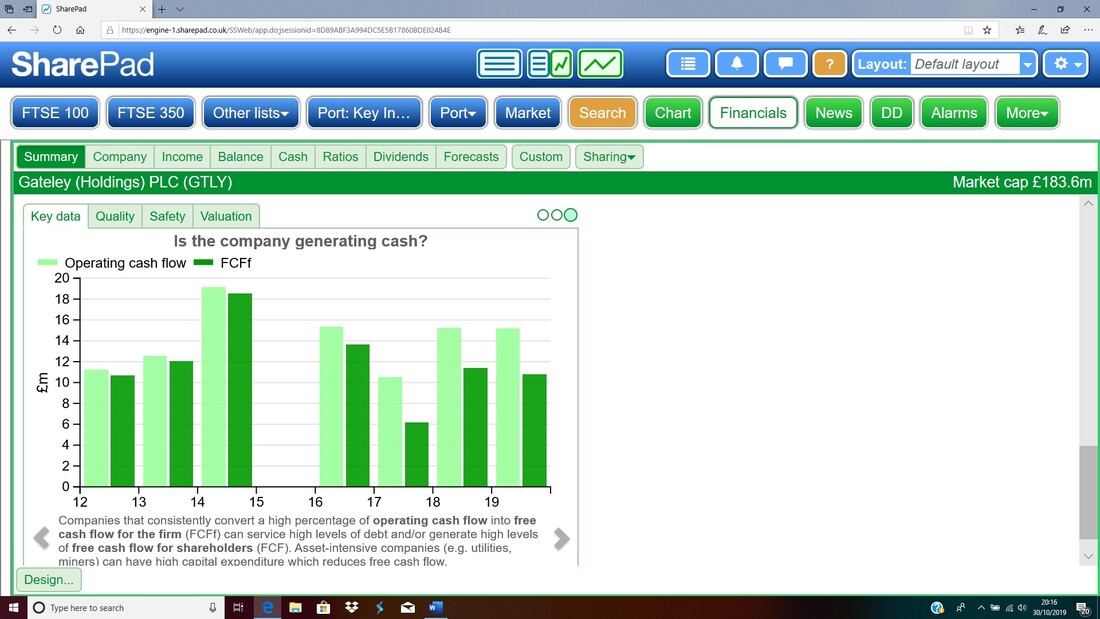
From the next Chart, GTLY seems to be quite good at converting Operating Cash Flow into Free Cash Flow (FCF). I am not sure why there is a gap on the Charts for 2015 !!
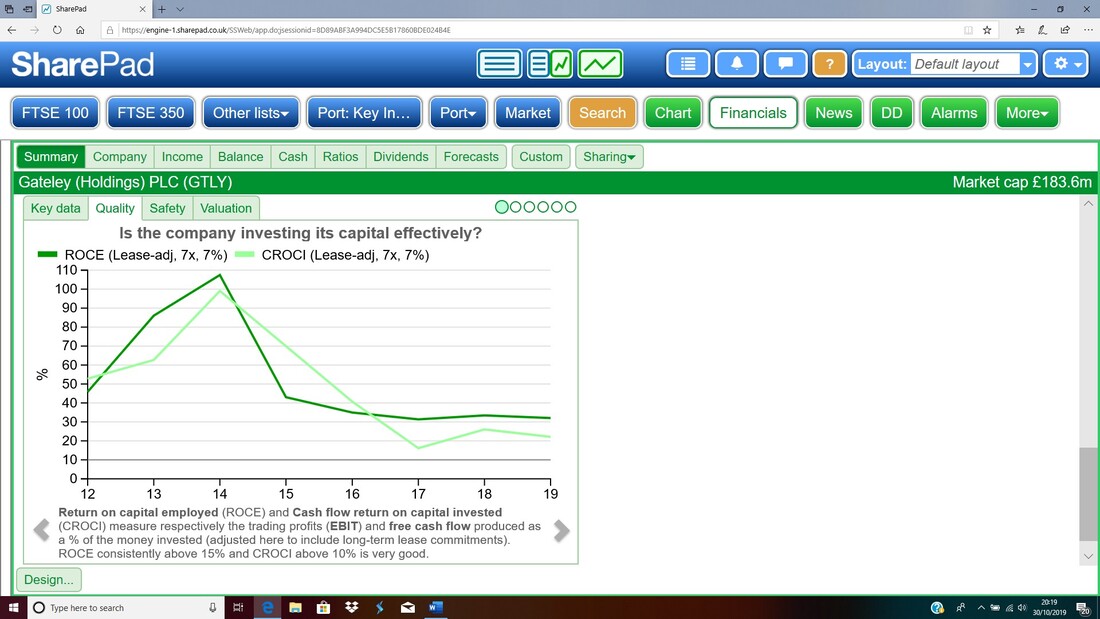
I’ll let you interpret the next Chart which has ROCE (Return on Capital Employed) and CROCI (Cashflow Return on Capital Invested). If you read the words at the bottom of the Chart then it looks like these metrics for GTLY are quite good.
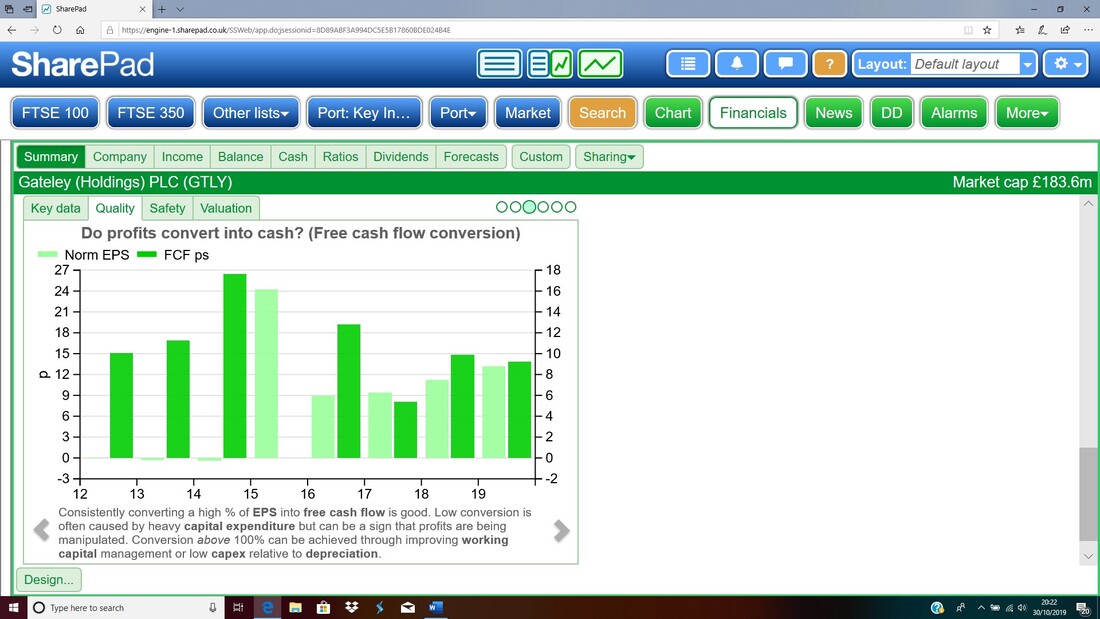
We have another Cash Conversion one next and this looks at how much of Earnings Per Share (EPS) is converted into Free Cash Flow. In recent years since Listing the GTLY numbers look pretty good although in earlier years it was generating much more Cash than the EPS – I have no idea why that was.
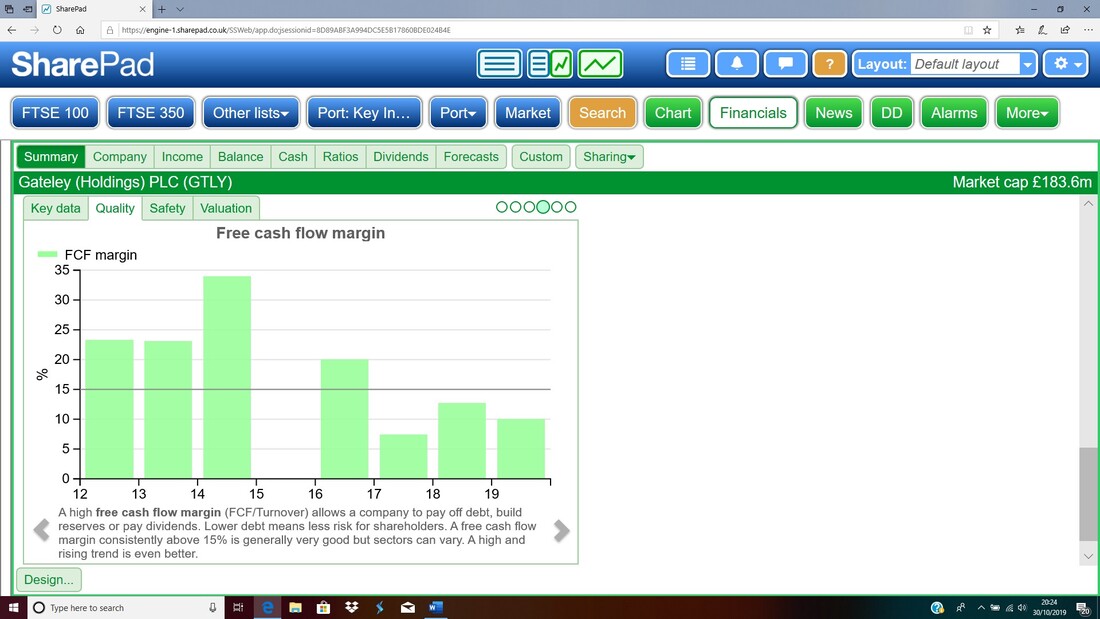
The next Chart talks about Free Cash Flow Margin which is the proportion Free Cash Flow represents of Revenue expressed as a percentage. It is worth noting that this Free Cash Flow Margin has dropped in recent years and to an extent this lines up with what we saw earlier where Revenues were rising fast but EBIT was lagging. This is clearly something to keep an eye on in coming years.
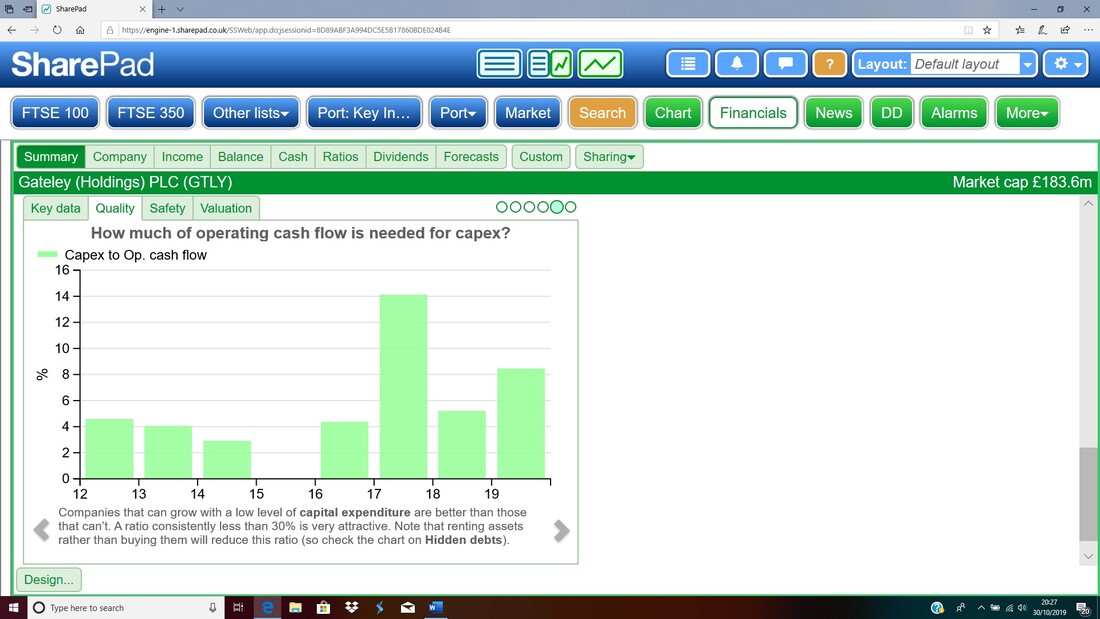
If you read the text at the bottom on the next Chart then this looks pretty good with Capex (Capital Expenditure) requirements seeming to be quite low. I guess that is no big shock with something that is really a ‘People’ business which really just needs Offices and associated equipment to be able to operate.
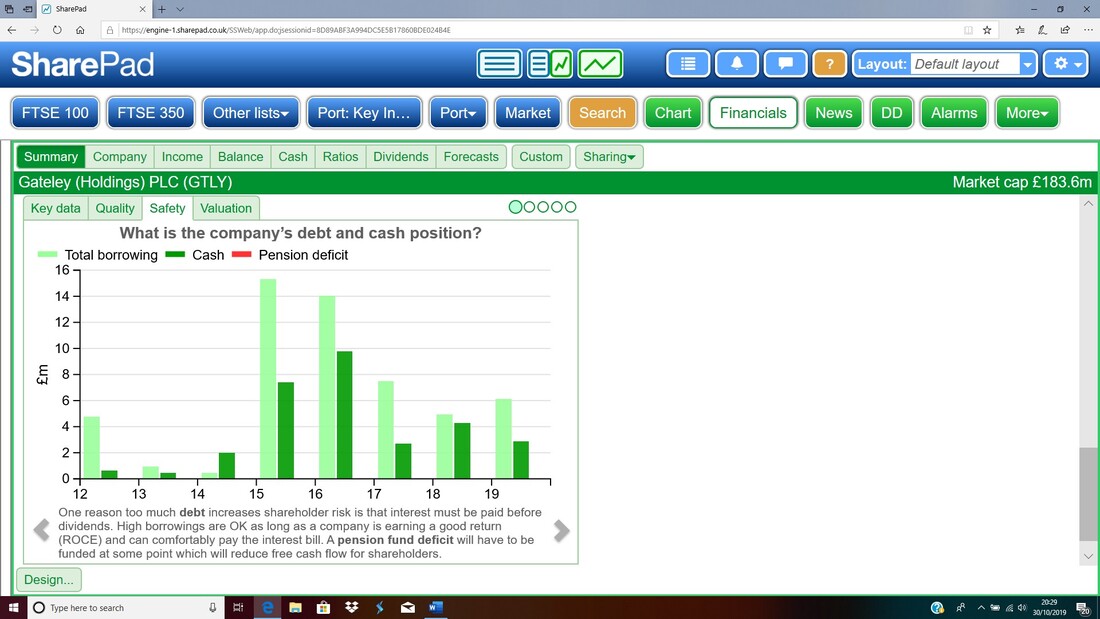
Next up the Debt seems to be under control and there is a bit of Cash sloshing around. There doesn’t appear to be any Pension Deficit which is obviously nice. With Debt not too high, GTLY has plenty of firepower to do more acquisitions which could add to Revenue and Profit growth and ultimately higher Dividends.
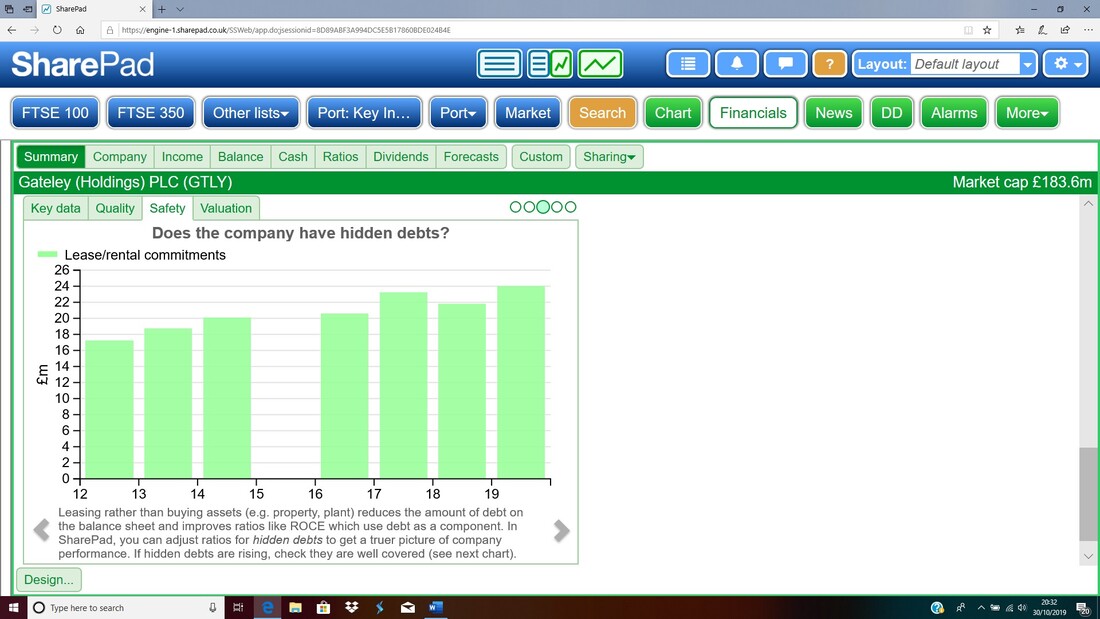
Again on the next Chart we have a missing Bar for 2015 – I am not sure what happened here and perhaps it was a change of the Accounting Period or something around the IPO. The Lease/Rental commitments look pretty stable and I presume these are for the GTLY Offices.
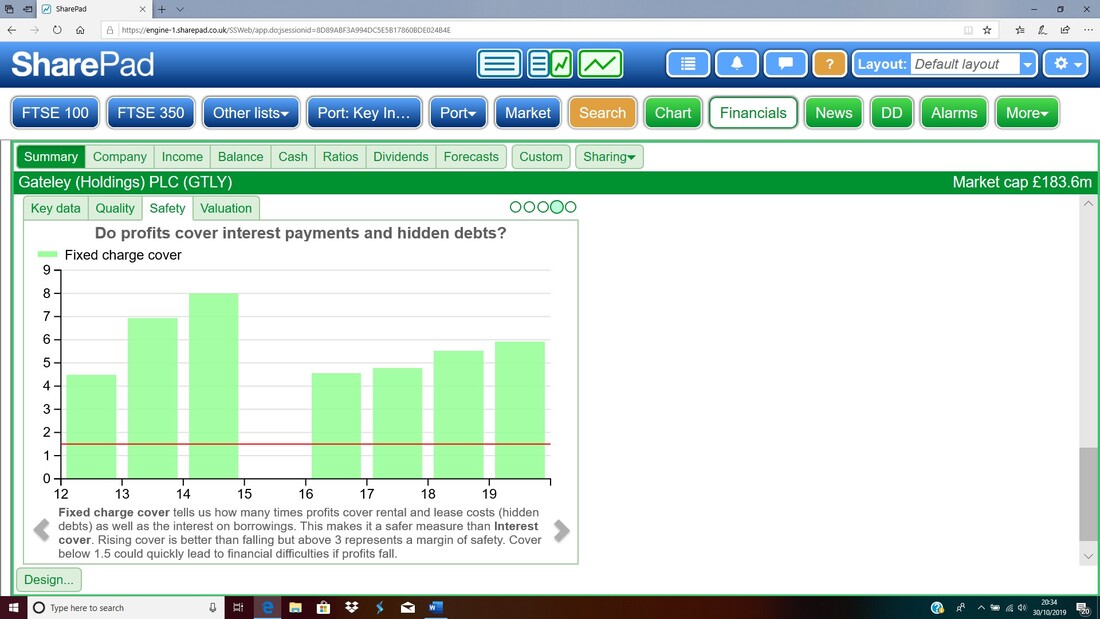
From the next Chart it looks like stuff like Lease Payments are very well covered.
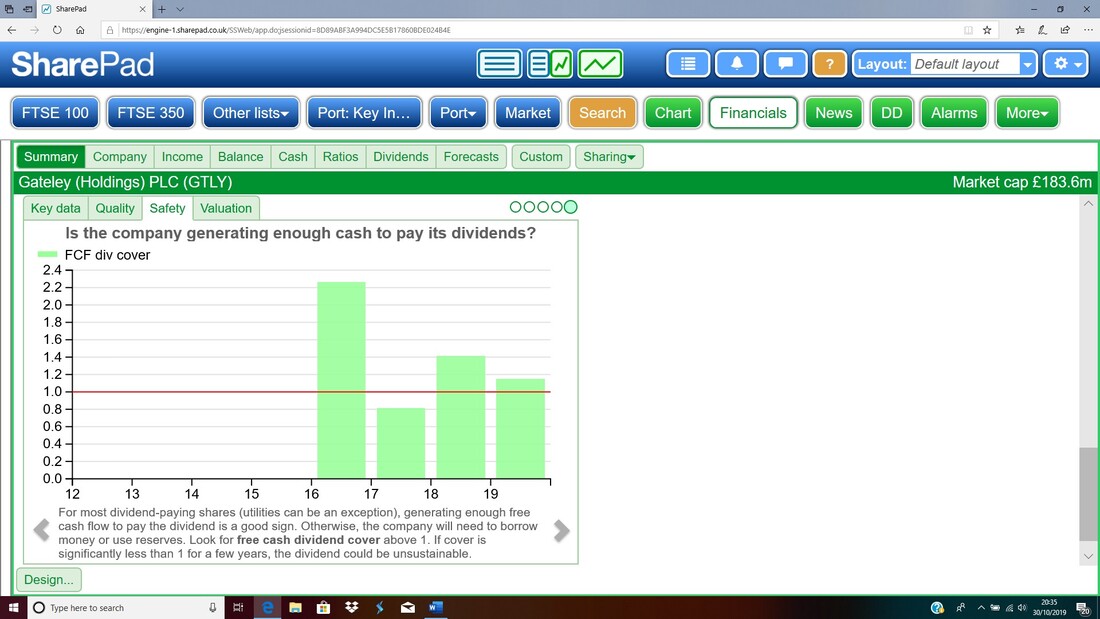
This next Chart is not so great and something we need to keep track of again. This is Dividend Cover and it looks quite tight.
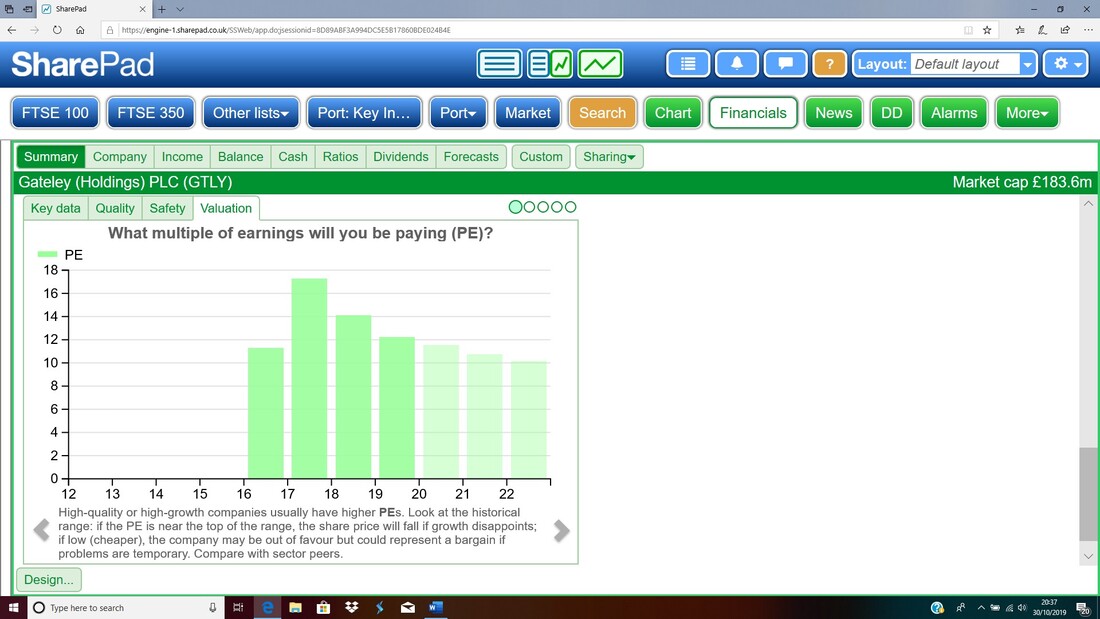
This next one is interesting because it shows that the P/E Ratio for GTLY has been falling. Later in the ‘Targets’ section I talk about possible P/E Ratios and looking at this it is worth noting that GTLY was on a P/E of 17 very recently.
This next Chart suggests future rises in the Dividend which of course would be very welcome but we must bear in mind that earlier Chart which showed the Dividend Cover was a bit tight. This may seem similar to the first Phil Oakley Chart I showed but that was the absolute Dividend figure in Pence whereas this is the Dividend Yield which is of course a function of the Share Price.
Cash Generation
If you refer back to the SharePad Screens I just showed there are a few related to Cash Generation etc. In the latest 2019 Annual Report it stated the following, and it looks to me like there are no big concerns here: ‘Cash generated during the year from operations was £12.1m (2018: £12.2m) which represents 92.7% (2018: 103.3 %) of profit after taxation. Capital expenditure increased to £1.3m (2018: £0.8m) due to acquisitions in the year, which resulted in greater office expansion and information technology outlays. The Group deliberately continues to operate with a low level of gearing and fixed term debt.’ Revenue Recognition I think I mentioned in Part 1 about a comment in the Auditor’s Report regarding Revenue Recognition. I am hoping you can read the text in the Screenshot below but if not it is on Page 49 of the Annual Report for 2019. The conclusion from the Auditor is that they did not find any “material misstatement” which is slightly positive (can we trust Auditors these days?) but the fact that GTLY seems to generate a decent amount of Cash suggests to me that there are no big problems here. 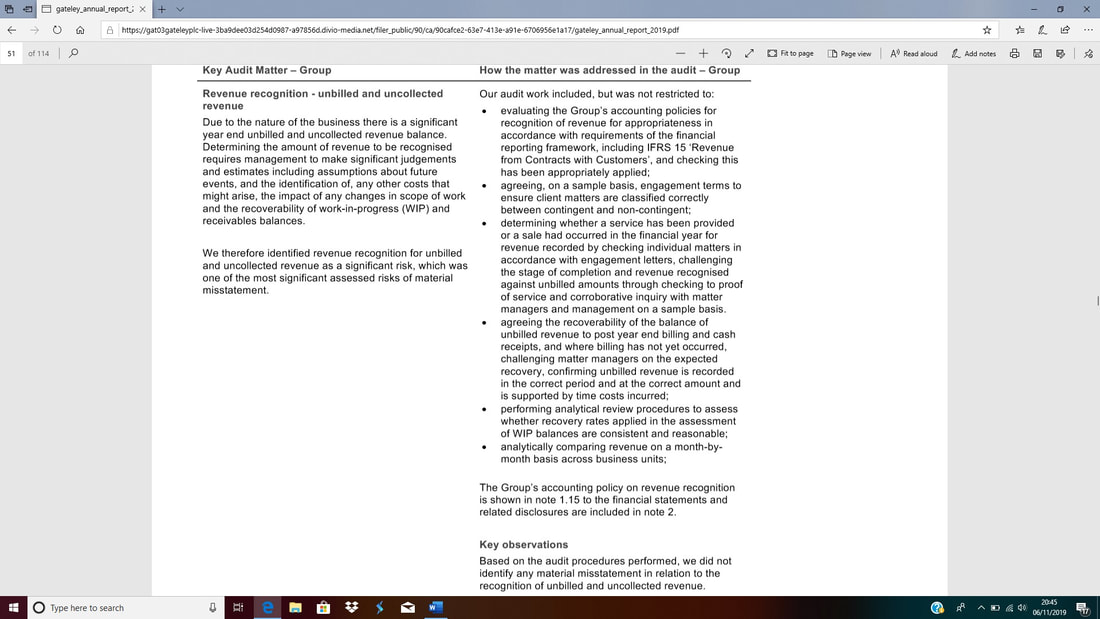
Dividend Policy
I found this in the latest 2019 Full Year Annual Report: ‘The Board has adopted a dividend policy which reflects the strong long-term cash generation and earnings potential of the Group, distributing up to 70% of profits after tax each year to shareholders.’ There’s no doubt it is sort of useful to have a Dividend Policy but when you think about it this doesn’t really tell us all that much. There is a lot of wiggle room here and I would prefer a set target such as 10% hike every year where we can pin the Director’s down Valuation The ScreenShot below is taken from SharePad and I did it on 30th October 2019 – obviously at the time you are reading this things might have moved a bit. Well, on the 7th November when I am finalising this document and checking what may have changed since my earlier drafts, it turns out that the Price and all the details in the screen below are exactly the same. Clearly the GTLY share price has not done much in that time !! 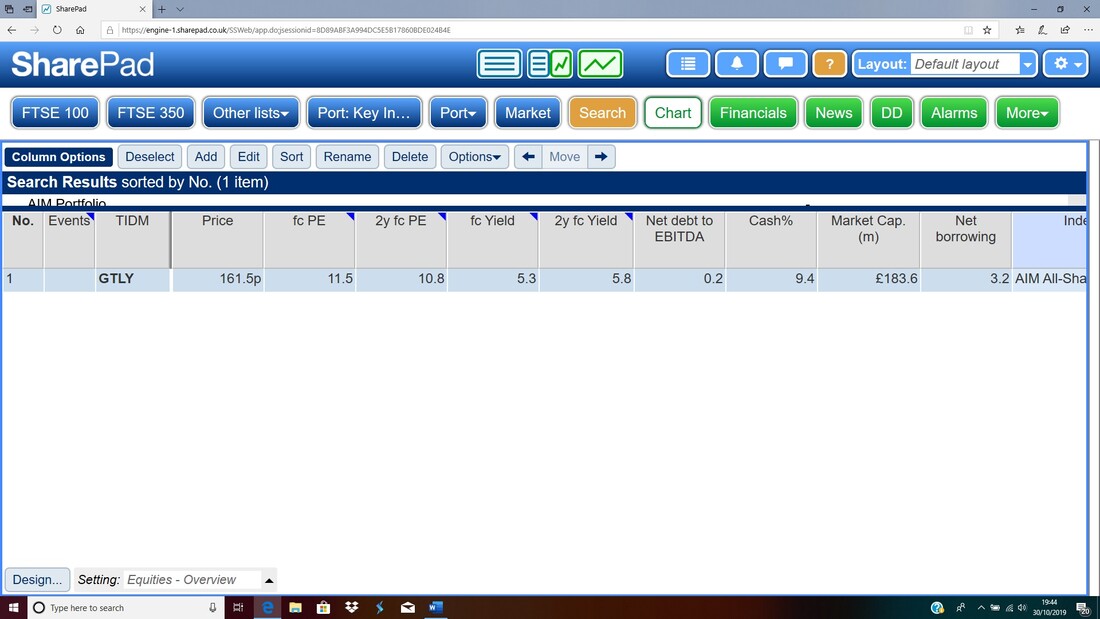
You should be able to see a ‘fc PE’ (Forecast P/E) of 11.5 which is for next year and then for 2 years out, the ‘2y fc PE’ is 10.8. These look quite attractive valuations to me.
Just to the right of those P/E Numbers you should see ‘fc Yield’ of 5.3% which is the expected Dividend Yield for next year and 5.3% is quite attractive. The ‘2y fc Yield’ is showing as 5.8% which is really quite juicy. Targets Again the ‘FORECASTS’ ScreenGrab below was taken from SharePad on 30th October 2019. 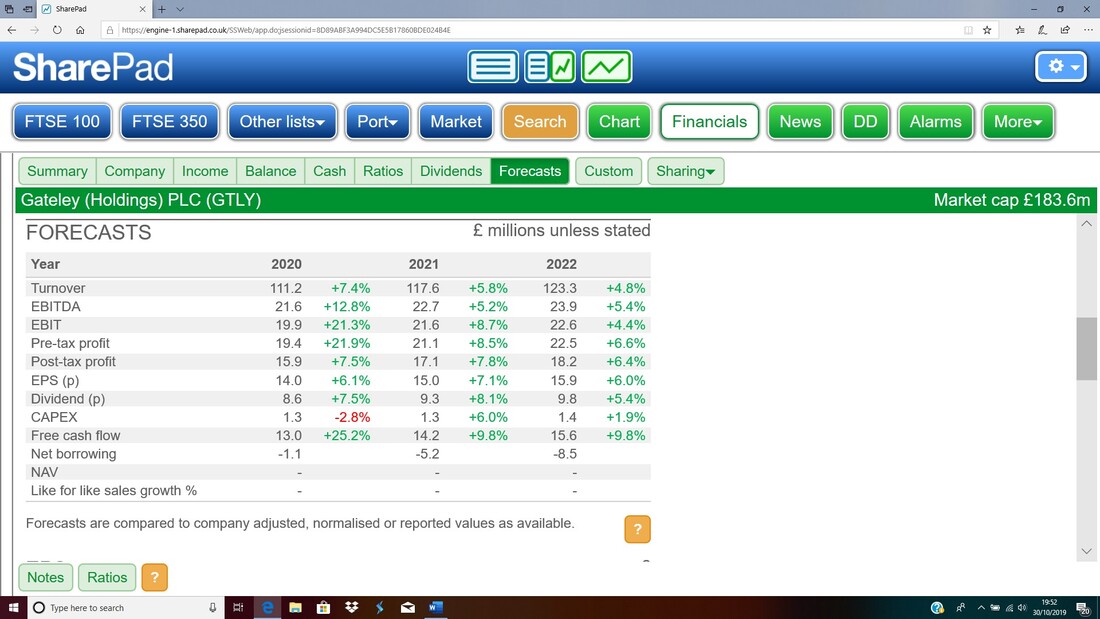
GTLY has been Listed for about 4 years and in that time has proven to be quite stable and showed steady growth in the business. If that can continue into coming years and if more acquisitions etc. can speed up the growth rate, then it is not hard to envisage GTLY being on a Forward P/E of about 15.
Taking the EPS (p) (Earnings per Share) forecast figure for 2022 of 15.9p and slamming a Forward P/E of 15 onto this, we get a Target figure of 238p (15.9 x 15). At the time of writing, the Share Price for GTLY is 161.5 so this is potentially 47% upside and there will be tasty Dividends along the way if all goes to plan. And with patience there could be more. I think a Forward P/E of 15 is probably appropriate but it is not impossible to imagine GTLY on a Forward P/E of 18 if it can impress the Markets and it is quite possible that EPS up around 18p (or perhaps more) could be achieved which would give a potential Target of 324p. Technical Picture I took these Chart images on Thursday 7th November 2019, just before publishing. The Chart below shows the ‘Big Picture’ for GTLY going back to the IPO and clearly there is a big Triangle here between my Black Support Line at the bottom (marked by my Black Arrow) and the Red Resistance Line up above (marked by my Red Arrow). If the Share Price drifts downwards then we would want the Black Support Line to hold and for Bulls to get excited we would want to see a Breakout of the Red Line which could imply further gains to come. It is worth noting there are previous Peaks just above at 170p, then 180p, then 190p and the key level is 200p and if it can get above this then that would be very bullish behaviour. One way to play a Chart like this is to buy a small ‘Starter Position’ to get going and then as we get Breaks above these Resistance Levels we could buy more to increase the Position. 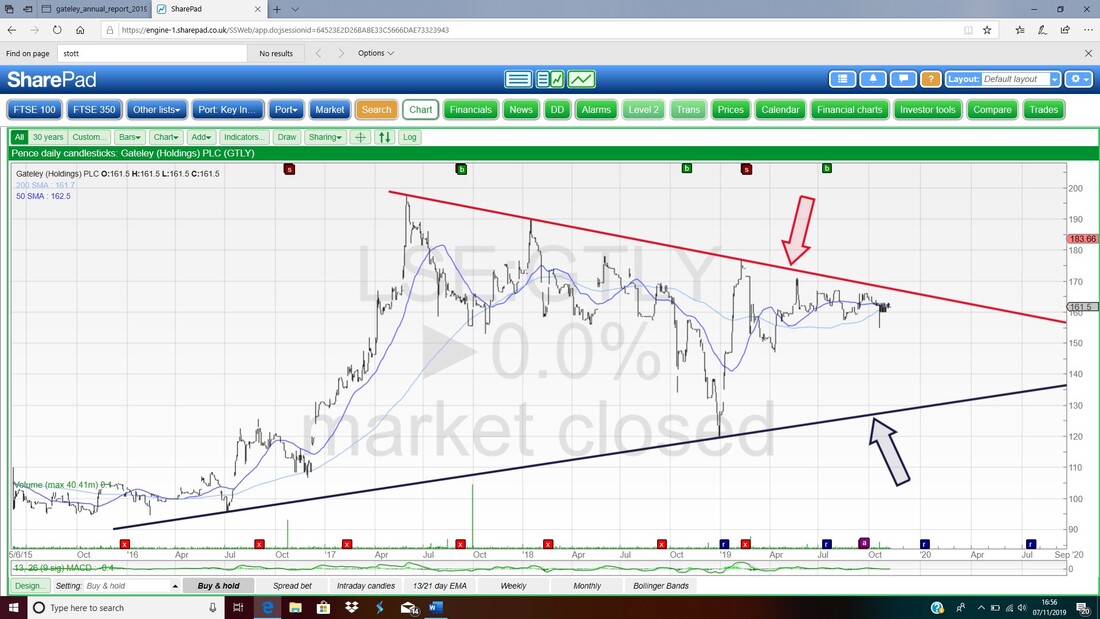
On the Chart below we have the Daily Candlesticks going back about 6 months or so and where my Black Ellipse is I am highlighting that the GTLY Share Price has pretty much done nothing for weeks.
My Blue Arrow is pointing to a Hammer shaped Candle from 18th October 2019 and note the Long Tail which found Support at 155p. This should be a good Support Level. Up above you should be able to see the Red Resistance Line which was on the previous Chart. Something that really stands out here is that GTLY is highly illiquid which you can tell by the choppiness of the Chart. This means it may be difficult to build a sizeable Position and, more importantly, it could be very difficult to Sell a large holding quickly. This illiquidity could also put off Institutional Buyers and hold the Share Price back via that mechanism – however, we would still pick up a nice dividend and if GTLY can deliver growth in the Business then sooner or later I would expect the value to come out. Much of the illiquidity will be down to the big Shareholdings of the Directors and Partners as I mentioned In Part 1. 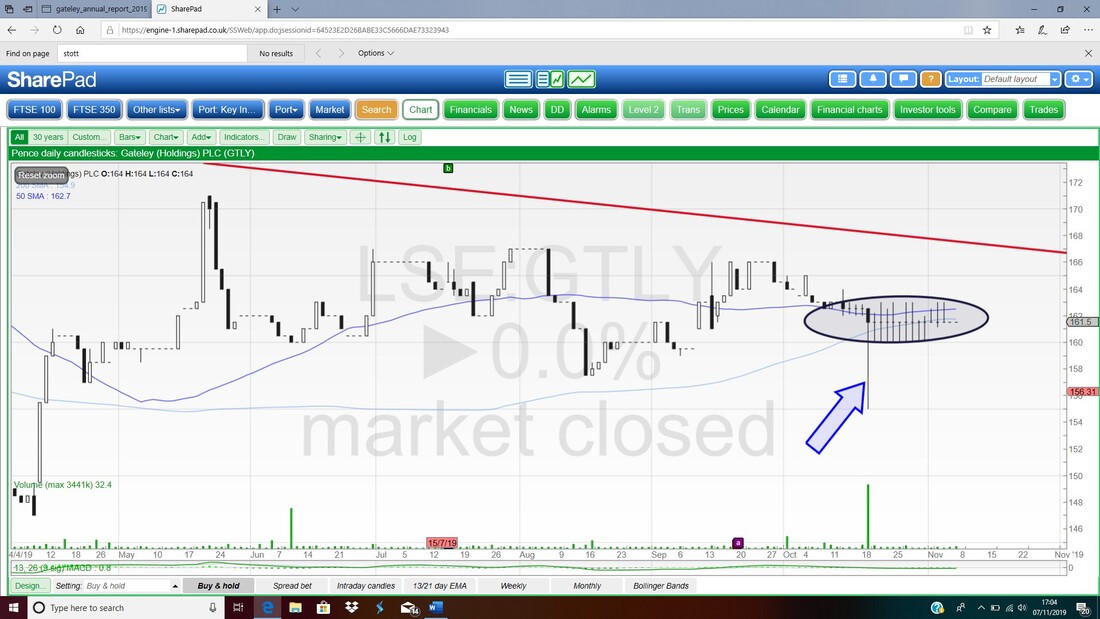
Conclusion
Having completed my digging into GTLY I really like what I see and I do expect to be buying some Shares soon. The particular attractions are a big Dividend (although as I mentioned we need to watch the Dividend Cover which is a bit tight) along with a fairly stable looking business that should be able to steadily grow as we head into the future. It has a strong Balance Sheet with very little Debt and has scope to do more acquisitions which should boost growth. It is quite likely that GTLY as a business has some fairly defensive aspects and it could be quite resilient in tough times. It also looks to me like the Valuation is quite reasonable if not down right low (especially in this current Market climate where we still have a lot of Stocks on Forward P/Es up in the 20s and 30s or more) so we could get some Share Price upside simply from the Market ‘re-rating’ the Stock and giving it a higher P/E. A Red Flag is the Directors’ Pay which is certainly ‘generous’ and it does seem to be quite a competitive market as I discussed at length in the Risks section. It must also be appreciated that it is a very illiquid Stock so we could easily see some dramatic movements. GTLY is very much an established business with a long track record and the growth in the Revenue over many years is impressive and if they can keep this going then we should see decent growth in Profits and Dividends and the Share Price in coming years. To emphasise this, look at this Chart from the Results Presentation from 2019 (I’ve put a link right at the end of this blog): 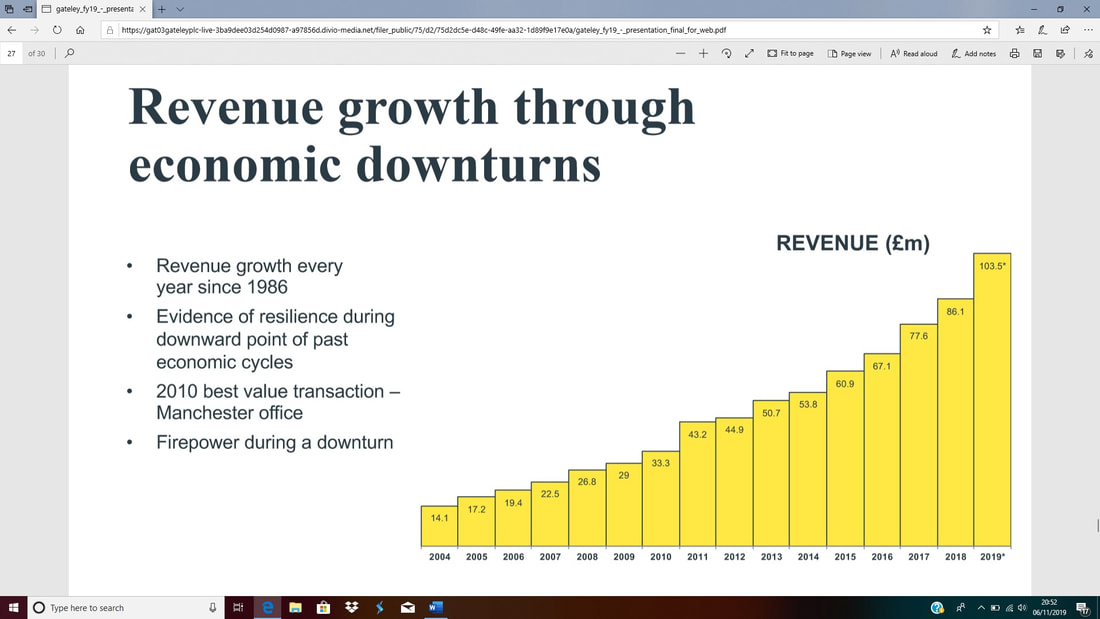
I don’t see GTLY as something that will rocket skywards and make me mega-rich overnight, but I do see it as a nice ‘steady Eddie’ which should give reasonable Capital upside and also provide a fairly generous Dividend Stream.
Regards, WD. P.S., as an added bonus I am not sure if I included this really useful Presentation in Part 1 and even if I did it won’t hurt to chuck a link in again !!! https://gat03gateleyplc-live-3ba9dee03d254d0987-a97856d.divio-media.net/filer_public/75/d2/75d2dc5e-d48c-49fe-aa32-1d89f9e17e0a/gateley_fy19_-_presentation_final_for_web.pdf
0 Comments
Leave a Reply. |

Stocks & Markets WheelieBlogsThese tend to be more Markets and Stocks related and timely - the Blog Page on the Main WheelieDealer Website has the 'Educational' stuff (well that's the theory anyway !!). Archives
October 2021
Categories
All
|
