

|
stocks & Markets blog |
|
Well, the way I am feeling today I certainly don’t feel like much progress is happening, but I need to see the bigger picture, after 9 months of not being right.
My action of going up to Stock Mandeville Hospital didn’t exactly cause a rapid reaction, but at least I have eventually received a report from my Consultant that tells me the pain would not be caused by my Spine, after the MRI Test yonks ago. It is good to rule something out (although I do intend to request a discussion with my Consultant about the Spine), but it means I need to get snotty with my GP Surgery and get something happening. I hope to be able to talk to them tomorrow, but getting a GP Appointment these days is harder than trying to make money with a Portfolio of crappy AIM Stocks.
Latest TPI Podcast
TPI 55 was released on Friday and, so far, the Listener numbers have been superb. This one covers loads of Stock ideas and if you hold HSBA and/or STAN you will be particularly interested I suspect. We have quite a discussion about what I see are the 2 key factors that drive Portfolio performance and as always, we ramble around loads of subjects and educational ideas and discuss how we see the Markets developing in coming months. If is well worth the FREE subscription, just for the Stock ideas !! (and no, we won’t be refunding any subs for dissatisfied Listeners !!) If you go to the ‘Conkers Corner’ Channel on all the major Platforms, then you should find the full archive of ‘Twin Petes Investing’ Podcasts there. You can find it on Soundcloud and Youtube at the links below: Soundcloud here: https://soundcloud.com/user-479955511/conkers3-wheeliedealer-55-concentrated-portfolios-investing-ftse-scs-afrn-ckn-ince-wosg YouTube here: https://www.youtube.com/watch?v=aur-uXCDqzQ WheelieBash 2021 The WheelieBash this year will take place on Saturday 4th September 2021 at The White Hart in Winkfield near Windsor as usual. I am allowed 60 peeps and we just have a few Slots left – so be quick if you wanna come. It is Free to attend and if you want to come then email me or DM me on Twitter or whatever. If you go to the relevant page on my Website (I think it is on WD2) then you can see all about WheelieBashes from previous years. This one will be the biggest ever and 60 is probably a sensible maximum before it all gets too unwieldly. It kicks off at 12.00 Noon and if you want food you need to order by 2pm. They do more food in the evening, so don’t worry, you are unlikely to die of starvation. You might get an aching face from smiling, especially after the grim time we have had in recent months, and your hand might ache from taking notes of all the great ideas you hear about. It is totally informal and everybody is welcome, come and go as suits you. All ages and experiences are always represented and it is an unmissable opportunity to meet other like-minded Investors and Traders. Last Week It ended up a very good week for me with my Portfolio adding 2.1% (on Exposure, the gain on ROCE would be higher due to leverage). There was a bit of weakness on Friday but my Portfolio is right up near its All Time High and of course I am very pleased. The Index Test System is finally in profit and was up about £185 when I looked on Friday evening. This is a gain of around 4% on the original Capital I stuck in (as per the Rules of the System) and I am extremely relieved after seeing it down 20% just a short time ago. The leverage of Spreadbets causes huge fast swings, so that is why a solid understanding and sensible approach to Risk Management is needed. The Rules are designed to cater for this. As I keep saying (listen to the new Podcast, TPI 55 and I am sure you will hear me say it), I am wary of the Autumn which is often a tricky period for Markets. I am at an usually high level of Cash and have about 6% of my Portfolio sat in Cash at the moment. I am in no particular rush to buy anything although I am stalking a Stock for my Income Portfolio, where I hope to be able to lock-in a juicy yield in a high quality and established Company with a strong track record. Digging under the Floorboards If you go to the ‘Blog Index List’ page on my Website WD2, then you can find the full list of all the Blogs I have scribbled since I started the WD silliness about 7 years ago. All the worthwhile and educational ones have links to them and there is a sort of Search facility, although I find that doesn’t work so well via my Android Fone. I seem to have had a lot of discussions about the difference between Price and Value recently, and that has triggered my brain to lob this blog in from back in July 2017 which addresses the topic. There is a link at the top to part 1: https://wheeliedealer.weebly.com/educational-blogs/price-vs-value-think-like-an-owner-part-2-of-2 Blog Slate It is more than a little frustrating that my health seems to have been going backwards again, but hopefully the new impetus I have injected into the NHS will make a recovery possible – although it might take a while. With this being the case, I am unlikely to be able to do any Educational Blogs for a while but I will try to do the Weekend ones (like this one !!). I managed to update the ‘Monthly Performance’ page for July and I am pleased to say my Portfolio squeezed out another monthly gain. I am also aware that there is loads of housekeeping and tidying up needed on both websites, but I won’t be able to address all that until I am fixed. With luck I can do that in the Winter along with a new venture that I have planned. Gold Composite All the Charts I show are taken from the excellent SharePad software I use and if you click on the images then they should get a bit bigger on your screen (I recommend you read these Blogs on a big screen rather than just a Fone – there is a lot of detail to be seen). I know some Readers actually look at their Charts on SharePad or whatever method they use as they read through my blogs. If you fancy using SharePad or ShareScope yourself, then you can get 1 month’s Free Data if you go to the ‘Subscribe’ page on their website and then select the Product you want, and then you should see a ‘Promo Code’ box and if you type ‘twinpetes’ into that box, then the discount will apply. You can also get this by clicking on the Adverts that are all over my websites. I get a small payment for introducing you, so thank you very much !! (it’s just a shame I can’t spend it on beer much at the moment…..) https://www.sharescope.co.uk/ I noticed also that SharePad/ShareScope have updated the landing page on their website and there is much better detail regarding the capabilities and features of their software now. In fact, Podcast TPI 50 contains a discussion with the Founder of SharePad/ShareScope, Martin Stamp. Highly recommended and of course you can find that one on the ‘Twin Petes Investing Podcast’ page on WD2. A mate flagged some technical developments on the Gold Chart so I wanted to have a nose and see what was going on. I don’t have exposure to Gold but it is fascinating; mainly because it is a classic example of a very crowded trade and seemingly everyone was a Bull on Gold when it was up at $2000. My mate pointed out a potential ‘Triple Bottom’ on the Chart and if you look at my Chart of the Weekly Candlesticks below for Gold Composite, then my Blue Line (Blue Arrow) is showing where 3 times the Gold Comp Price found Support. Last week this was at $1683. It is very possible that it tries to bounce off this Blue Line; but the catch is that Sloping Black Line (Black Arrow) which in combination with the Blue Line, is creating a Downwards Pointing Triangle which is squeezing the Price downwards. If the Blue Line fails, then it could drop down to the $1450 area. The Hammer Candle for last week which my Red Arrow is pointing at, suggests the Gold Price can move up for a bit. However, the key is that Black Line which is strong Resistance and Gold Bugs need the Price to breakout of this Black Line and that would probably mean a rise over $1916 (this happens to be just below my Black Arrow). 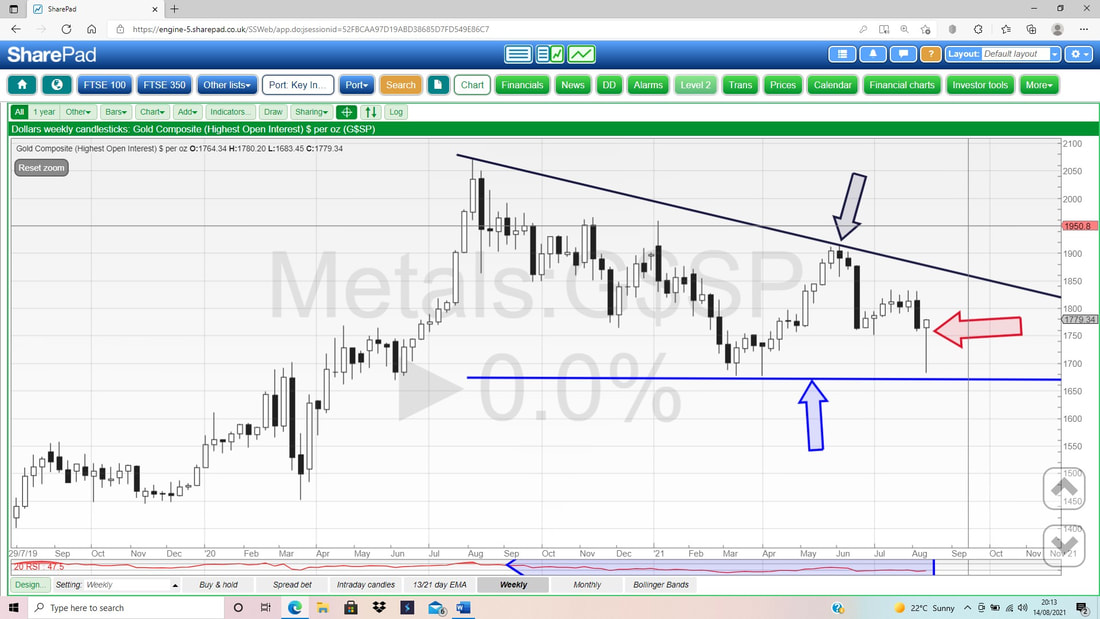
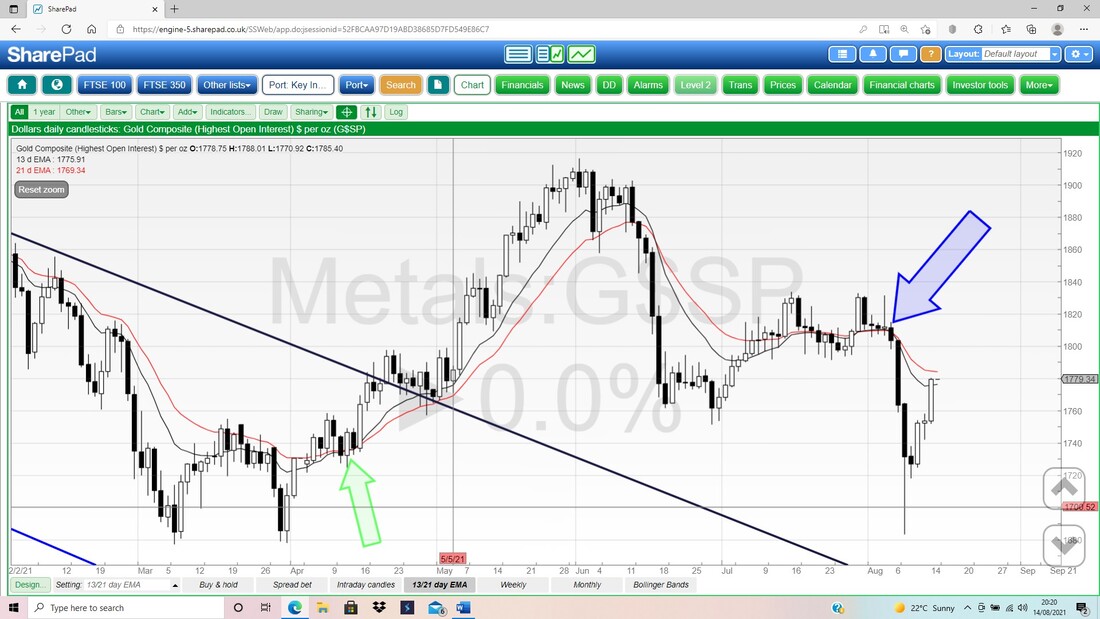
My next Chart has the Daily Candles for Gold Comp but what I am looking at here is the Black Wavy 13 Day EMA Line and the Red Wavy 21 Day EMA Line (Exponential Moving Average). My Blue Arrow is pointing at where the Bulls had the chance to trigger a ‘Bull Cross’ (where the Black 13 Day EMA crosses the Red 21 Day EMA from underneath), but they fluffed their opportunity and at the moment, this is still a Bearish condition with the Black 13 Day EMA below the Red 21 Day EMA.
In the bottom window of the Chart below, we have the RSI for Gold Comp Daily (Relative Strength Index). On a Reading of RSI 46 where my Black Arrow is, this is pretty much at the Neutral RSI 50 level. This means it is neither Overbought, nor Oversold. Therefore, if either the Bulls or the Bears decide to grab the ball and run hard, they could move it a long way to the extremes (RSI 30 is usually seen as Oversold, and RSI 70 is seen as Overbought).
By the way, look how the Peak at $2000 ish coincided with a big spike in the RSI – this was shouting at us that it was way overdone and everyone was far too excited. The RSIs are hugely helpful at spotting such situations, and it is extremely unwise to buy or go long on something when the RSI is way over 70. On the flipside, it is unwise to Sell or go Short, when something has an extremely low RSI. Along with my beloved 13/21 Day EMA Lines, the RSI is an essential indicator for me. 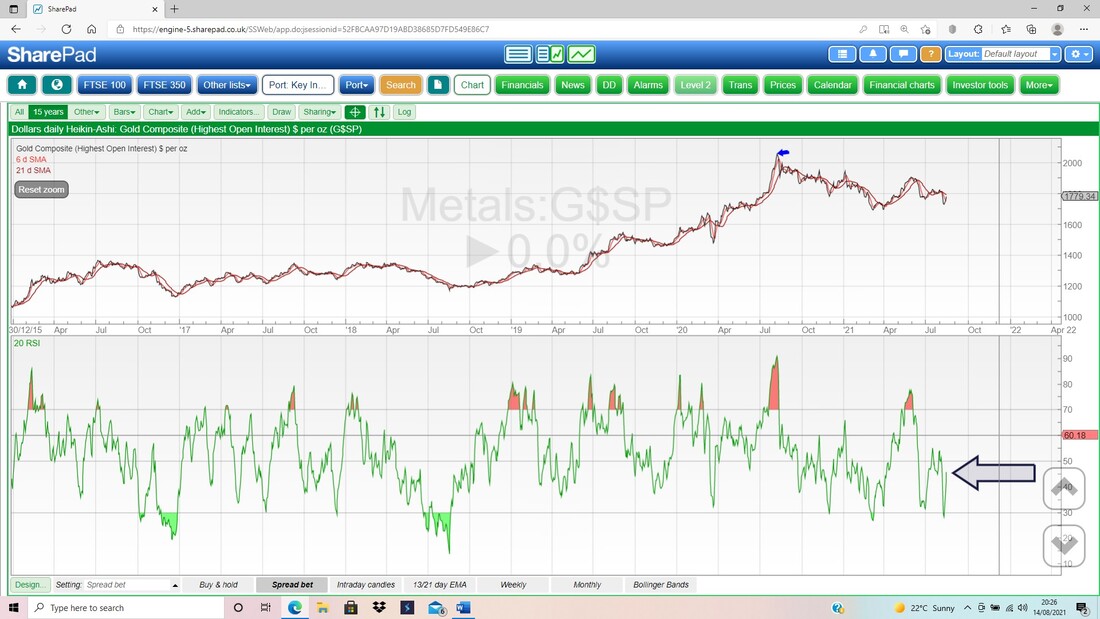
Last up on Gold Comp, we have the Daily Candles with the Pink Zone marking the Upper and Lower Bollinger Bands. My Blue Arrow is pointing to a big Up Candle from Friday and it is good for Bulls that it has got over the Red Bollinger Midpoint Line (Red Arrow), which can often be Resistance. However, it can overshoot so we may see a drop back early next week.
My Black Ellipse is highlighting a Zone of Resistance which runs from about $1791 to $1833. The Top Bollinger Band is at $1830 and this highlights a strong level of Resistance. 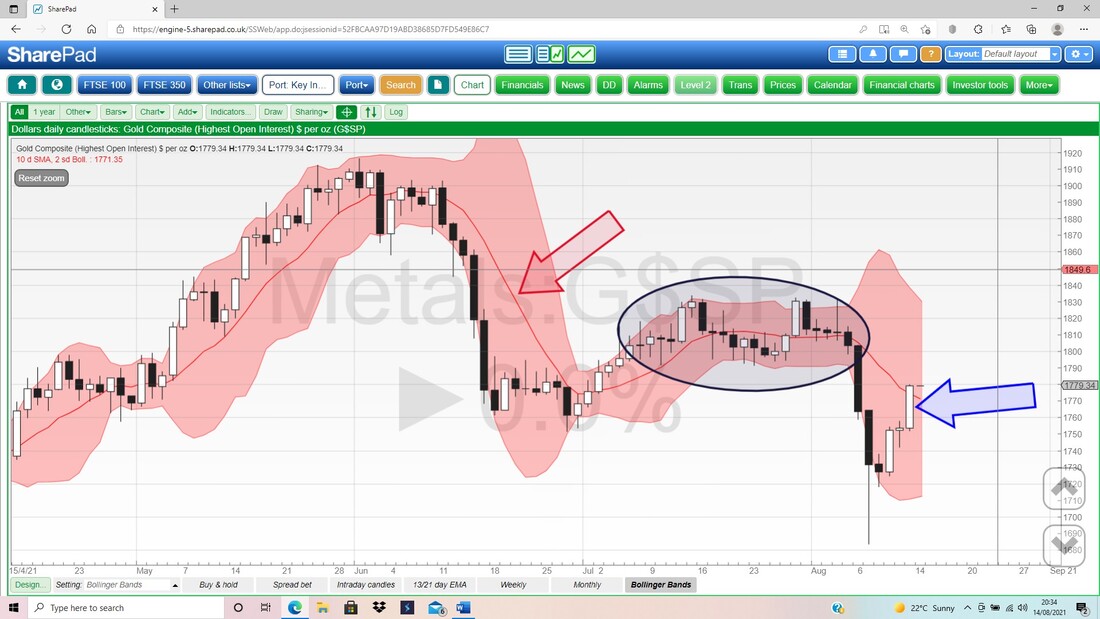
S&P500
The rise in the US Markets of late has been stunning, with seemingly every new day bringing new All Time Highs (ATHs). My worry is that with Autumn not far away, this extended ‘Melt-up’ on very low Summer Volumes, is setting things up a treat for a sizeable drop in the Autumn. Remember, when everyone is a Bull, who is left to buy? Mean Reversion (this is the concept that things move back to their average levels over time, if/when they drift away from such averages) is a highly powerful force in Markets, and just a quick look at any Chart of the S&P500, DOW, and Nasdaq will show the rise recently has been extremely steep and, at some point, all trends end. First up, the Weekly Candles for the S&P500. My Blue Arrow is pointing to a tiny Up Candle from last week and this is really a Doji. The danger here, is that this is not a huge sign of conviction by the Bulls, and even though they made a new ATH, there is likely no real commitment behind it (and the low Volumes back that up). My Red Ellipse is highlighting 2 Hammer shape Candles from some weeks ago, and these pinpoint Support at about 4056 and, of course, down near the 4000 level the psychological Support must be significant. Note how the Candles are still nicely within my Uptrend Channel, bounded by my Black Lines (my Black Arrow marks the bottom Support Line of the Channel). A good sign of trouble ahead will be if/when the S&P500 falls out of this Channel. 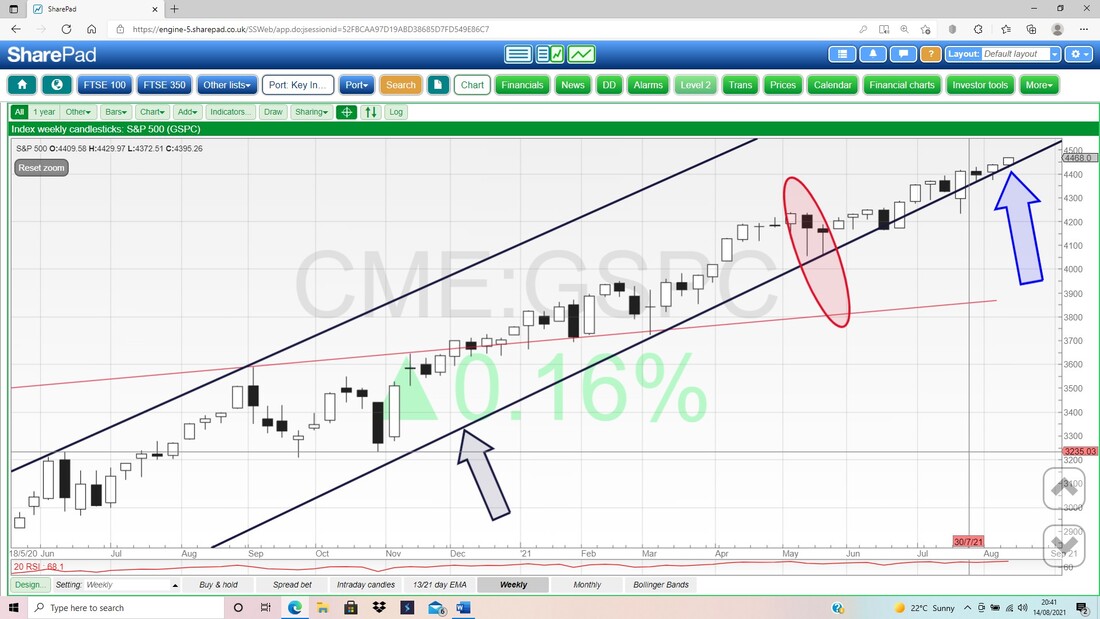
I won’t bother looking at the 13 and 21 Day EMA Lines, because when a Price Chart is making new All Time Highs, it is by definition going to have a Bullish setup on these excellent Signal Lines.
In the bottom window on my next Chart, we have the RSI for the S&P500 Daily. On a Reading of RSI 69 this is pretty much Overbought and its days are numbered. If you look to the left, you should see that the RSI has been quite a lot higher than RSI 69 in the not-too-distant past, but the upside potential is limited and again this would support the idea of a Pullback in the Autumn after an extended run up. 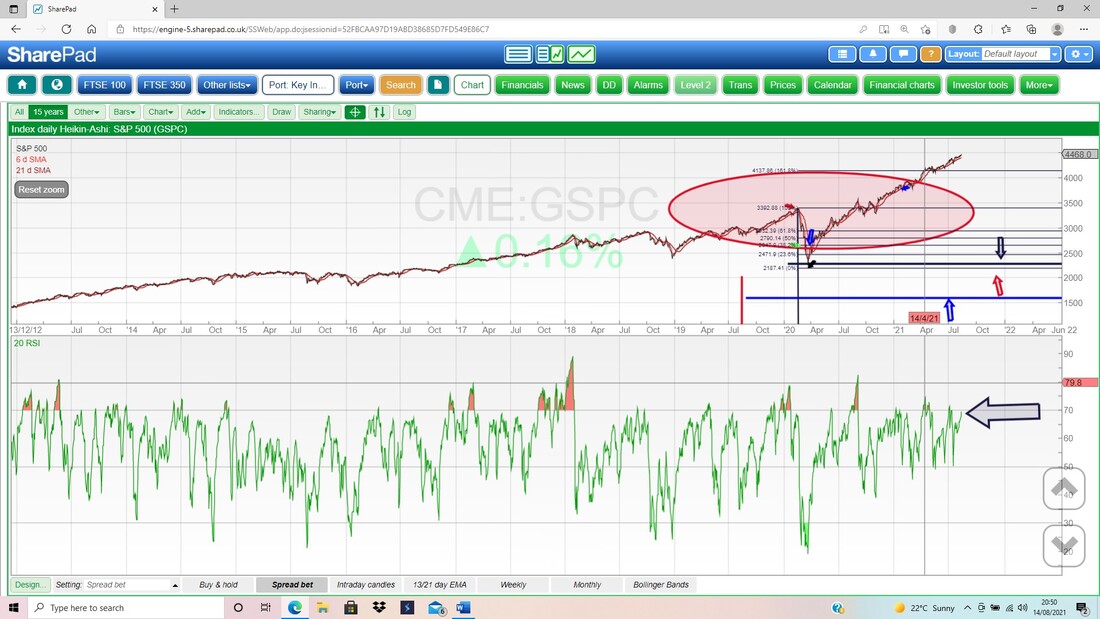
In the bottom window on my next Screen we have the RSI for the Weekly S&P500. This time we are up at RSI 70 where my Black Arrow is pointing; so we have the Daily and the Weekly RSIs Overbought. That also suggests a Pullback of some sort is likely.
However, extremely high RSI Readings can be unwound by sideways Consolidation moves. That might happen but my hunch is that a drop is more likely. Luckily for me, it is not something I need to worry about too much. I have a high Cash weighting by my usual standards, and I will be alert to Hedge as soon as I see a fall is on the way. 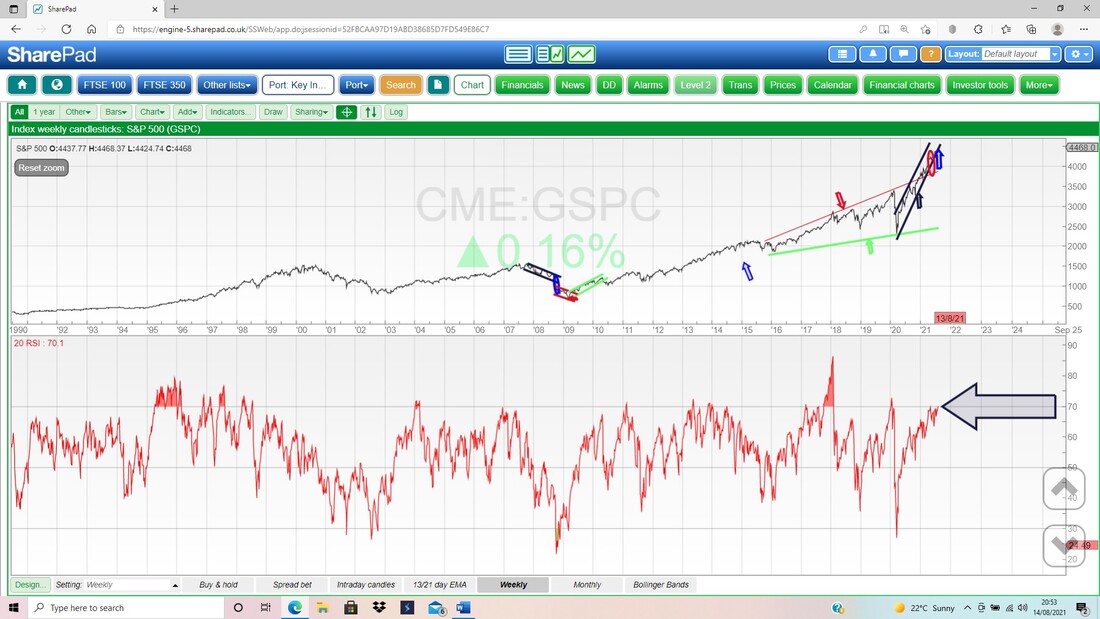
Finally for the S&P500, the Daily Candles with the Bollinger Bands. My Blue Arrow is pointing to a tiny Up Candle (a Doji) from Friday and if you look down in the lower window, my Black Arrow is pointing to very low Volume.
My Black Circle/Ellipse is highlighting Support down at 4233. The Top Bollinger Band is at about 4480 and there is a bit of room up to this from the Close on Friday. The Midpoint Line (Red Arrow) is at about 4433 and the Bottom Band at 4386. 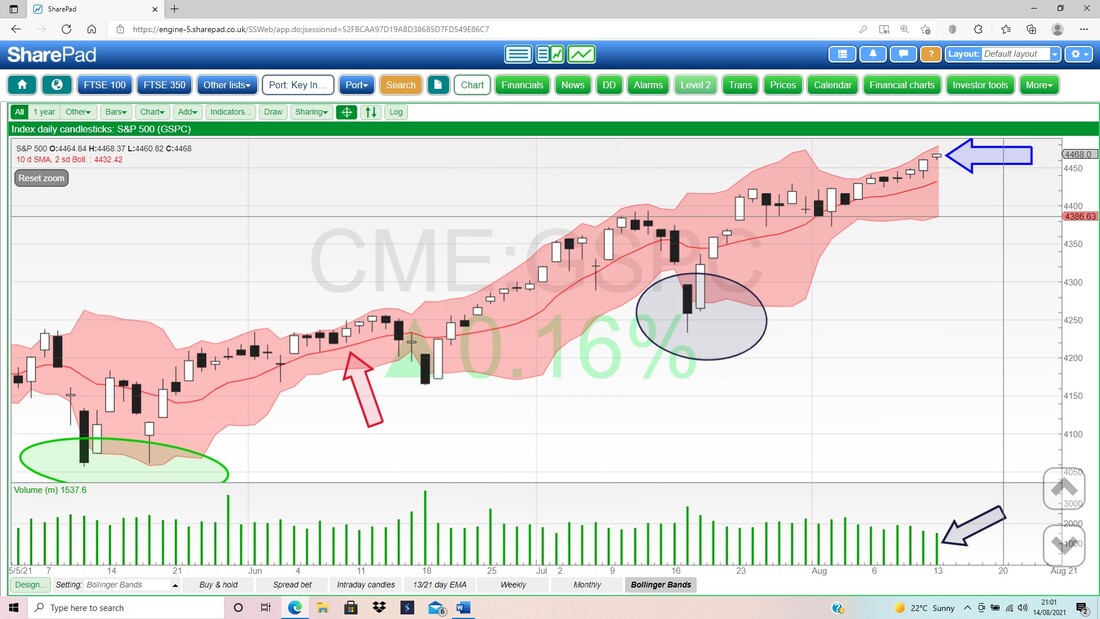
Brent Oil Comp
Firstly, the Weekly Candles. My Red Arrow is marking a ‘Long Tails Doji’ from last week and after the Big Black Down Candle from the previous week, this could be a Turning Point from which Brent Oil moves up. To the upside, there is Resistance at $75 and then $77.9. To the downside, there is good Support at $67.6 and then $66.9. Worst case, there is good Support down to $60. 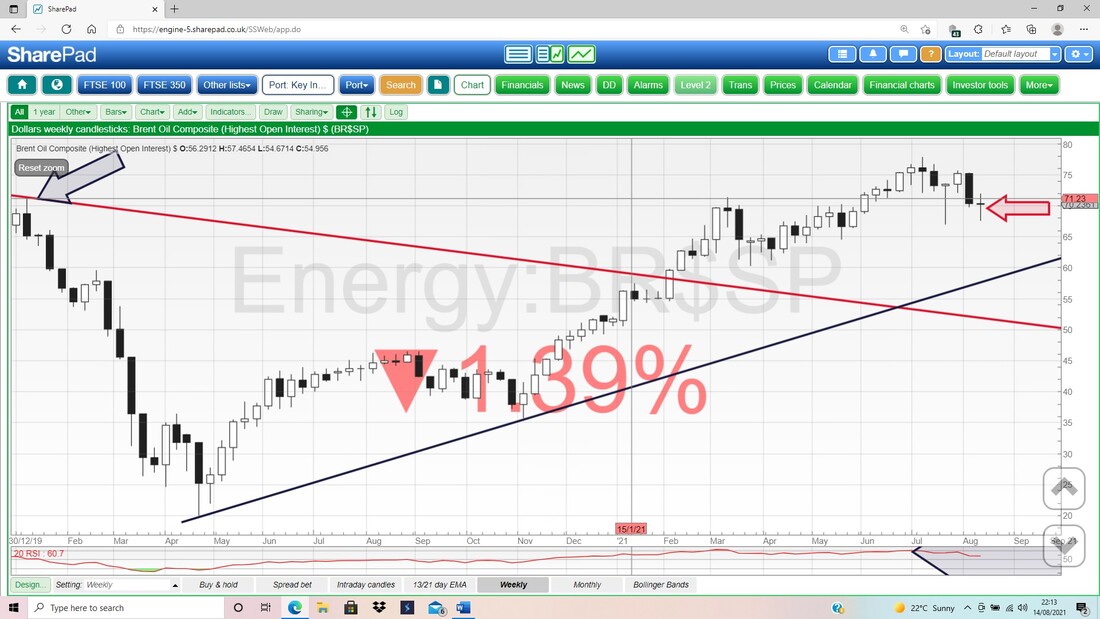
My Black Arrow on the next Chart is marking a ‘Bear Cross’ on the Brent Oil Comp Chart of the Daily Candles, and this means it is very much in Bear Mode.
An intriguing thought is that everyone is freaking out about Inflation, yet a weakening Oil Price would actually relieve some inflationary pressure. 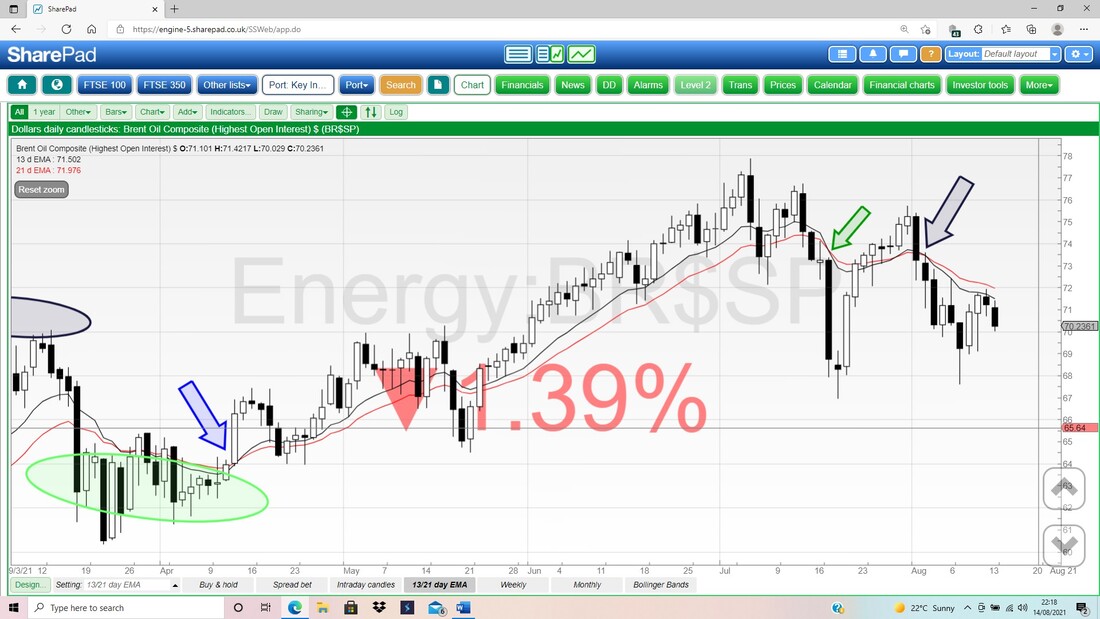
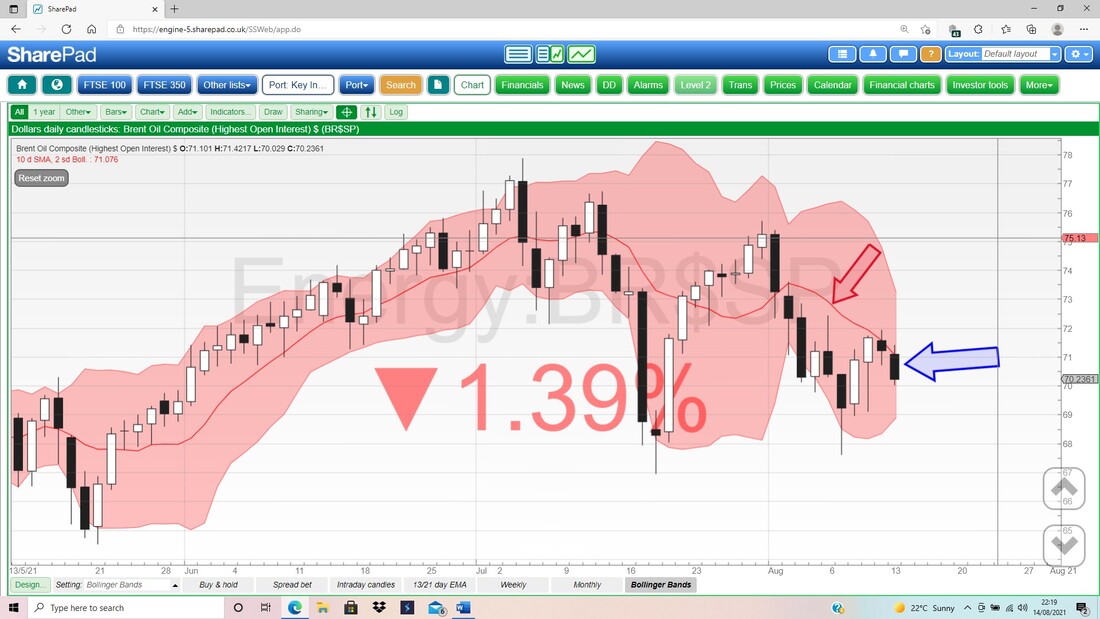
Last up for Brent Oil Comp, my Chart below has a Blue Arrow pointing to a Down Candle from Friday and note how the Candle from Thursday was a Doji and the Price has turned down off of this. Note also that it turned pretty much spot on the Bollinger Midpoint Line (Red Line, Red Arrow). That is technically pretty !!
FTSE100
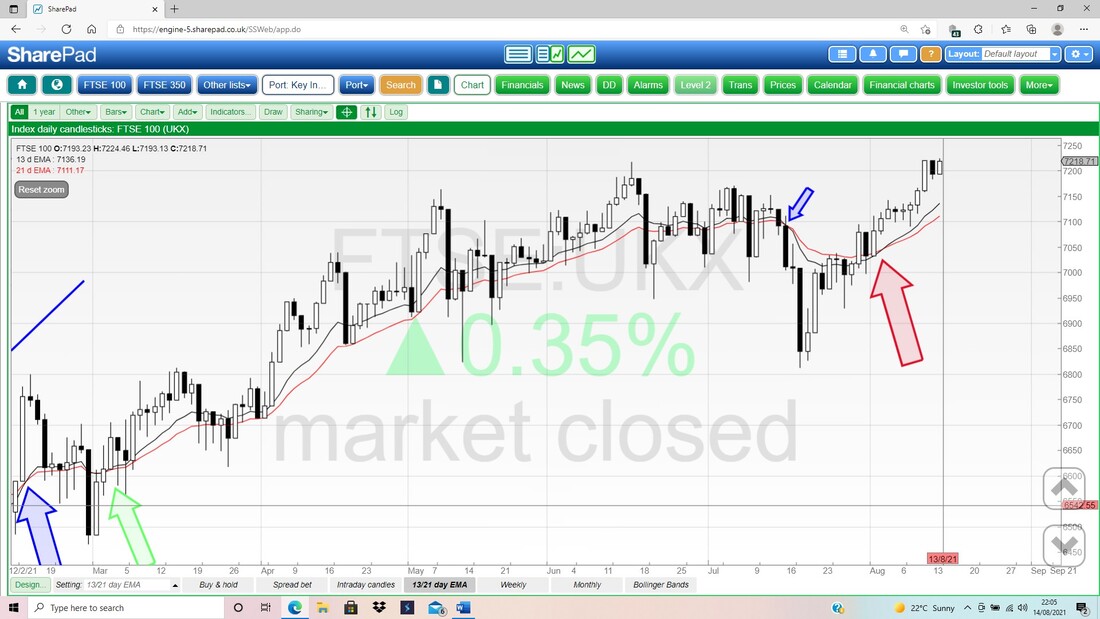
First up the Weekly Candles for the FTSE100. I am of course particularly interested in the FTSE100 Chart, not only because it dictates what Stocks in general are likely to do, but also because I have my Test System running which is trying out the Index Spreadbetting System that, along with a few friends, I have developed. My Blue Arrow is pointing to a nice Up Candle from Friday and the key thing here is that it broke-out of the previous Peak where my Green Ellipse is at 7217. On Friday it Closed at 7224. We need it to press on now. Up above, my Black Box in the Top Left-Hand Corner highlights a Zone of Resistance, and this runs from about 7300 to 7700. Note how the FTSE100 is moving inside the confines of my gradually sloping Uptrend Channel, marked by the Mauve/Purple Lines. Note also how the FTSE100 rose off the Hammer Candle (arguably a Dragonfly Doji, but it’s semantics really) from 4 weeks ago, and this brings in Support at 6813. 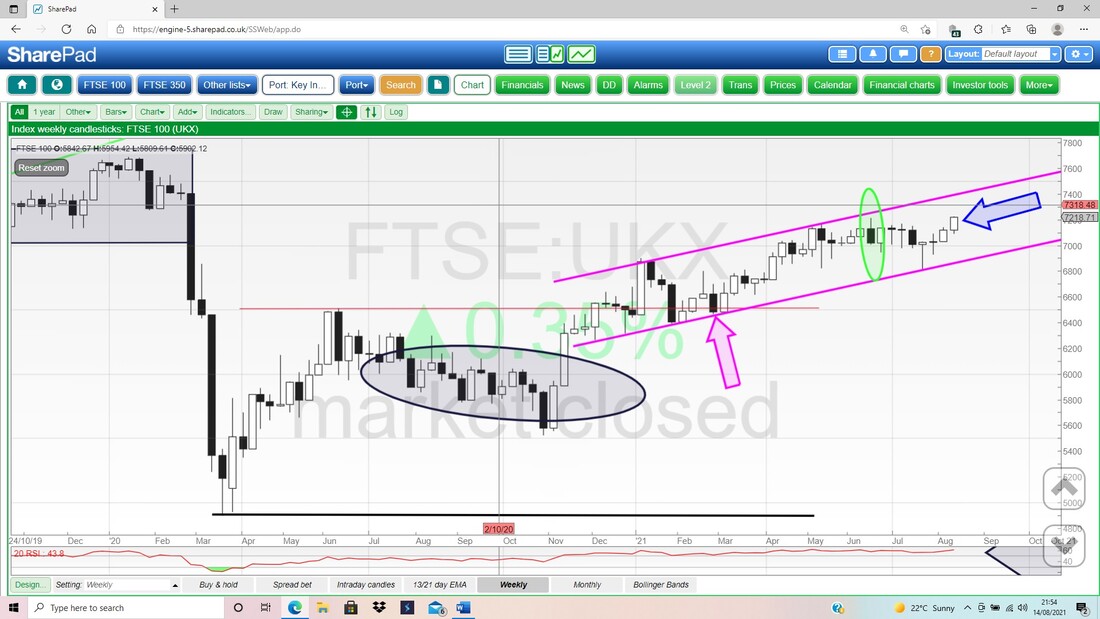
Next up I am focused on the 13 and 21 Day EMA Lines. We got a Bull Cross where my Red Arrow is and we are still in Bull Mode. Note how the Cross predicted the subsequent rise.
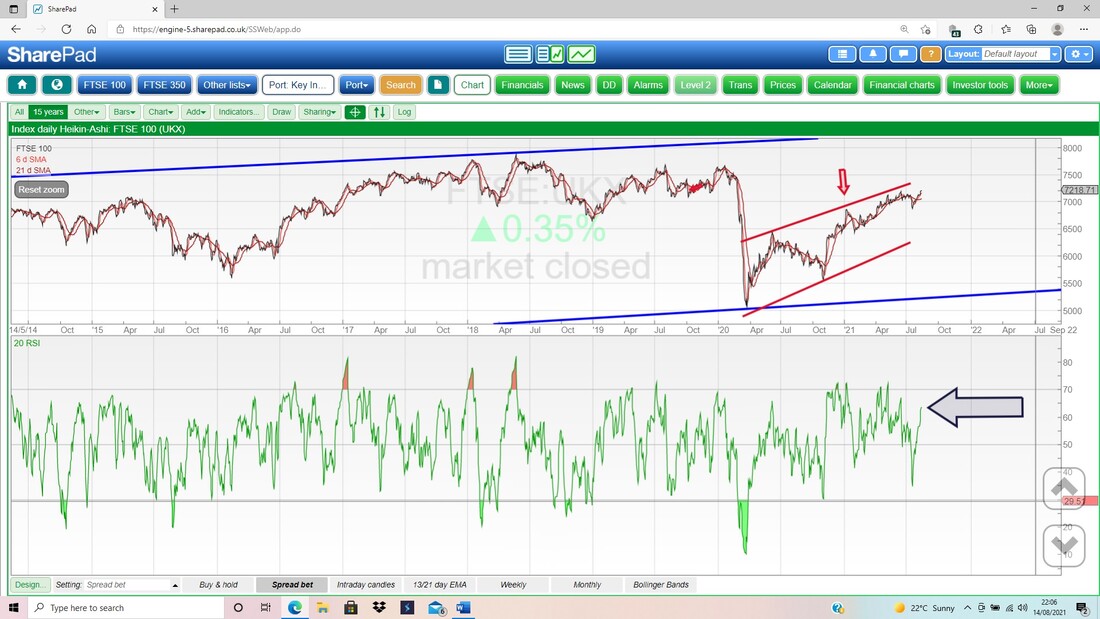
In the bottom window below, we have the RSI for the Daily FTSE100. On a Reading of RSI 64 this is getting on the high side, but can go quite a bit higher yet. If my concerns about the Autumn are right, we might just eke a little more upside out before some sort of wobble.
Last up tonight we have the Daily FTSE100 Candles with the Pink Zone showing the Bollinger Bands. My Black Arrow is pointing to a small Up Candle from Friday and note how since Wednesday, when the FTSE100 jumped up a lot, it has gone sideways and moved away from the Top Bollinger Band. This could be a Consolidation move before the next leg up. Note the big move on Wednesday had miniscule volume (the Green Histogram Bars at the bottom – ignore my Arrow).
The Top Band is at 7242, with the Midpoint Line (Red Line) at 7150 and there is decent Support at 7100 and just below. OK, that’s it for this week. I hope the Market Gods look after you and we get some decent weather before this fabled Autumn gets upon us !! Cheers, WD. 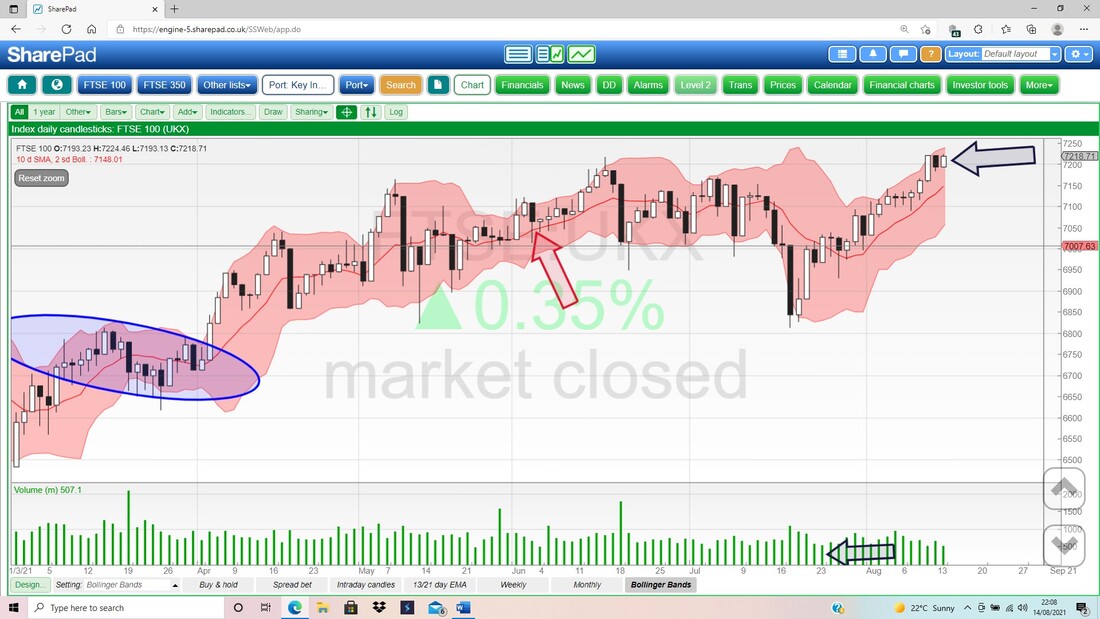
0 Comments
Leave a Reply. |

Stocks & Markets WheelieBlogsThese tend to be more Markets and Stocks related and timely - the Blog Page on the Main WheelieDealer Website has the 'Educational' stuff (well that's the theory anyway !!). Archives
October 2021
Categories
All
|
