

|
stocks & Markets blog |
|
After a super strong start to the year, we had to give a bit back last week and have a bit of a pause. As I discussed in last weekend’s blog, this is healthy really if we are to see Markets keep rising, and in the event it hasn’t been much of a pullback. If anything, I would guess we need more consolidation before we can see more moves higher (assuming that will happen but of course Summers are often quite flat). Consolidation can just mean a sideways grind and I suspect that is pretty much what we will get.
The situation around the globe seems quite mixed with the US and UK recovering strongly from the C19 induced Recessions and with Europe still seeming to recover, but facing lots more trouble with C19 Lockdowns and further waves of infection. The UK seems in very good shape and there was some excellent news on Friday about how the AstraZeneca and Pfizer Vaccines have both been found to be highly effective at not just protecting people from severe illness, but also helping to prevent infection to a high degree. Of course the US is most likely to undergo vast amounts more ‘Stimulus’ that is likely to keep the Punch Bowl well and truly booze-fueled.
Hopefully the UK will be following the same path as that which Israel is benefitting from, where their rapid progress with vaccinations means that the Population are now almost back to normal and are able to socialize just like the good old days. There is of course fear around the possibility of importing ‘Variants of Concern’ from some of the C19 hotspots and I wish I could be confident that the Government really has a grip on Quarantine etc. but I have considerable doubts about this. I just need to look out of my window to see the continuous stream of Planes coming into Heathrow and this is noticeably the highest number I have seen since the Pandemic began.
Gotta feel for the people in India though; that situation is terrible and looks like it could be even worse than the way C19 battered Brazil. Let’s all hope the wave soon passes and the unprepared and unprotected people are saved from much more of it. For me personally though, there was a big step forwards when I managed to visit The White Hart and meet with an old mate from my Fujitsu days in the glorious sunshine in the garden. It almost feels like some normality is returning and I look forward to many more similarly pleasant afternoons. Of course, the icing on the cake will be if I can get something happening with regards to Stoke Mandeville Hospital, and get them to make me feel like I should be, because it is starting to really grate on me now. Fingers crossed there should be some progress on this in the coming week. Podcast TPI 47 This is the most recent Podcast and as promised I cover quite a bit with regards to how I go about doing Spreadbets. I expect to discuss this more in coming episodes and hopefully this should give you a good understanding of my technique, which provides strong returns, yet with controlled Risk and with low levels of activity. You can hear it on Soundcloud here: https://soundcloud.com/user-479955511/conkers3-wheeliedealer-47-amzn-aapl-tsla-sfor-crda-acrl-polr-spreadbetting-aqx-wpp-tmg And you can hear it on YouTube here: https://www.youtube.com/watch?v=0DJ7Ansp4pc&t=4s If you want to know more and can’t wait for us to cover it in future Episodes, then if you go to last weekend’s blog I have included a Link in there to a long Series of Blogs I wrote about Spreadbetting. As always you can find the ‘Twin Petes Investing’ Podcasts on pretty much all the big platforms, and you will find them at the ‘Conkers Corner’ channel on the likes of Apple, Audioboom, Spotify, YouTube, Overcast, Google+ and probably a few others. You can shout at that Alexa thing as well to find it. You can also go to the ‘Twin Petes Investing Podcast’ page on my Website WD2 and there are all the details there and these sort of nifty ‘widget’ things which allow you to play the Podcasts directly from my Website page. TPI 47 isn’t up on there yet but hopefully it will appear in the next few days. Last Week Sadly my Portfolio went backwards last week with a drop of 1%, but in light of the strong moves up in recent weeks, this isn’t all that bad. I am hoping any further damage will be light although the coming week is the last days of April and all 3 of the previous months of 2021 have ended with poor last weeks. I think something that didn’t help my Portfolio last week was a lack of news on my Stocks and I think this will continue in the coming week. Of course, this is a 2-edged sword because news on one of our Stocks can be bad as well as good – but recently most companies have been putting out positive news as the Economy recovers, and that has helped to drive prices higher. My Strategy is unchanged. I am doing very little except for monitoring what I have and keeping a close tab on my Spreadbet Long Exposure so it doesn’t get out of hand. I am trying to build my Cash reserves and I managed to take some more out of my Spreadbet Account a few days ago, but I want more Cash so I am more ‘buffered’ against trouble. Blog Slate Other than adding a load more Stock Ideas that need further research and analysis to the ‘Little Black Book’ page, I have not managed to do much else with my ongoing health travails. I am not getting anywhere with the LOK blog and it is extremely frustrating, but I can only do what my health allows. From previous periods of hiatus All the blogs I have written over recent years can be found on the ‘Blog Index List’ page on WD2. All the educational ones have Links and after a certain point in time on the list, all blogs have Links. From that list I bring you this old one which might be worth a look through: https://wheeliedealer.weebly.com/educational-blogs/wheeling-through-the-ipo-minefield It’s quite ‘funny’ in a totally unfunny way, because a few of my ‘predictions’ in that blog turned out to be completely wrong !!! Brent Oil Composite All the Charts I show are taken from the excellent SharePad software I use and if you click on the images then they should get a bit bigger on your screen (I recommend you read these Blogs on a big screen rather than just a Fone – there is a lot of detail to be seen). If you fancy using SharePad or ShareScope yourself, then you can get 1 month’s Free Data if you go to the ‘Subscribe’ page on their website and then select the Product you want, and then you should see a ‘Promo Code’ box and if you type ‘twinpetes’ into that box, then the discount will apply. You can also get this by clicking on the Adverts that are all over my websites. I get a small payment for introducing you, so thank you very much !! https://www.sharescope.co.uk/ I noticed also that SharePad/ShareScope have updated the landing page on their website and there is much better detail regarding the capabilities and features of their software now. The Chart below has the Daily Candlesticks for Brent Oil Comp and first up look at my Black Arrow which is pointing to a ‘Bull Cross’ between the Black 13 Day EMA Line (Exponential Moving Average) and the Red 21 Day EMA Line. This Bull Cross is still ‘in force’ and whilst that is the situation, Bulls are most favoured and Bears may well get very sore heads. My Red Arrow is pointing to where we had a bit of a Peak about a week ago and this was at $67.4. After that it fell back and on Thursday it dipped down to $64 and then rose a little on Friday. To the downside, my Green Ellipse is marking a Zone of Support down to about $60.3 and to the upside, it needs to take out the Peak where my Red Arrow is and then my Black Ellipse is showing where the next Resistance Zone is, which takes us up to $70 and then $71.4. At the moment this could well just be consolidating sideways. 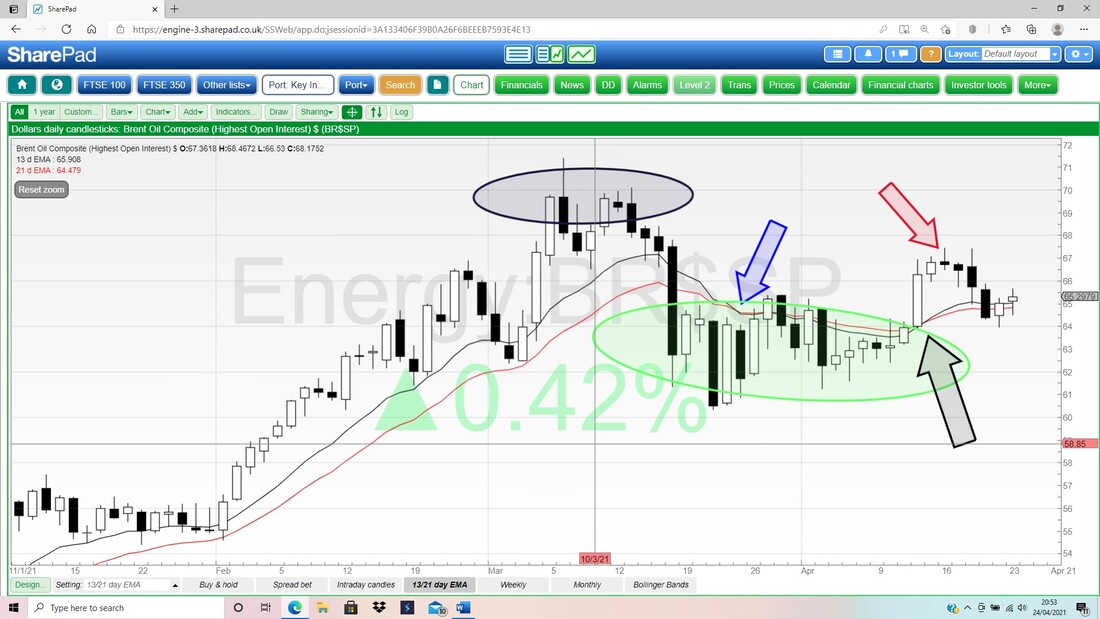
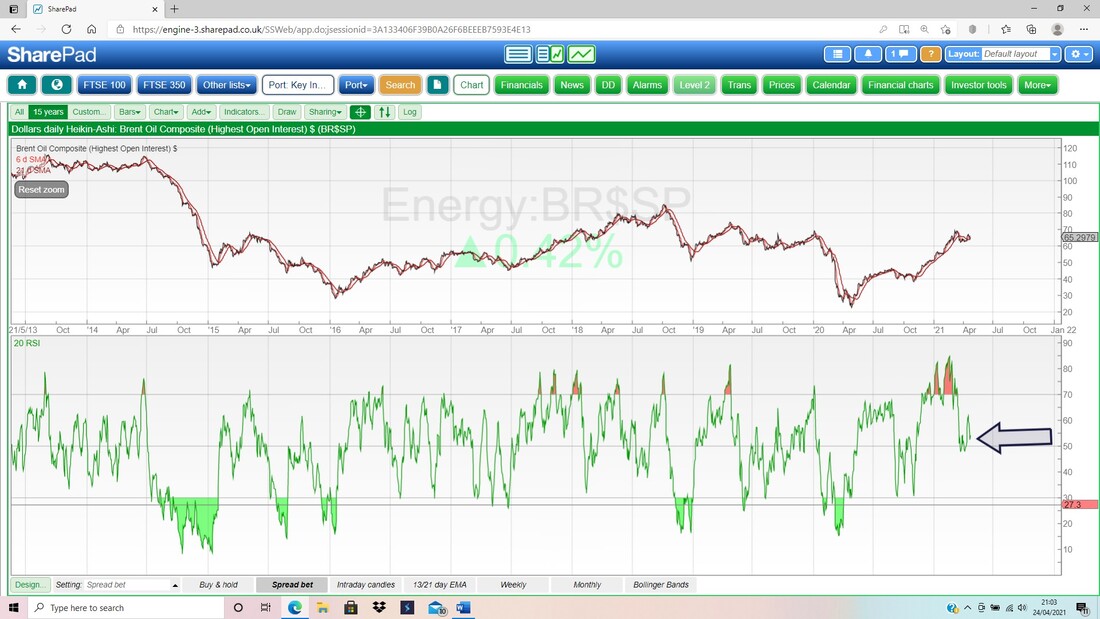
In support of the idea that Brent Oil Comp could be just grinding sideways for a bit, my Black Arrow in the bottom window of the Screen below is pointing to a Reading of RSI 54 which is pretty much Neutral; i.e. not Overbought nor Oversold. RSI is the Relative Strength Index and gives the sense of the ‘force’ of a move or the speed of it.
Gold Composite
I noticed during the week that Gold was looking a bit more perky, so it could be interesting to look at it now. Well, it doesn’t look as promising for Gold Bulls as I thought it might. The dominant feature on my Chart of the Daily Candlesticks for Gold Comp below is that Downtrend Channel marked by my Black Line (Black Arrow) at the top and my Blue Line at the bottom. Back where my Green Ellipse is, we had a Breakout of the Downtrend Channel but that failed and the Price fell back. Last week we had another Breakout where my Blue Ellipse is, and unless this can Breakout over $1800 ASAP, then this could easily drop back into the Downtrend Channel. My Green Arrow is pointing at a ‘Bull Cross’ between the Black 13 Day EMA Line and the Red 21 Day EMA Line and this needs to stay Bullish or the Bears will be back in town. The Low on Tuesday 20th April was $1764, and if Gold Comp drops below this Support again, then hopes of the Bulls will probably be dashed again. With the recent history of Gold Comp, I would say the probability of a False Breakout is pretty high. 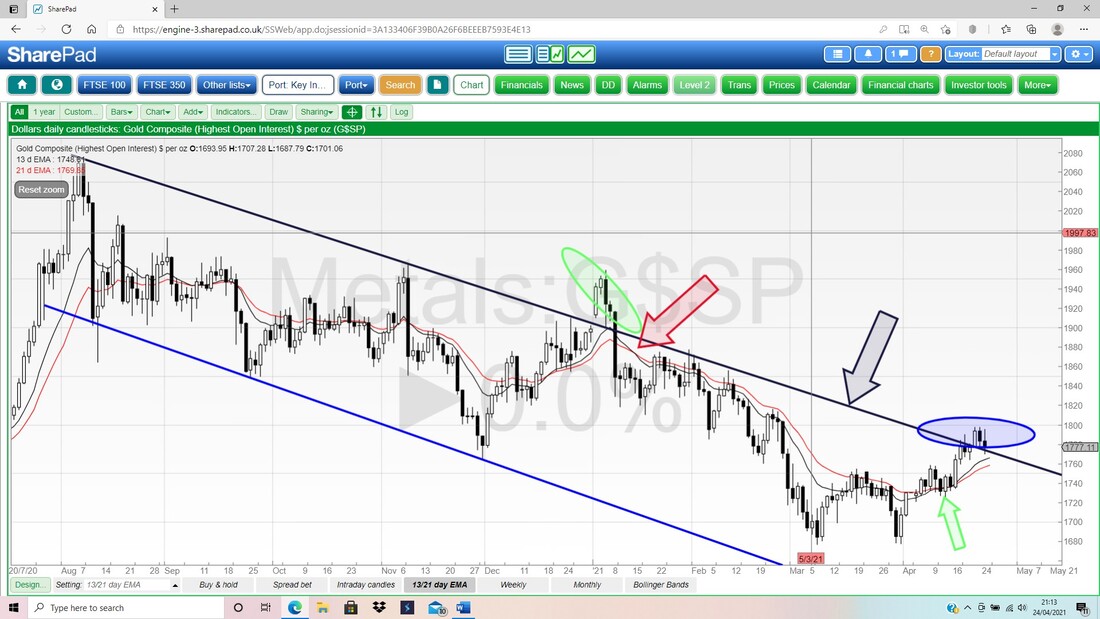
Next we have the Weekly Candles for Gold Comp. My Blue Arrow is pointing to a Hammer Candle from a few weeks ago and note how the Gold Comp Price rose after this. However, my Red Arrow is pointing to a ‘Star’ Doji from last week and the Gold Comp Price could easily turn down off this. It is not guaranteed, but Doji Stars like this are often turning points.
The easy ‘test’ is whether or not Gold Comp can get over Resistance at $1800. 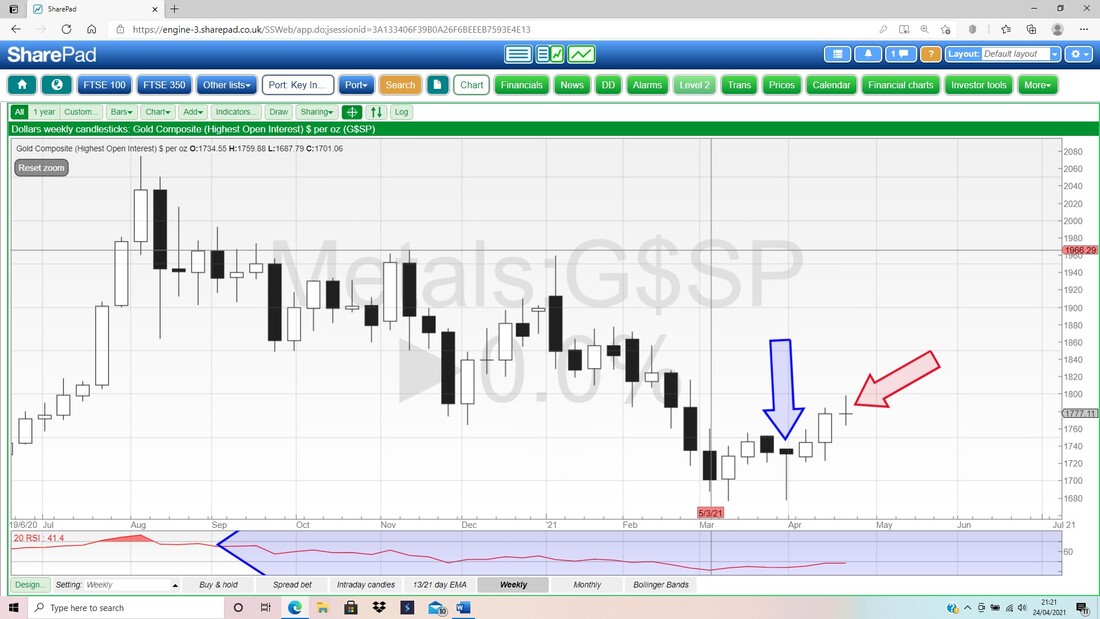
FTSE100
First up we have the Weekly Candles for the FTSE100. My Blue Arrow is pointing to a Down Candle from last week and this really wiggled around inside the Candle from the week before. To the downside, there is Support at 6800, 6600, 6400 and down where my Black Ellipse is. To the upside, the FTSE100 needs to get over 7037 and then we are looking at a Zone of Resistance where my Black Box is in the Top Left Hand Corner of the Chart. This runs from 7000 up to 7727 and ultimately on to the All Time High at 7903. 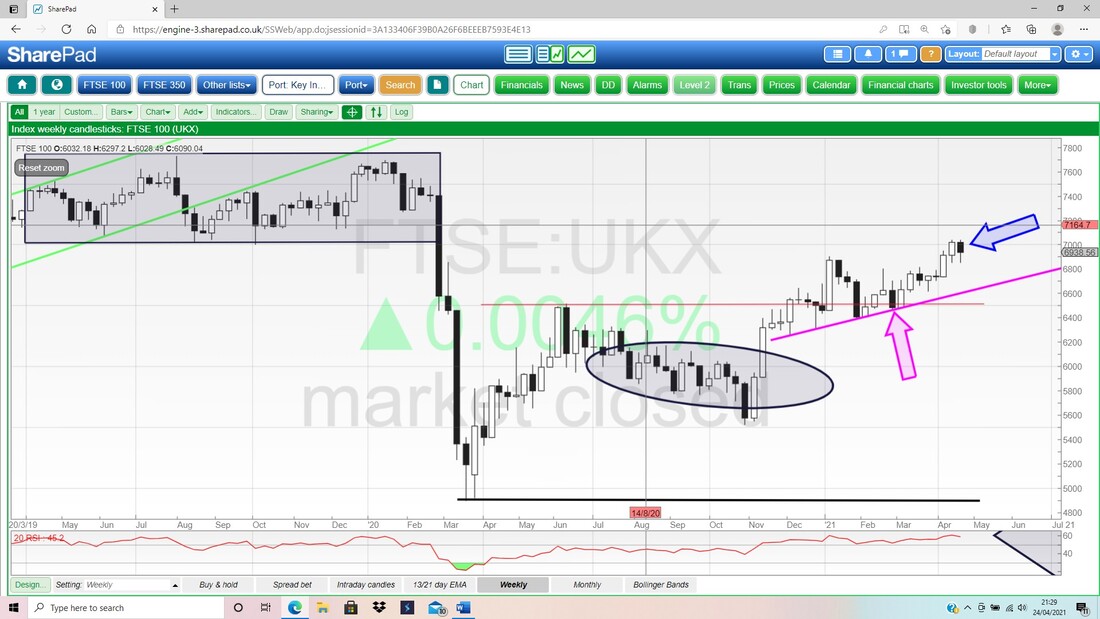
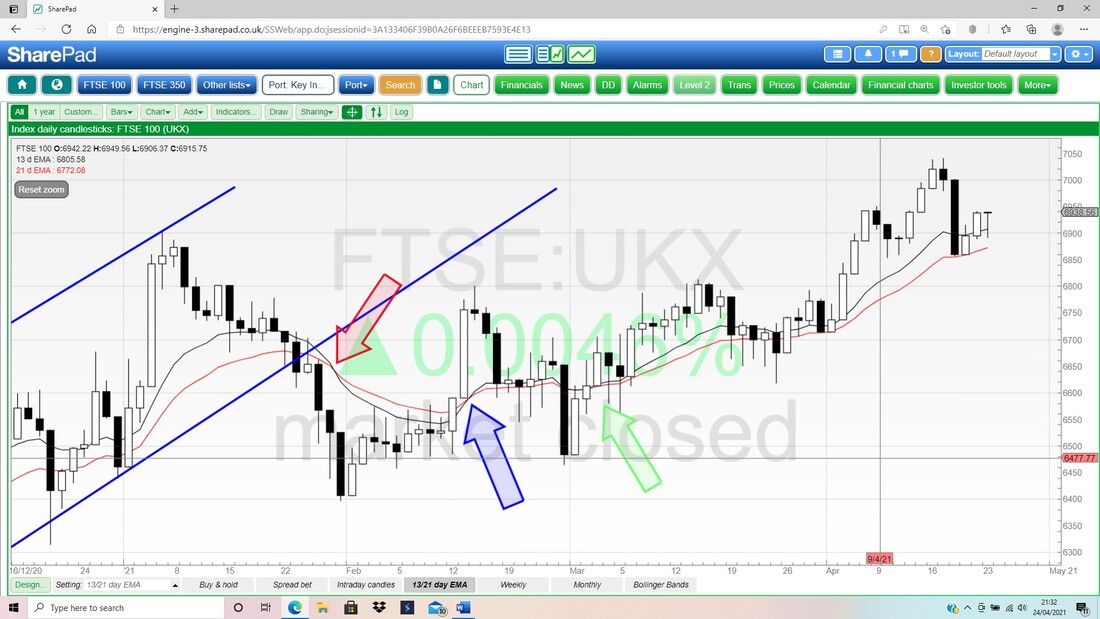
My next Chart is messy and just has the Daily Candles for the FTSE100 but my focus is on the Blue Arrow which marks a ‘Bull Cross’ between the Black 13 Day EMA Line and the Red 21 Day EMA Line and this is still ‘in force’.
Finally for the FTSE100 we have the Daily Candlesticks with the Pink Zone marking the Upper and Lower Bollinger Bands. My Blue Arrow is pointing to an almost invisible ‘T’ shaped Candle from Friday where the FTSE100 Opened and then fell back during the day, only to Close pretty much where it Opened.
After rising on Wednesday and Thursday after a big drop on Tuesday, the Price Action on Friday could suggest that Bulls are pretty weak here. The test again will be to see if it can get over about 6950 and start pushing up. The Bottom Bollinger Band is at 6835 and if we see some weakness next week, it will be interesting to see if this Level holds as Support. 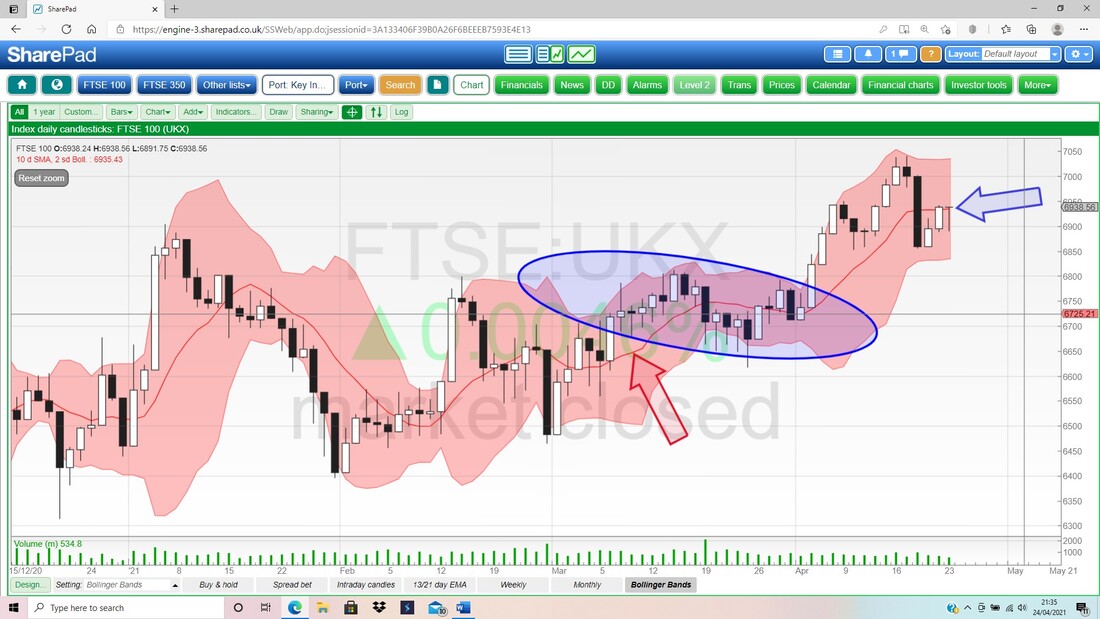
I wrote all of the text above on Saturday night but unfortunately now on Sunday my health is really giving me a bad day. I will end this here although it is disappointing I have not been able to look properly at the US Indexes. However, from a quick glance they are up near their All Time Highs and I see little of concern here except that we still have this high level of exuberance and it would be good to unwind that a bit. As usual I will most likely be commenting about the Indexes on Twitter in coming evenings.
Good Luck for the coming final week of April, Cheers, WD.
0 Comments
Leave a Reply. |

Stocks & Markets WheelieBlogsThese tend to be more Markets and Stocks related and timely - the Blog Page on the Main WheelieDealer Website has the 'Educational' stuff (well that's the theory anyway !!). Archives
October 2021
Categories
All
|
