

|
stocks & Markets blog |
|
What a strange week we just had. Markets were whacked hard on Monday but by Friday had recovered a lot of the damage and the US Markets even romped on to New All Time Highs. Quite crazy but I guess low summer volumes result in a high degree of illiquidity and this was borne out in the silly gyrations.
It is nice to have some decent weather but I am typing this bit on Sunday afternoon and it is pretty overcast and almost chilly today. Hopefully that will turn again next week and we can all get soaking up some sun again.
It was nice to be able to get out and about in the MX5 with the roof down and the Aircon blasting away (yeah, I now, not very ‘green’). I even had a lovely trip to the pub on Friday and caught up with a few mates I have met through doing the whole WD thing – it is still quite astonishing to me how many great people I have been able to meet through deciding to do this madness !!
Come join us at the WheelieBash on Saturday 4th September and you too will have the opportunity to meet up with some very familiar and well-known names from Twitter – some details are further down in this blog and there are a few spaces left. Latest TPI Podcast We will be recording TPI 54 this coming week, but you can catch the most recent, TPI 53 at the links below. TPI 53 covers all the usual stuff with an overview of the markets, some discussion about how we find good stocks and how we run our portfolios, and it ends as always with loads of quality Stock ideas. If is well worth the FREE subscription, just for the Stock ideas !! (and no, we won’t be refunding any subs for dissatisfied Listeners !!) If you go to the ‘Conkers Corner’ Channel on all the major Platforms, then you should find the full archive of ‘Twin Petes Investing’ Podcasts there and on the ‘Twin Petes Investing Podcast’ page on my Website WD2, you can play it directly from there. Soundcloud here: https://soundcloud.com/user-479955511 YouTube here: https://www.youtube.com/watch?v=gtQoNVymqLk WheelieBash 2021 We have determined that The WheelieBash this year will take place on Saturday 4th September 2021 at The White Hart in Winkfield near Windsor as usual. I am allowed 60 peeps and we just have a few Slots left – so be quick if you wanna come. It is Free to attend and if you want to come then email me or DM me on Twitter or whatever. If you go to the relevant page on my Website (I think it is on WD2) then you can see all about WheelieBashes from previous years. It kicks off at 12.00 Noon and if you want food you need to order by 2pm. They do more food in the evening, so don’t worry, you are unlikely to die of starvation. You might get an aching face from smiling, especially after the grim time we have had in recent months, and your hand might ache from taking notes of all the great ideas you hear about. It is totally informal and everybody is welcome, come and go as suits you. All ages and experiences are always represented and it is an unmissable opportunity to meet other like-minded Investors and Traders. Last Week What a rough week that was. I got really spanked on Monday but thankfully through the rest of the week my Portfolio gathered some daily gains and after a really strong Friday, I ended up down 0.4% for the week. That is a decent recovery, and from looking at the Charts (those are coming later in this blog – be patient for heaven’s sake), I suspect we will see more recovery in the coming week, although there are some signs of concern such as the Bearish signals coming from the 13/21 Day EMA Crosses on the FTSE100. Anyway, this time of year with Autumn not far off, I think it pays to be cautious and I am pretty much fully Long although I did reduce some Leveraged Spreadbet Positions recently as you can see on my ‘Trades’ page on WD1. So my Strategy is really to keep a watch and be ready to Hedge with Index Shorts if need be, and if I see any Positions getting too big, then I will be slicing them back a little. If we do get an Autumn drop, that could be an excellent time to be buying. The Index Spreadbet Test System had a torrid time and was down 20% on the Capital Used at the worst point, but it has recovered well and it is probably down about 12% as we speak. The speed of the degree of change in the percentages is purely down to the Leverage, and that is why it is vital to understand what you are doing when using Spreadbets and Leverage. In other words, at the worst point, a 4% drop on the FTSE100 was translated into a 20% fall in my ROCE on the Test System. Blog Slate With my health seemingly on the way to being ‘fixed’, I am hoping I can start writing ‘Educational’ Blogs again and I have loads I want to create. However, this is unlikely to happen for a few weeks at the earliest, but at least I am committed to making sure Weekend Blogs (like what you are reading now) do become their usual regular thing. However, I am also trying to get out and about and to meet up with loads of mates and suchlike now that I am feeling more up to it – so that will no doubt munch up a lot of my time. Another chewer of my time is all the jobs I have been putting off because I have been unable to get out and sort them. One I must crack on with is getting a new Wheelchair – but that always takes a huge amount of time and getting my Voucher out of the Healthcare Services is never a quick process. I also am thinking about another new way of getting information over to Readers/Listeners etc., although I am not certain I will do it and I am unlikely to start before the winter arrives. From previous Plague Times If you go to the page on WD2 marked ‘Blog Index List’, this has the full archive with most of useful stuff linked, to all the Blogs I have written over the last 7 or so years. From that list I bring you this old rabid dog (it’s in 3 parts so I have put in links to each one). The Number of Stocks you hold is an important topic which I intend to raise in an upcoming Podcast soon. I have included these so you are primed and ready !! https://wheeliedealer.weebly.com/educational-blogs/diversification-am-i-enjoying-too-much-of-a-good-thing-part-1-of-3 https://wheeliedealer.weebly.com/educational-blogs/diversification-am-i-enjoying-too-much-of-a-good-thing-part-2-of-3 https://wheeliedealer.weebly.com/educational-blogs/diversification-am-i-enjoying-too-much-of-a-good-thing-part-3-of-3 S&P500 All the Charts I show are taken from the excellent SharePad software I use and if you click on the images then they should get a bit bigger on your screen (I recommend you read these Blogs on a big screen rather than just a Fone – there is a lot of detail to be seen). I know some Readers actually look at their Charts on SharePad or whatever method they use as they read through my blogs. If you fancy using SharePad or ShareScope yourself, then you can get 1 month’s Free Data if you go to the ‘Subscribe’ page on their website and then select the Product you want, and then you should see a ‘Promo Code’ box and if you type ‘twinpetes’ into that box, then the discount will apply. You can also get this by clicking on the Adverts that are all over my websites. I get a small payment for introducing you, so thank you very much !! (it’s just a shame I can’t spend it on beer much at the moment…..) https://www.sharescope.co.uk/ I noticed also that SharePad/ShareScope have updated the landing page on their website and there is much better detail regarding the capabilities and features of their software now. In fact, Podcast TPI 50 contains a discussion with the Founder of SharePad/ShareScope, Martin Stamp. Highly recommended and of course you can find that one on the ‘Twin Petes Investing Podcast’ page on WD2. It was rather nice to come home after a trip to the Pub on Friday afternoon (yesterday as I am starting this on Saturday Night), and then to find that my Portfolio had recovered pretty well and that the US Markets were storming again and the Nasdaq Tech Indexes had made fresh New All Time Highs (ATH). Such behavior is remarkably Bullish, despite valuations seeming quite mad on a lot of Tech Stocks in particular. It just shows that a reasonable understanding of how Markets move and some simple Technical Analysis, can help to keep you in the game even when based on the Fundamentals, it really makes very little sense. With the Nasdaq doing so well, it seems appropriate for me to start with the S&P500 and first up my Chart has the Weekly Candlesticks. Note straightaway that the S&P500 also hit a New ATH on Friday and my Blue Arrow is pointing to the White Up Candle that was produced. This is a ‘Bullish Engulfing’ Candle and on its own suggests more upside. There is Support from Friday just above 4200 and my Red Ellipse is highlighting 2 Candles that have a Hammer shape to them, and they suggest Support is pretty good at 4056. Look how the S&P500 is still nicely inside the confines of the Uptrend Channel marked by my parallel Black Lines; this helps us a lot because if the S&P500 falls out of this Channel in a convincing way, then it likely means trouble is coming. 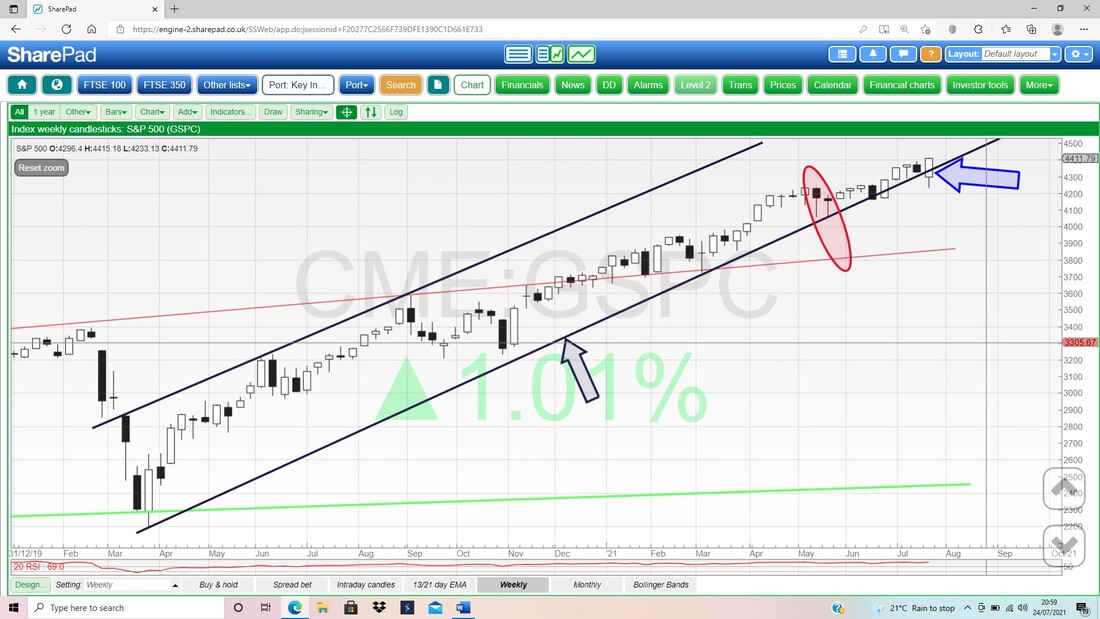
Next we have the Wavy Lines which are the 13 Day EMA (Exponential Moving Average) in the case of the Black Wavy Line and the 21 Day EMA in the case of the Red Wavy Line. This is a hugely useful Signaller because it is fast enough to get us into Trades in a timely fashion, yet is it slow enough to mean it doesn’t generate all that many false Signals. Some people use the 8 Day EMA with the 21 Day EMA and that will give the advantage of speed, but is no doubt prone to many false Signals. What is particularly nice is that it can help you stay in a Trade and let it run.
Anyway, this has been a remarkable run up and note how my Blue Arrow is marking a ‘Bull Cross’ between these Lines and that has been ‘in force’ ever since, and anyone how went Long on the S&P500 after the Bull Cross, would be very happy !! This Signal is so sweet because all we need to do is follow what it tells us to do. At the moment it is telling us to stay Long on the S&P500. 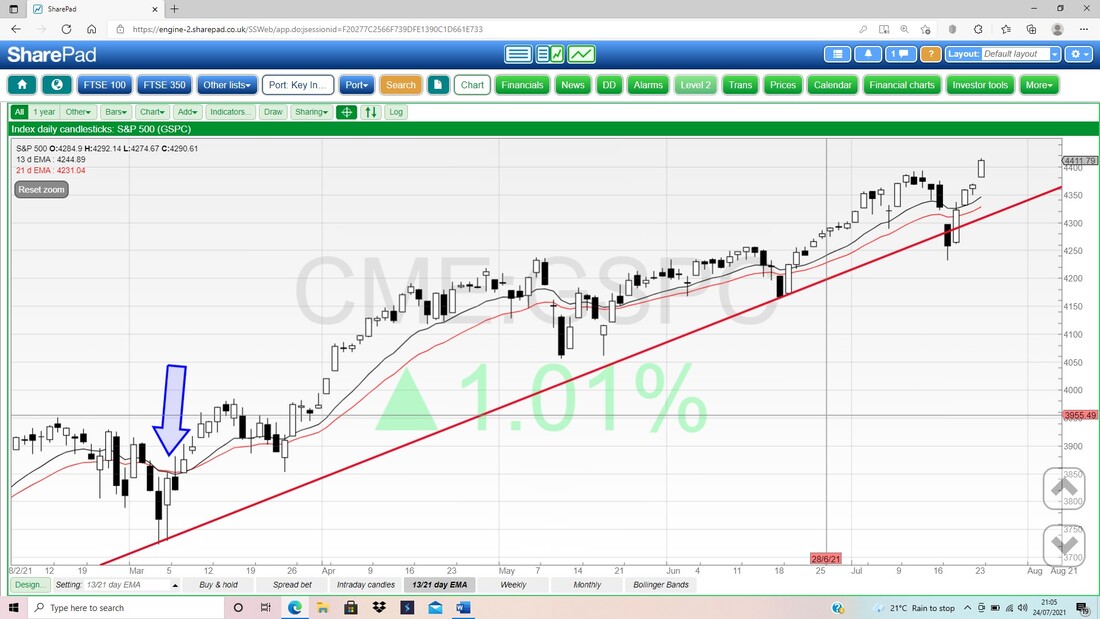
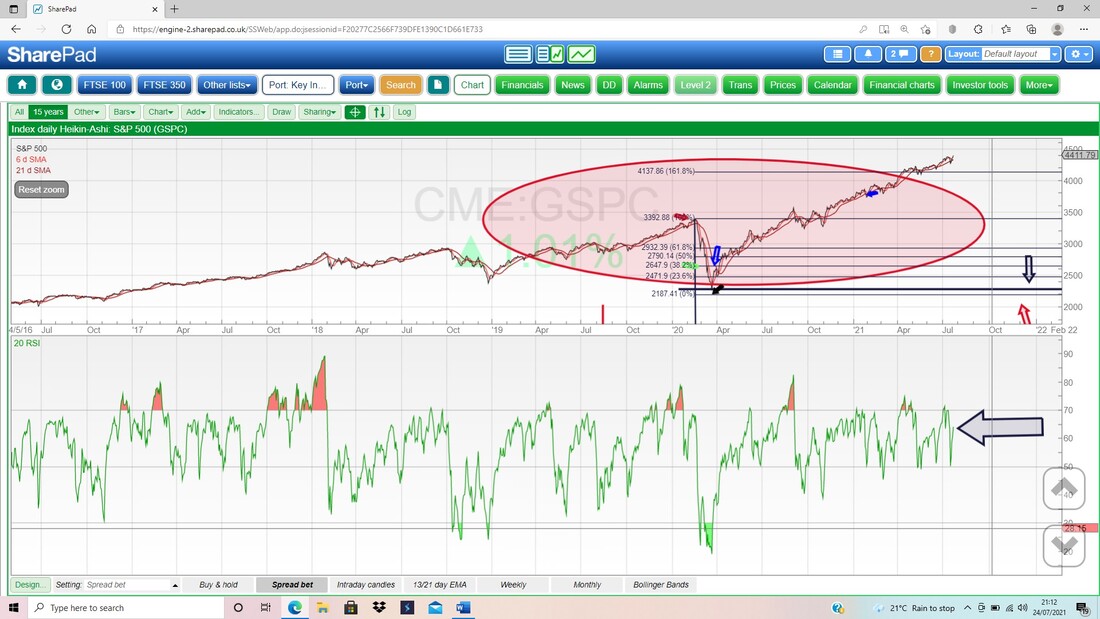
In the bottom window on the Screen below, we have the Daily RSI (Relative Strength Indicator) for the S&P500. On a Reading of RSI 64 where my Black Arrow is, this is getting high but still has room to rise quite a lot in the very short term before getting over-bought.
In the bottom window on this next screen, we have the RSI for the Weekly S&P500. On a Reading of RSI 69, this is overbought but not crazily so. If you look to the left you can see that the S&P500 has often been up above this level, but it is clear that the upside is limited. This probably lines up with my thinking that the Autumn could be a bit dodgy – we are likely to see the start of any wobbles in late August.
If you listen to the most recent Podcast, TPI 53, this includes a bit where we discuss the outlook for Markets and my conspiracy theory as to why we often get falls in the Autumn. 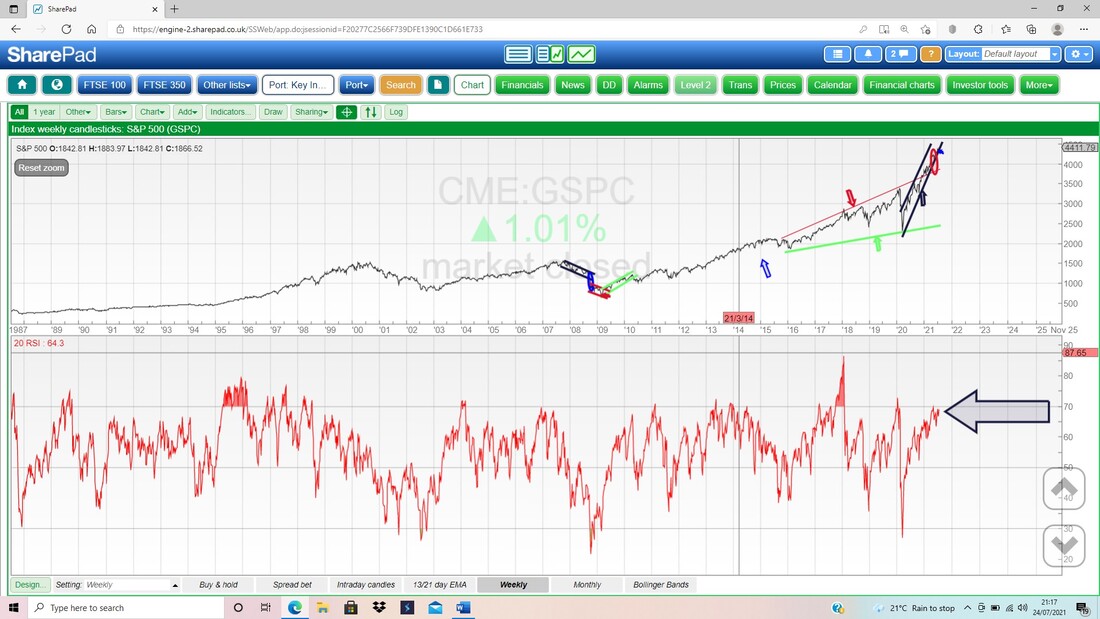
In my next Chart we have the Daily Candles for the S&P500 and the Pink Zone marks the Upper and Lower Bollinger Bands. My Blue Arrow is pointing to an Up Candle from Friday and note there is a bit of room to the Top Bollinger Band at 4435. Of course, there are no guarantees that it will hit this Top Band, but it is quite likely I suspect.
The Red Line marks the Bollinger Midpoint Line and this can often be Support. At the moment it is at about 4355. My Green Ellipse is highlighting Support around 4056 and this lines up with what the Weekly Candles were telling us on my first Chart tonight. 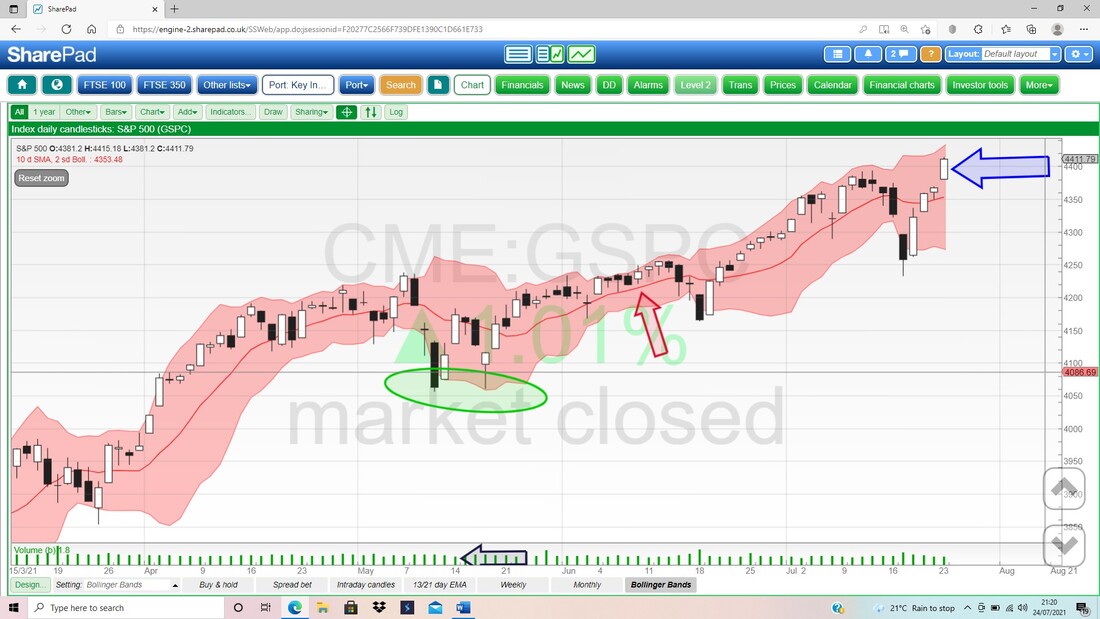
My next Screen has no changes to the one above (ok, I admit I have moved an Arrow) but I have used my mouse to drag the top of the Bottom Window so the Daily Volume Bars are more visible (I had to pay the mouse in wensleydale).
My Black Arrow is pointing to the Volume Bar for Friday and note how low it is compared to all the other Bars. This is precisely what I keep saying about light Summer Volumes. 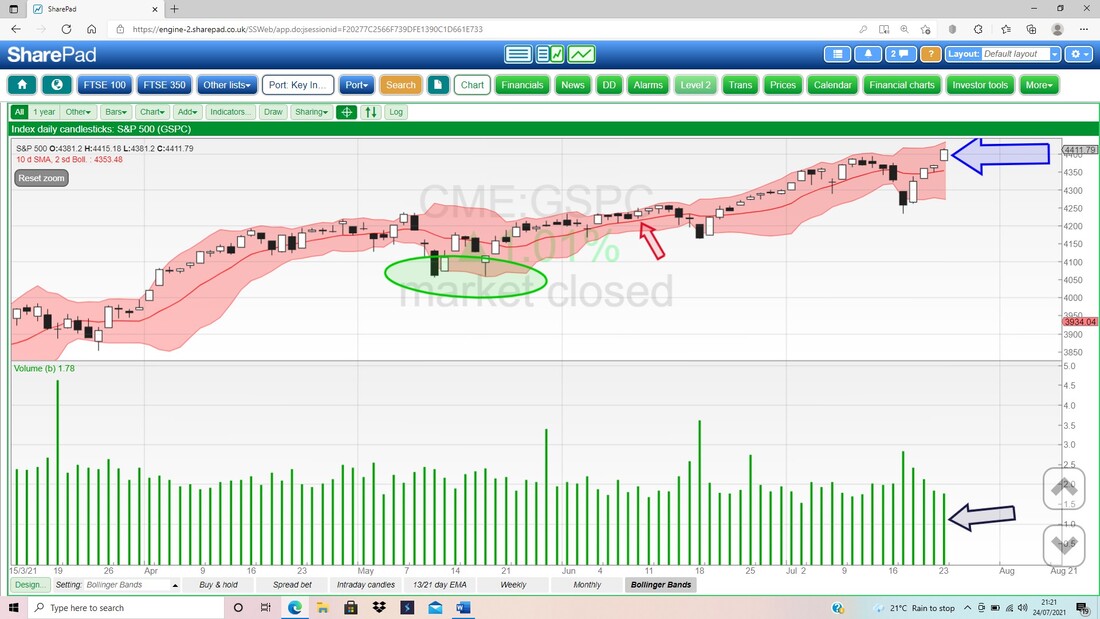
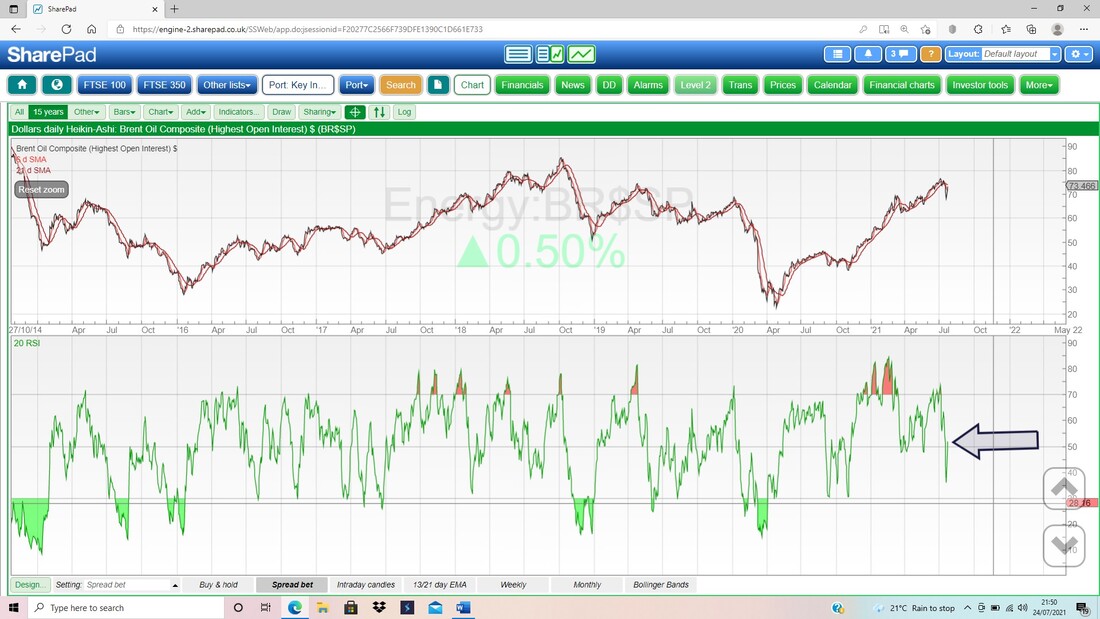
Brent Oil Composite
I always look at Oil because of its impact upon the FTSE100 and I am particularly interested in that because I am running the Test System for my Index Spreadbet method, and of course the direction of the FTSE100 has a big impact on how my Portfolio moves anyway. First up we have the Weekly Candles and there are lots of interesting things about this. My Red Arrow is pointing to the Candle for last week and note how it is arguably a rare ‘Dragonfly’ Doji and this really is a special form of Hammer Candle and it is Bullish. The low from last week was down at about $67 and note down further there is good Support at $60. To the upside, my Blue Arrow is pointing to Resistance at $75.6 but the Brent Oil Comp price has already been above this recently and if you look back 3 weeks, then the most recent High is $77.9 – so this is Resistance which needs to be cracked. Ultimately there is very strong Resistance at $86 where my Blue Ellipse is, in the top left-hand corner of the screen. I’m hearing a lot of loose talk about $100 Oil as if it is a guaranteed certainty. I detest such inflexible and frankly, naïve, thinking and the simple fact is that nobody (not even the Saudi Princes !!) knows where Oil will be. However, what we can be sure of is that if $100 Oil really is going to occur, then it needs to get through $86 first !! 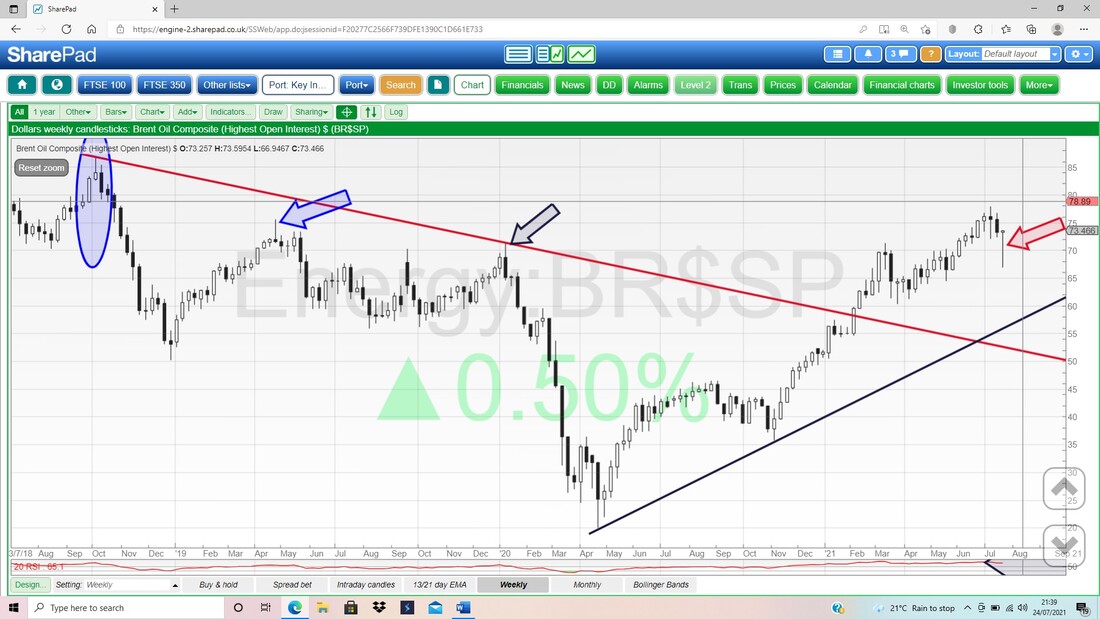
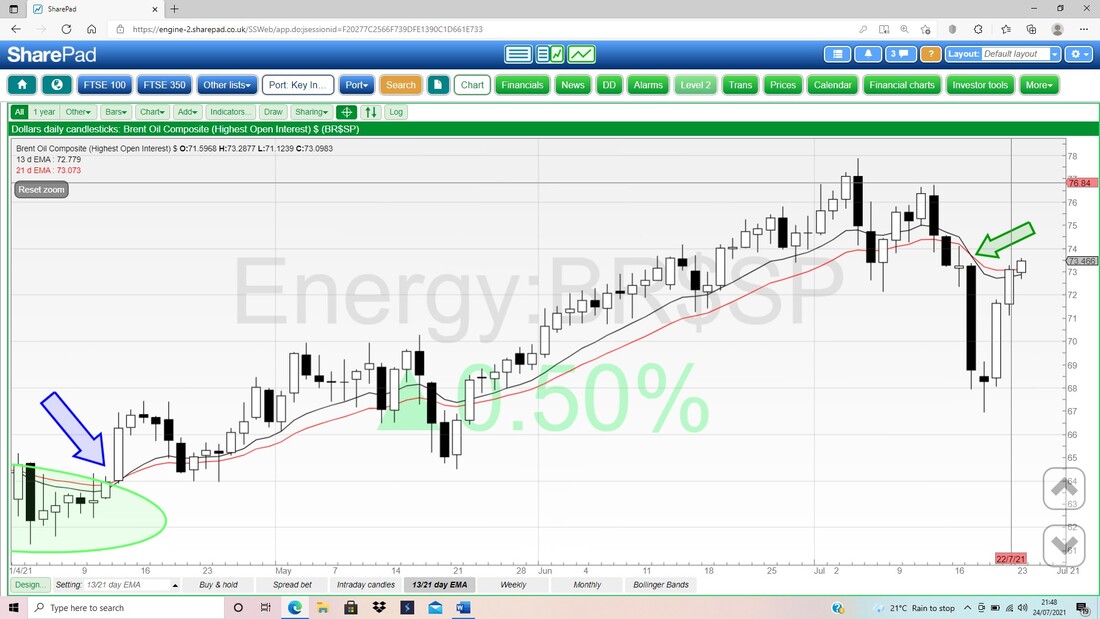
Next we have the Black Wavy 13 Day EMA Line and the Red Wavy 21 Day EMA Line. My Blue Arrow shows were a Bull Run started but note how a few days ago (these are Daily Candles) we had a Bear Cross where my Green Arrow is. This is problematic, because this Bearish condition is still prevailing, and we need a Bull Cross here ASAP if we are to avoid more downside.
In the bottom window of my next Screen we have the RSI for the Daily Brent Oil Comp price. On a Reading of RSI 52, this is pretty much Neutral and all this really tells us is that if the Price wants to rise it can go a long way, and if it wants to drop, then it could fall a long way !!!
Finally for Brent Oil Comp we have the Daily Candles and the Bollinger Bands. My Blue Arrow is pointing to a small Up Candle from Friday and note how this got above the Red Bollinger Band Midpoint Line (Red Arrow) at about $72.8 and this can often be Resistance so getting over this is positive.
Up above, the Top Bollinger Band is at $77.7 and this could be Resistance also. 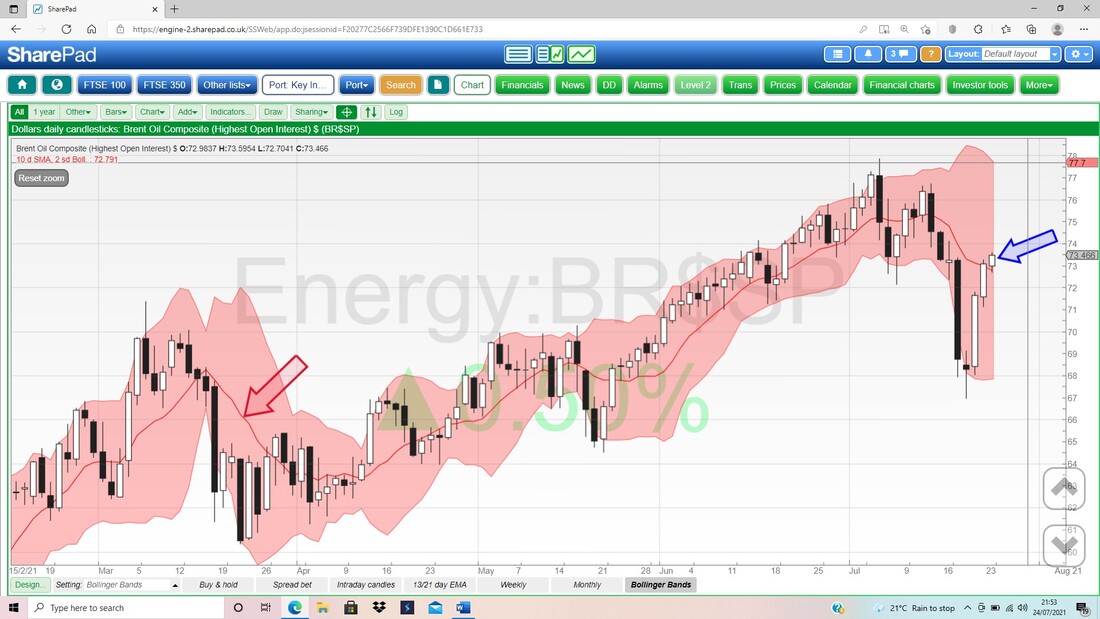
FTSE100
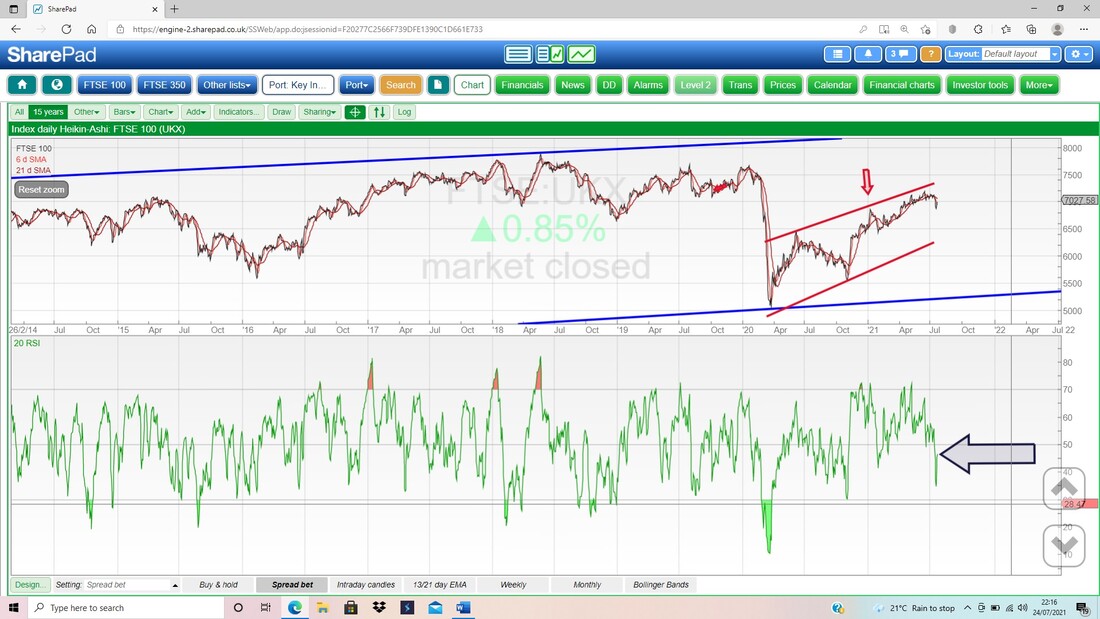
First up the Weekly Candles and my Blue Arrow is pointing to what looks pretty much like a Dragonfly Doji (or at least a Hammer Reversal and, however we cut it, this is a Bullish Signal). The Low from last week is at 6813 and this should be solid Support and below that we have Support right down to 6350 and 5500 where my Black Ellipse is. This is a well-Supported market. My Green Ellipse is marking the recent High at about 7217 and if the FTSE100 can get through this Resistance, then the big Resistance Zone is in the top left-hand corner of my Screen where the Shaded Black Rectangle is which runs from 7728 to 7800 and ultimately the ATH at 7903. Note my fairly gradual sloping Uptrend Channel marked by the Pink/Mauve Lines has corralled the FSTE100 price pretty well. 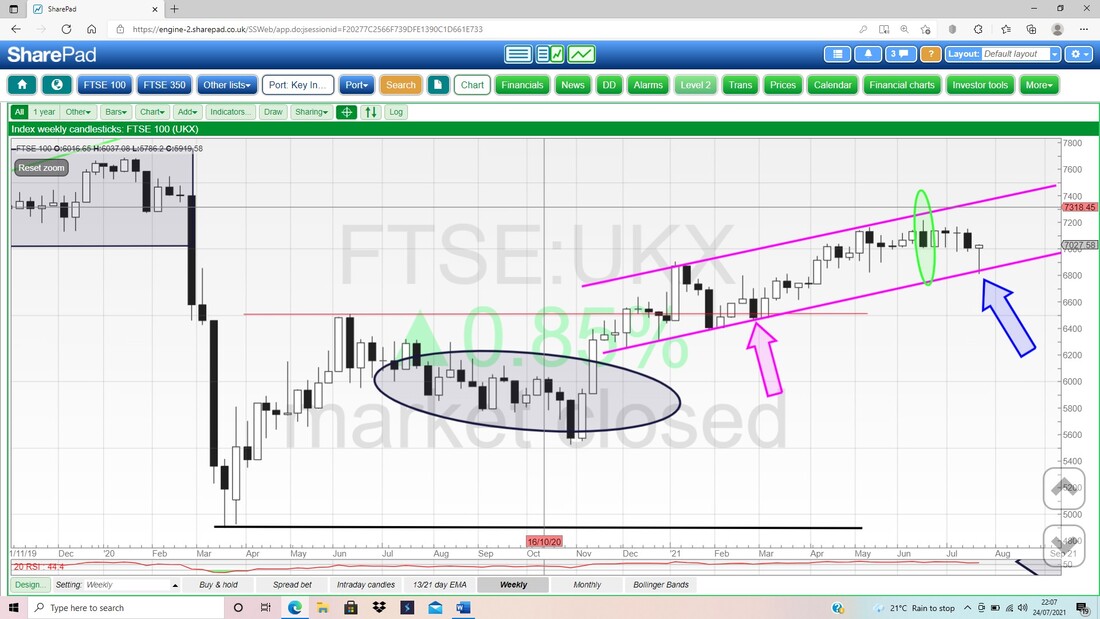
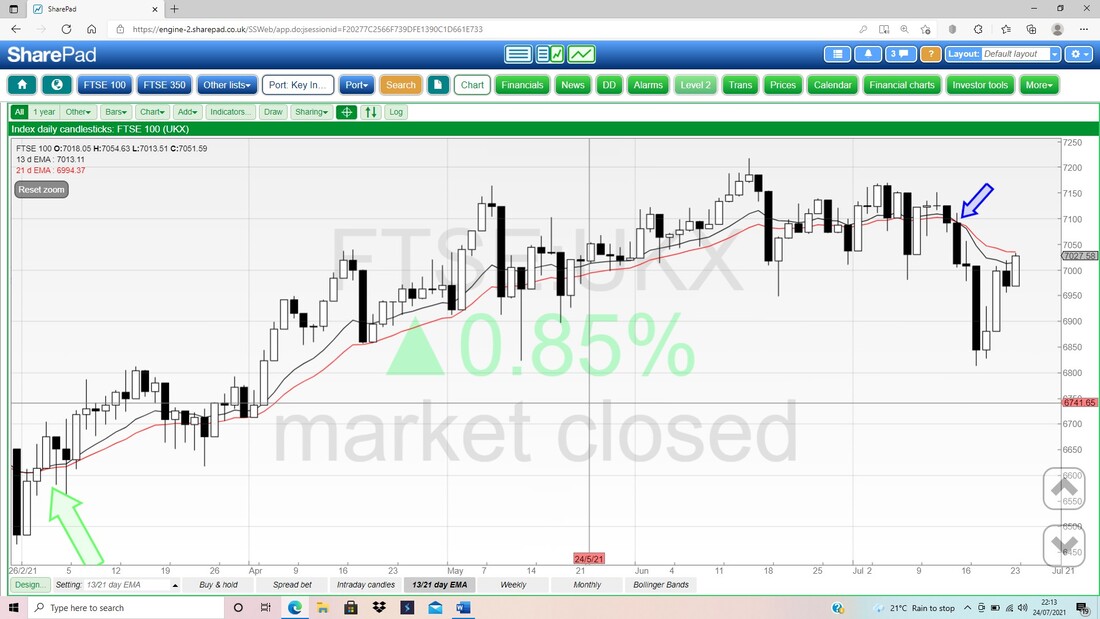
Next we have a potential concern, although it must be remembered that the 13 and 21 Day EMAs are a ‘slow’ Signal. My Blue Arrow is marking a ‘Bear Cross’ between the Black 13 Day EMA Line and the Red 21 Day EMA Line and at the moment this bearishness is still in force. We need a Bull Cross here ASAP.
In the bottom window on my next Screen we have the Daily RSI for the FTSE100 and on a Reading of RSI 47 where my Black Arrow is, this is pretty much Neutral.
The next RSI in the bottom window on my Screen below is for the Weekly FTSE100. This is interesting because on a Reading of RSI 57 where my Black Arrow is, this is not usually a particularly high Reading and in isolation it suggests the FTSE100 could rise a lot before becoming Overbought.
However, if you look to the left you can see that the FTSE100 Weekly RSI has often topped out around RSI 66 or so and it has not touched the dizzy heights of RSI 70 since 2006 !!! 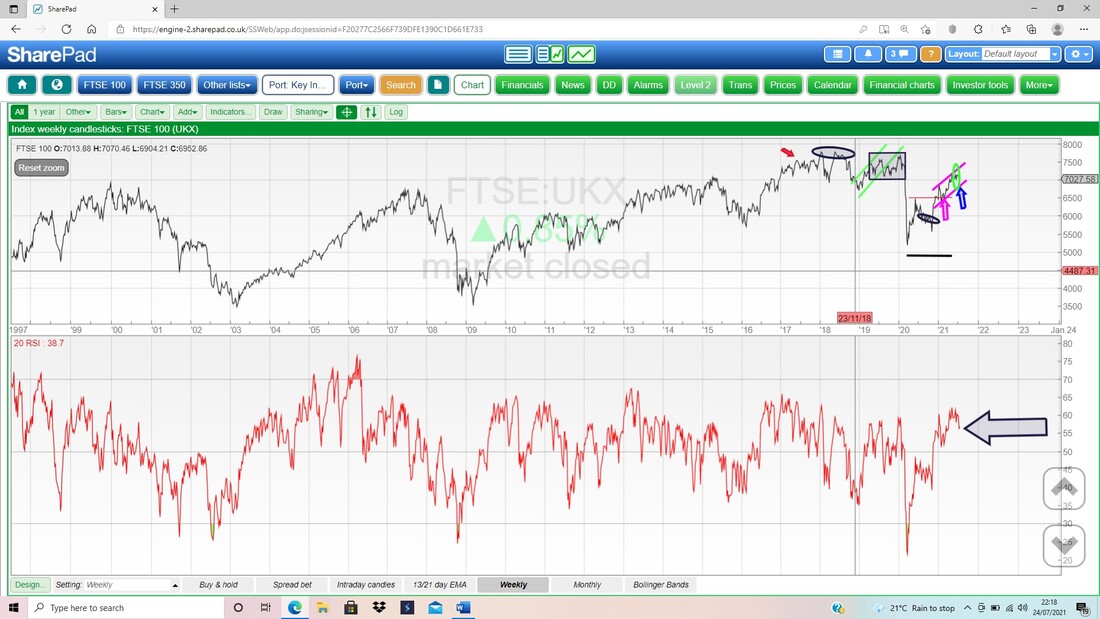
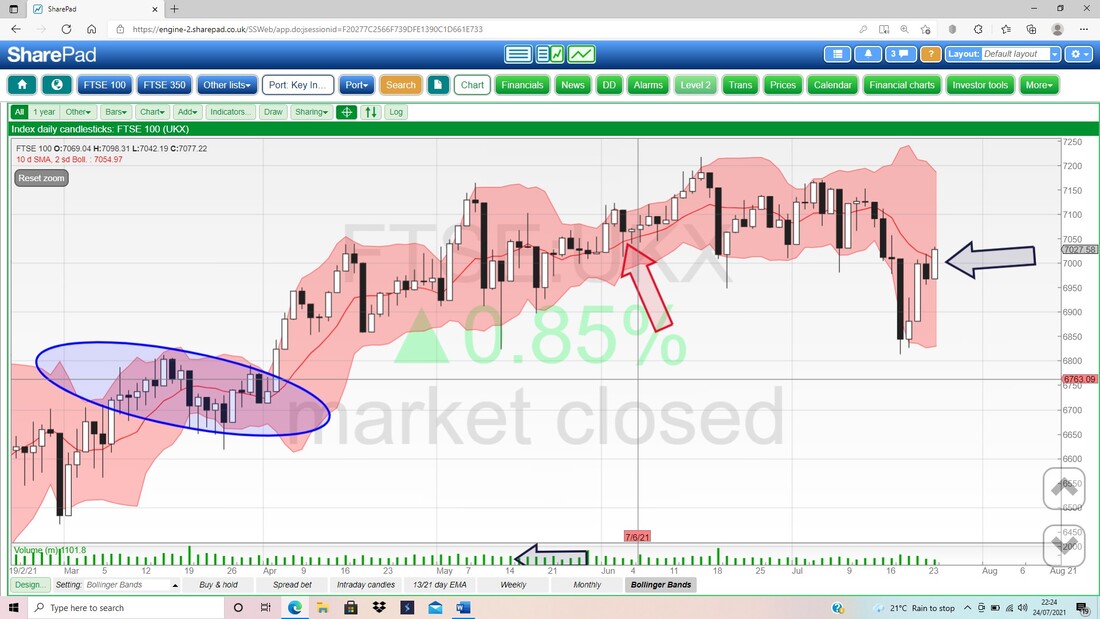
Next we have the Daily Candles for the FTSE100 with the Bollingers. My Black Arrow is pointing to a big Up Candle from Friday and, on its own, this looks Bullish. Note it got over the Red Bollinger Midpoint Line at 7070 and the next Resistance is at 7056 and then 7100 and the Top Bollinger is up at 7185.
Lastly tonight I have opened up the bottom window from the Screen above and we have the Volume Bars. Let’s be frank, the effort from Friday is pathetic and suggests we mustn’t give the Price action from that day all that much credence.
OK, that’s it for this week, I hope the Market Gods are bountiful to you in the coming week, and that you can keep away from both the Pingdemic and the Pandemic !! Regards, WD. 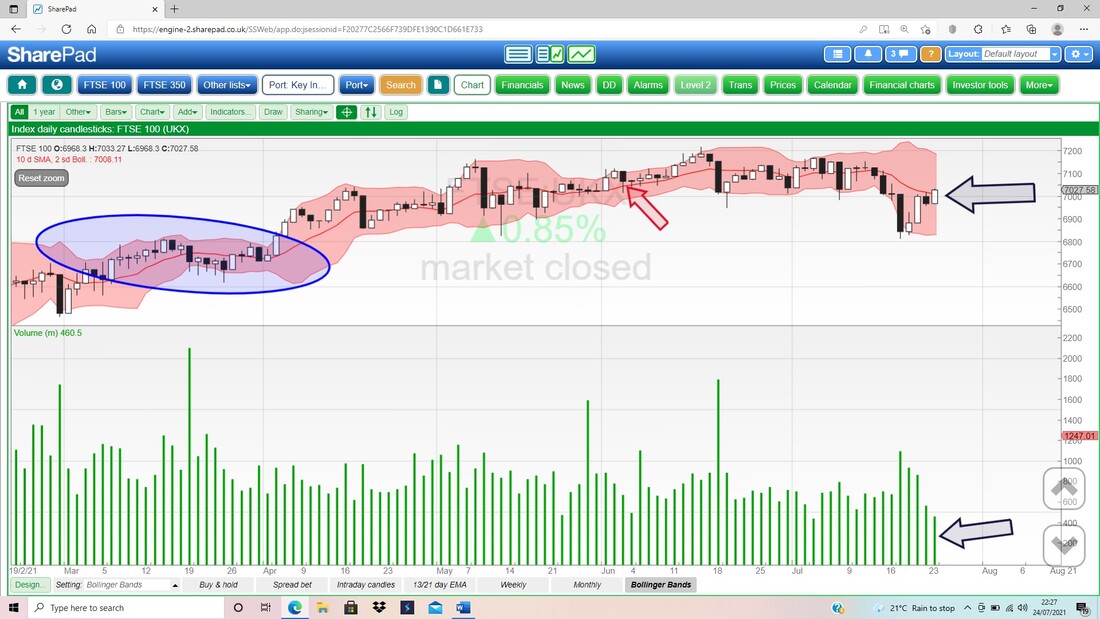
0 Comments
Leave a Reply. |

Stocks & Markets WheelieBlogsThese tend to be more Markets and Stocks related and timely - the Blog Page on the Main WheelieDealer Website has the 'Educational' stuff (well that's the theory anyway !!). Archives
October 2021
Categories
All
|
