

|
stocks & Markets blog |
|
This is such a strange time with the Coronavirus madness still dominating the Economic picture, and governments borrowing crazy amounts of money, and Central Banks mucking around and suchlike; and yet Markets just look almost like nothing can stop them going up.
It is very normal to get a Spring sell-off and it looked quite possible that something was going to start at the end of March, but again the Bulls shook it off and even the likely highly over-valued Nasdaq, kept on moving up. This ability by Bulls to repel the advances of the Bears on the battlefield, shows an underlying strength that could easily keep going. And I suspect it will.
Maybe April will see more wobbles and it has been a pattern so far in 2021 that there has been a dip as we get to the end of all three of January, February and March; so that is likely. However, the general pattern is that if we can scrape through the Spring without any major trouble, then Summer will be ok but it is as we head towards Autumn, and in particular late August and the month of September, when proper trouble could whack us.
Anyway, we discuss all this and more in the latest ‘Twin Petes Investing’ Podcast which is number TPI 46 and you can hear it on Soundcloud here: https://soundcloud.com/user-479955511/conkers3-wheeliedealer-46-ftse100-7000-aht-bdev-rio-resi-nnox-ihr-elco-dev-dvo-ai-ihr As always you can find the ‘Twin Petes Investing’ Podcasts on pretty much all the big platforms, and you will find them at the ‘Conkers Corner’ channel on the likes of Apple, Audioboom, Spotify, YouTube, Overcast, Google+ and probably a few others. You can shout at that Alexa thing as well to find it. Mello Monday Sorry for the late notice (I only just found out myself), but I am due to get involved with the Mello Monday Event on, er, Monday (12th April) and you can find out about it here: https://melloevents.com/ If you go to David Stredder’s Twitter Feed (@Carmensfella) he has details with a Discount Code etc., but if you click the link above, and then go to ‘Buy a Ticket for Mello Monday, 12th April 2021’ which is on a Blue Button, then put in Discount Code ‘TwitMM50’ and you will get a Ticket for half price. Well worth it and not a lot of cash. Last Week Well I am really pleased with how the last week went (especially as it was only 4 days) and I am very joyous about a gain of 2.9%, so my Returns so far in 2021 look pretty sweet. If you go to the ‘Monthly Performance’ page which sits on the WD1 website (there are Buttons all over WD2 which will take you to WD1 – I think it says something like ‘Back to Main Website’), then I have updated the numbers for March and I wrote how my Portfolio was doing at the time of updating. I managed to c*ck up my first attempt to report on how my Income Portfolio is doing, and I was really pleased to realise my error shortly afterwards and I am very happy with how that is going (I corrected it on the ‘Monthly Performance’ page). The Income Portfolio got smacked in 2020 and it is behind where I would like it to be (I talked about this more on the Podcast) but I suspect that if Markets can stay perky like they are (and if the bigger FTSE100 stuff can play catch-up), then I might be able to get a very nice Return for 2021 and see it back on track. My Spreadbet Account is performing very well and as a result my Cash has received a big boost in the last week or so; but I am still not confident that I have enough of a Cash Pile built up so that I can pull some out and invest it in my Income Portfolio. However, another good week or so and I should have plenty of Cash and once I feel confident, I will move a few grand into my Income Portfolio and I will be buying. I am very interested in Supermarket REIT SUPR and that is pretty much top of my list to buy, but I must say I listened to a Podcast with Merck (don’t ask me to spell his second name !!) who is the CEO of Hipgnosis Songs Fund SONG and I am now seriously thinking of buying more SONG soon. We shall see. Oh, I put that Podcast out on Twitter but if you can’t find it, then give me a shout on DM or Email and I will point you in the direction. It is superb. Other than that, I am fully invested and not doing very much at all. I am keeping close tabs on the Long Exposure in my Spreadbet Account and if it goes over my limit (it should be ok for at least a few weeks), then I will be looking to trim something there. If I can sell a Spreadbet Position, or trim it, then that will free up even more Cash which is currently tied up as Margin Deposit. Blog Slate Sorry, not much to report. My Health aggravation is ongoing and I can’t see that changing for a while. Ugh. Anyway, I did manage to update the ‘Monthly Performance’ page and you can ‘enjoy’ the Podcast as some sort of compensation. Oh, on the Podcast I did list out about 8 Stocks that I hold myself which I think look like they still have a fair chunk of upside. I think you may like that. Before the Days of Werner Von Braun and Bill Gates If you go to the ‘Blog Index List’ page which resides on WD2, then you should find the full list of all the Blogs I have ever written and there are links to the most useful ones. From that list, I bring you this old crock which you might find worth a read: https://wheeliedealer.weebly.com/educational-blogs/the-appeal-of-long-term-investing Lots of Charts to run through so better crack on…….. S&P500 All the Charts I show are taken from the excellent SharePad software I use and if you click on the images then they should get a bit bigger on your screen (I recommend you read these Blogs on a big screen rather than just a Fone – there is a lot of detail to be seen). If you fancy using SharePad or ShareScope yourself, then you can get 1 month’s Free Data if you go to the ‘Subscribe’ page on their website and then select the Product you want, and then you should see a ‘Promo Code’ box and if you type ‘twinpetes’ into that box, then the discount will apply. You can also get this by clicking on the Adverts that are all over my websites. I get a small payment for introducing you, so thank you very much !! https://www.sharescope.co.uk/ I want to start with the S&P500 because this is the broadest US Index (that means it has more Stocks and is more representative of what is happening across a wider range of Stocks, than as is the case on something like the DOW which only has 30 Stocks so is a poor example), and I am starting off with the Weekly Candlesticks. My Blue Arrow is pointing to a big White Up Candle from last week and this in itself looks Bullish. The fact we are up at All Time Highs (ATHs) is also very Bullish. Note how the Candles are nicely behaving within my Uptrend Channel which is marked by the Black Lines (Black Arrows). If the S&P500 falls through the lower Black Line (and therefore out of the Channel), then that would be a concern. At the moment it looks more like it is moving up off the bottom Black Support Line. 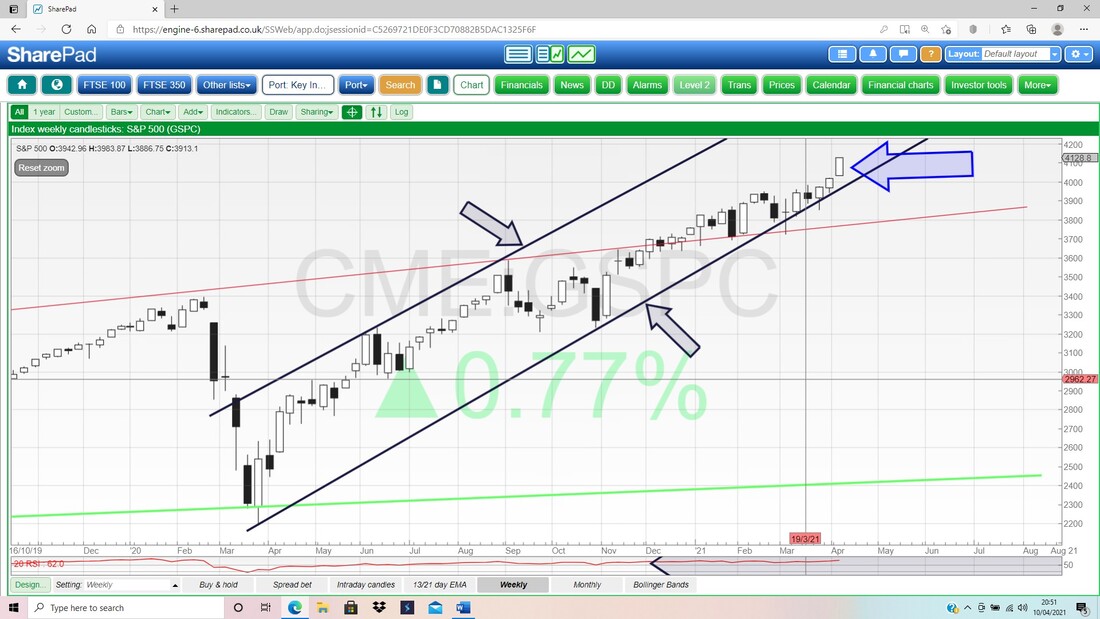
I don’t always look at the Chart below, but with the Markets being so perky, I just wanted to see how the RSI was looking on the Weekly (Relative Strength Index). In the Bottom Window below, we have the Weekly RSI for the S&P500 and my Black Arrow is pointing to where we are on a Reading of RSI 67, which is actually pretty high. If you look to the left, you should be able to see that the RSI often goes higher, but clearly we are near the top.
By the way, the Chart of the Weekly RSI is the same Chart as I showed for the Weekly Candles above, and I have just reduced down the top window and opened up the bottom window using my mouse. Simples. 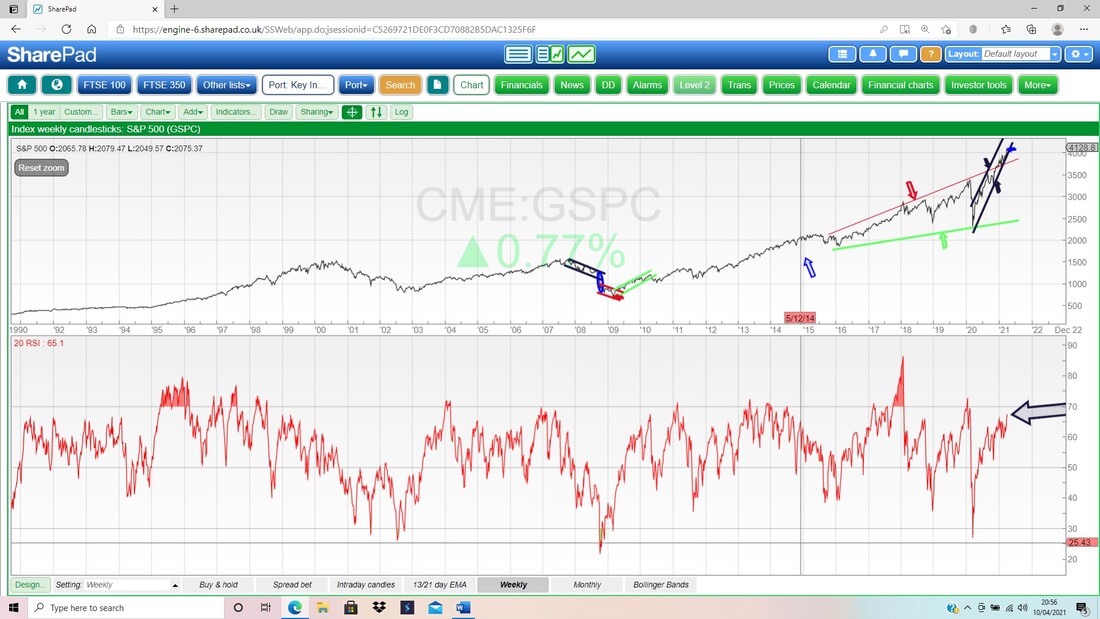
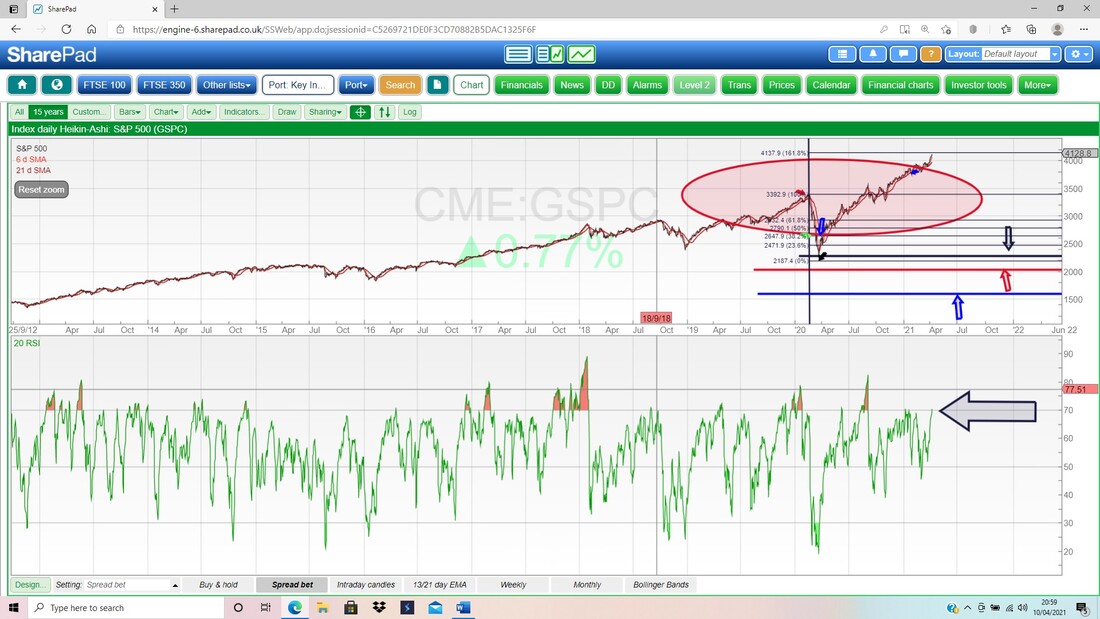
Sticking with the RSIs, in the bottom window below we have the RSI for the Daily. On a Reading of RSI 70 this is very high and Overbought, so we need a pullback of some sort or to go Sideways and to unwind the overbought condition. It can rise a bit more, but not a lot, in the very short term.
I won’t bother showing the 13/21 Day EMAs (Exponential Moving Average) Lines for the S&P500 this week, because with such Bullishness (we are at the ATH !!), then the 13/21 Day EMAs are by definition going to be in Bull Mode.
Next we have the Daily Candles for the S&P00 and my Pink Zone is marking the Upper and Lower Bollinger Bands. My Blue Arrow is pointing to a Big White Up Candle from Friday, and if you look closely, you should see a bit of space up to the Top Bollinger Band. My Red Arrow is pointing to the Bollinger Midpoint Line and this is often good Support. At the moment it is at about 4035 and down below that there is good Support at 4000, which is an important psychological level. 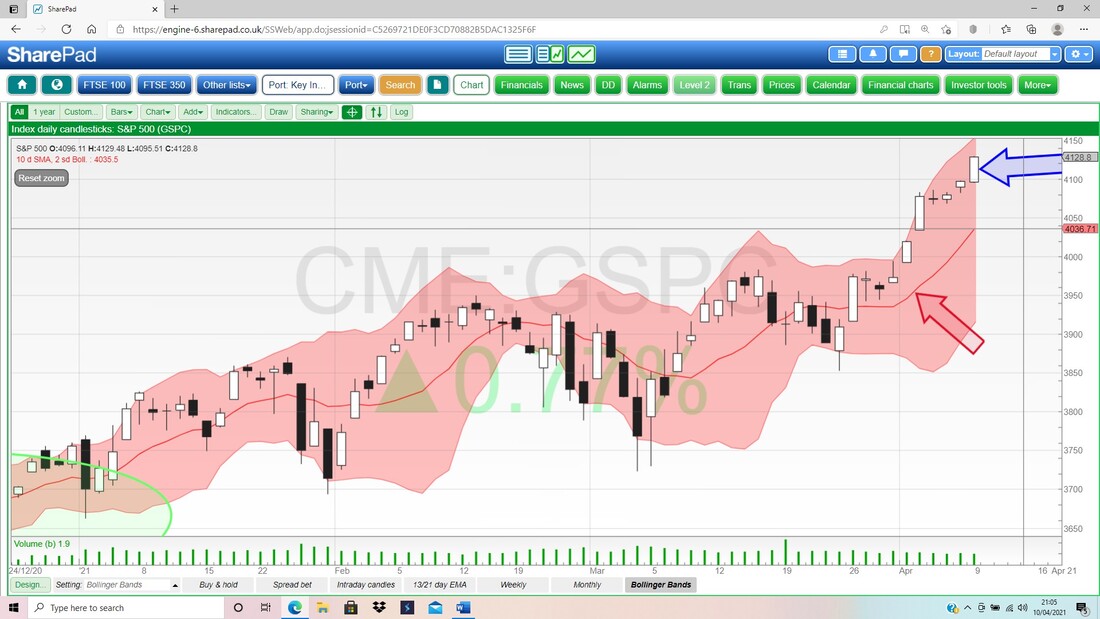
Brent Oil Composite
I won’t show much on this one for time reasons, but I like to look at Brent Oil Comp because it has quite an influence on the FTSE100. My Chart below has the Daily Candles but my Blue Arrow is pointing to a ‘Bear Cross’ between the Black 13 Day EMA Line and the Red 21 Day EMA Line. At the moment, this is still very much in force, and we need a ‘Bull Cross’ on this Indicator for Bulls to feel more comfortable. Another interesting thing here though is how the Brent Oil Comp Price has really been moving Sideways for about 3 weeks and my Green Ellipse is trying to capture this move. There is good Support at about $60 and then at $57.50 and $54.50. To the upside, Bulls need to get it over $66. That $60 Level is really important and Bulls are fine unless it drops significantly and decisively below. 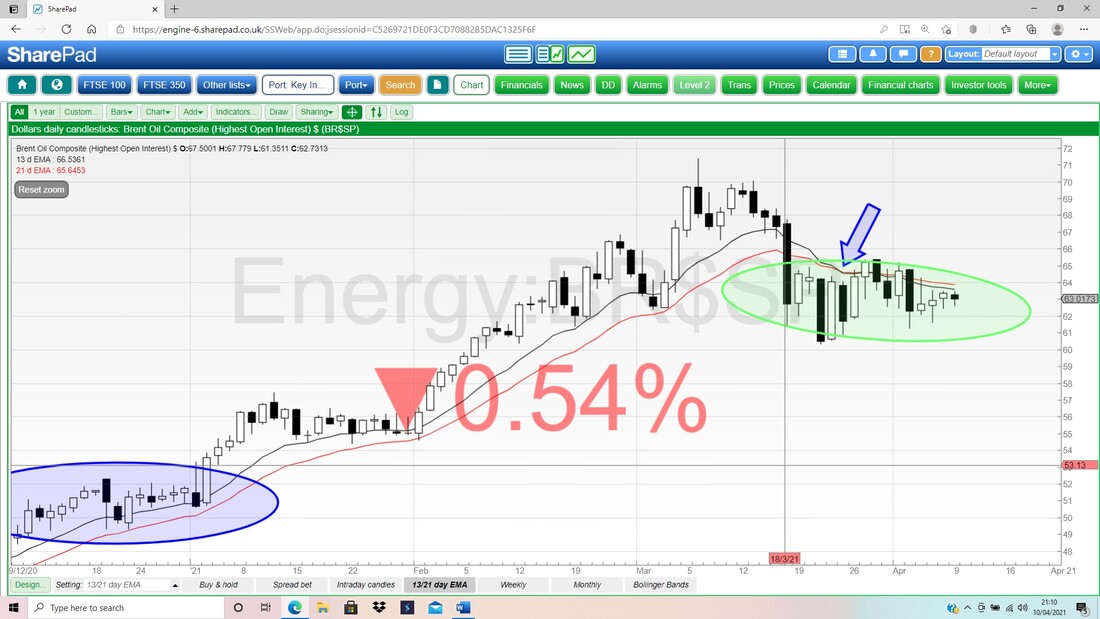
FTSE100
First up the Weekly Candles. My Blue Arrow below is showing a nice Big White Up Candle for last week and importantly this got above 6900 and my Green Arrow. However, it Closed at 6915 which is not massively above the Green Arrow, but I suspect it has done enough to keep rising. Next up is Resistance at 7000 which is an important psychological level. If that can be attained, then we have a Zone of Resistance all the way up to 7800. To the downside, there is good Support where my Black Ellipse is on the Chart. 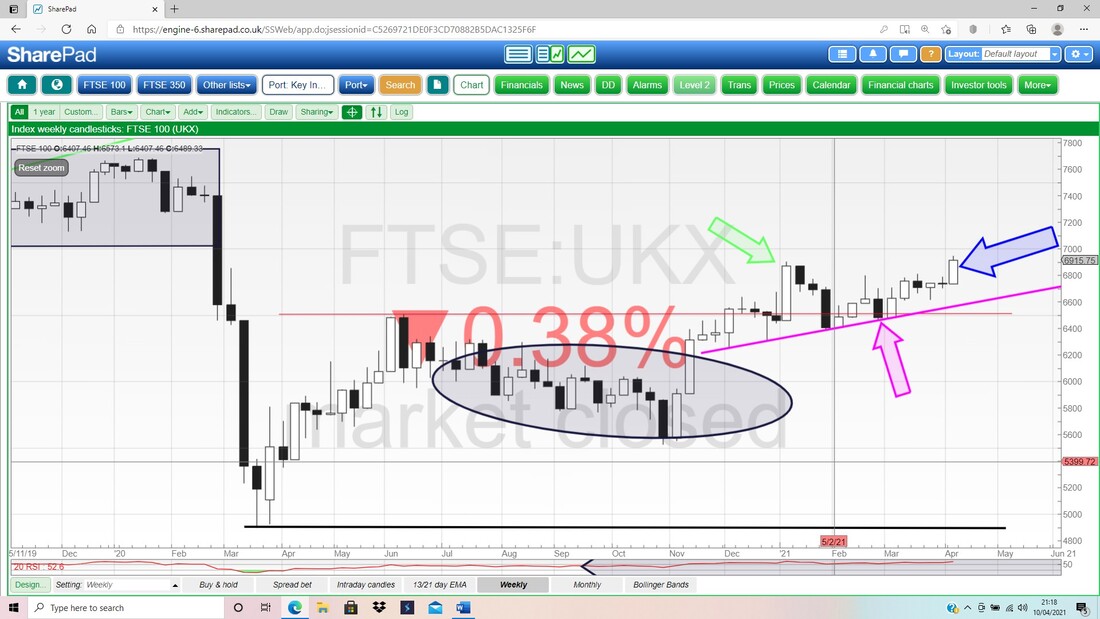
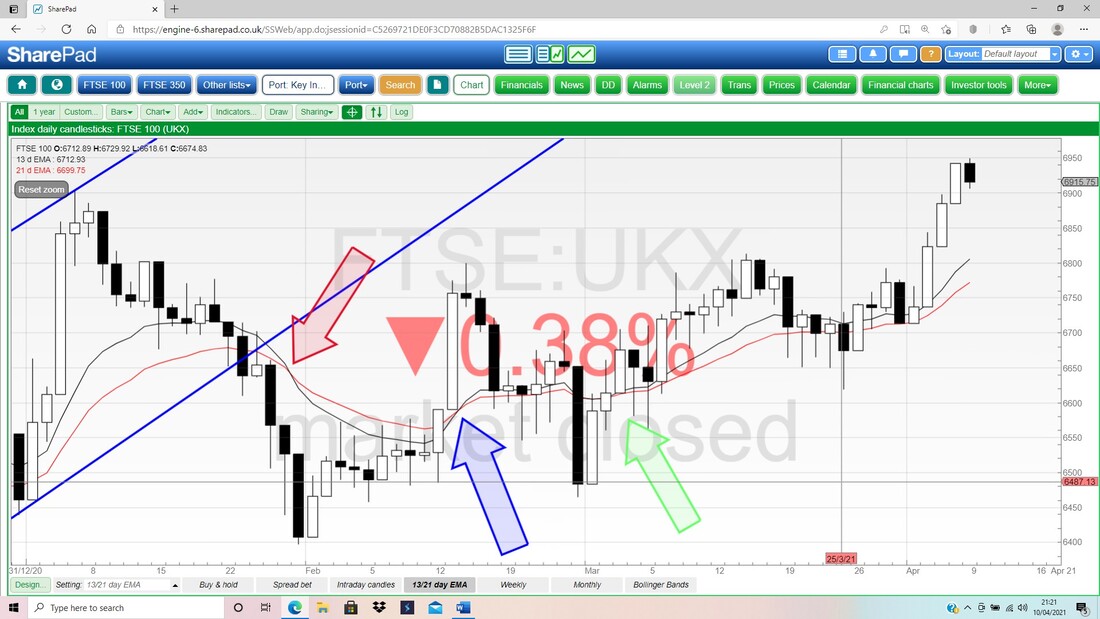
The next Chart is a bit messy, but please “Bear with” (anyone watch ‘Miranda’?), and what I am focused on here is the Blue Arrow which marks a Bull Cross on the 13 and 21 Day EMA Lines and the Green Arrow shows where this was tested, but the Bulls are keeping it running.
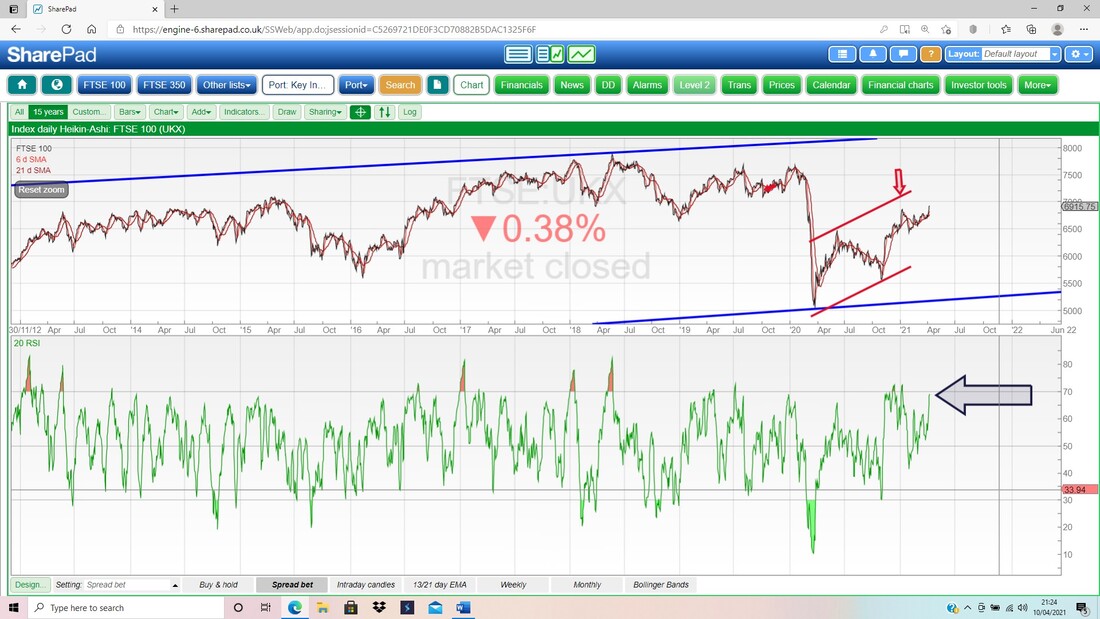
In the bottom window on the Screen below, we have the RSI for the FTSE100 Daily. On a Reading of RSI 69 where my Black Arrow is, this is very high and pretty much Overbought, so some sort of Pullback or Sideways move can’t be far off. It can rise a little more in the Short Term but not a lot. A small Pullback or Sideways would be healthy to take some heat out and enable the Rally to continue in a slightly longer timeframe.
Now I am going to really confuse you !!
In the bottom window below we have the RSI for the WEEKLY this time. On a Reading of RSI 59 where my Black Arrow is, this is not all that high and suggests more upside in the medium term. 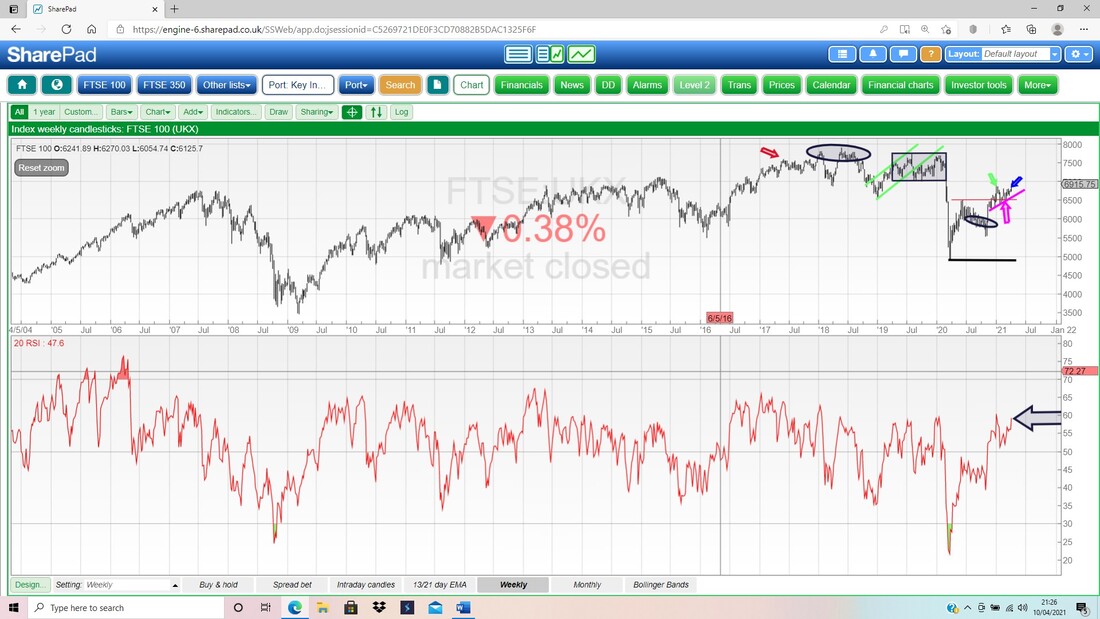
Last up for the FTSE100, we have the Daily Candles below with the Bollingers. My Blue Arrow is trying to point to the 2 Candles which come from Thursday and Friday last week. In combination these look a bit Bearish and this supports the idea of a bit of a Pullback or some Sideways movement.
Bulls need to get the FTSE100 above 6950 and my Red Arrow is pointing to Support from the Bollinger Band Midpoint Line at about 6800 and my Blue Ellipse is trying to highlight a lot of Support. 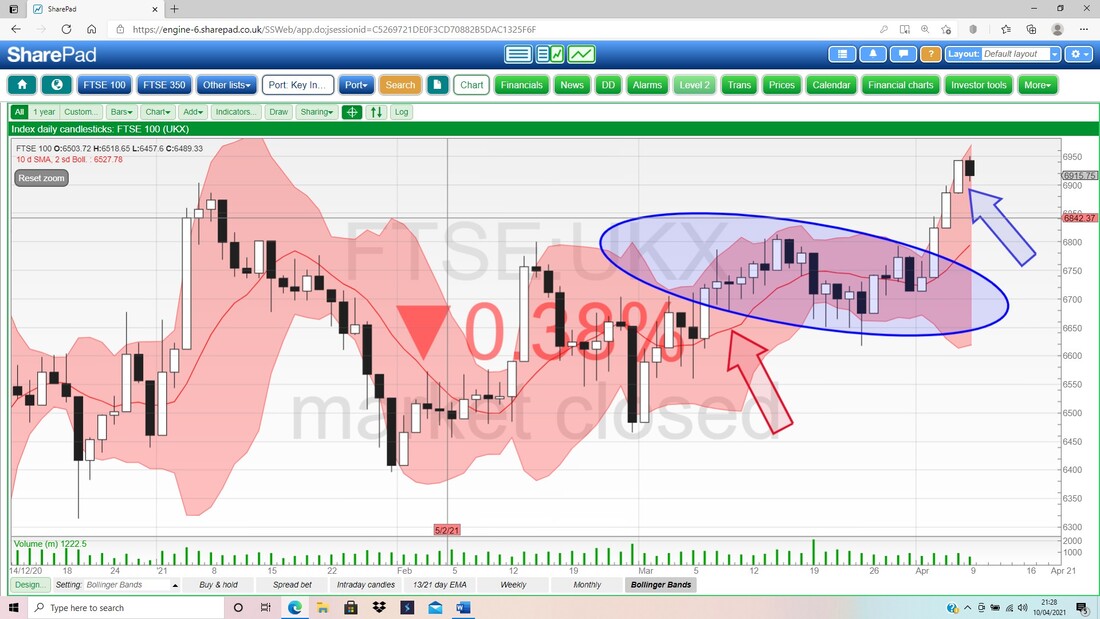
HSBC Bank HSBA
I wanted to see how the Forecast P/Es and the Dividend Yield expected for HSBA was looking. I hold HSBA and it seems quite beat up to me. As I suspected, they actually look quite attractive. A Forecast P/E of 12.6 isn’t too bad and a ‘2y fc PE’ of 10 also looks good. A ‘fc Yield’ of 3.7% is fine and a ‘2y fc Yield’ of 4.8% is pretty sweet. I hold this in my Income Portfolio so it is nice to see I can expect some decent Dividend Payments, assuming everything pans out ok. Of course HSBA has plenty of negatives around it with Hong Kong probably being of biggest concern due to the Human Rights concerns. If there was progress on this issue, it might move HSBA up a lot – but of course that is perhaps a bit unlikely. Higher Interest Rates would help all Banks though. 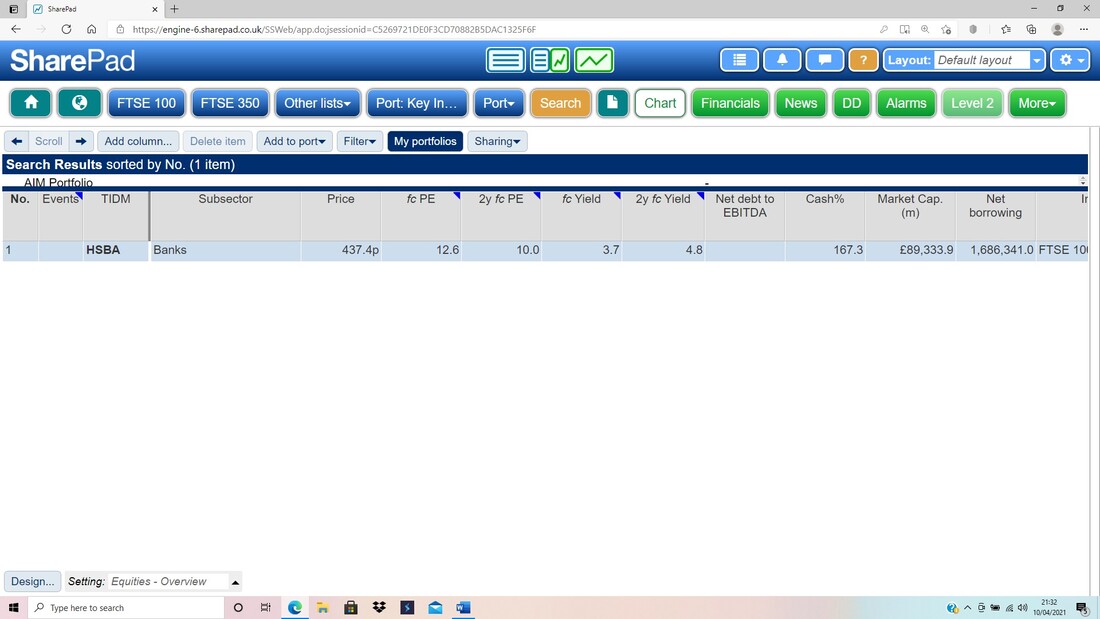
Aviva AV.
AV. is another one I hold, and if you look at my ‘Trades’ page on WD1 then you should see that I recently bought more. Anyway, since I topped up, it has risen quite nicely and I just wanted to review how the numbers were looking. You should be able to see from my List Screen from SharePad below, that AV. is on a ‘fc PE’ of 7.5 and ‘2y fc PE’ of 7.2. Those numbers look very cheap and I think a 2 Year Forecast P/E of 12 would be easily justifiable, which is more than 50% upside to the Price !! On the Dividend Yield side of things, the Table has ‘fc Yield’ 5.5% and ‘2y fc Yield’ 6% - more attractive Numbers. I suspect these Dividend Yield figures do not include any Special Dividend that may be coming, and they probably don’t include Share Buybacks. If I am wrong, the numbers are appealing anyway, but if we get Special Divvys and Buybacks on top, then that would be a huge bonus. OK, that’s it for this weekend. I hope you all have a good week and with luck I have given you plenty to think about here. Cheers, WD. 
0 Comments
Leave a Reply. |

Stocks & Markets WheelieBlogsThese tend to be more Markets and Stocks related and timely - the Blog Page on the Main WheelieDealer Website has the 'Educational' stuff (well that's the theory anyway !!). Archives
October 2021
Categories
All
|
