

|
stocks & Markets blog |
|
I am sure I have used that title for a blog before but I really don’t have the time or urge to bother going back through the previous ones to check. So it is what it is……..
The Markets had a small wobble on Friday morning after the Chinese Government imposed more laws on Hong Kong and this led to fears that tensions between China and the West would increase. My Portfolio suffered because I hold HSBC (HSBA) but because of the recent weakness in that Stock due to the Virus crisis, its impact on my Portfolio was not all that much (the good old ‘Diminishing Problem’). Thankfully by the Close on Friday Stocks had recovered quite well and I eked out a tiny gain.
Before carrying on with the usual stuff in this Blog I must mention that we issued a new Twin Petes Investing Podcast yesterday which is number TPI 23 – you can find it at the link below on Soundcloud and you can also find it on the ‘Conkers Corner’ Channels on Audioboom and Apple and now you can also find it on Spotify:
https://soundcloud.com/user-479955511/conkers3-wheeliedealer-23-how-to-find-10-bagger-stocks-ai-itm-futr-bgo-loop-vty-lam-bur Last Week It seemed very choppy to me all week and early on Friday it looked like all the gains I had made earlier in the week were going to be wiped out. Anyway, I did the most sensible thing in the circumstances and pretty much ignored the Markets all day so I was really pleasantly surprised to find out I had made a tiny gain on the day whilst I had been shoving tiny courgette plants into my adoringly prepare soil, and that for the Week I added 2.1% - so my Portfolio is now down about 7% for 2020 YTD which is pretty amazing when you think of the mess we are in !! It’s unclear what is going on but it strikes me the Markets are just doing sideways at the moment and we will look more closely at this when I do the Charts bit later. With the coming Monday being Memorial Day in the US and some sort of Bank Holiday in the UK, it is likely the short week coming up will bring yet more low volumes and that tends to mean more choppiness. I don’t mind choppy if I end up gaining on the week of course !! (I do feel sorry for the Day Traders – I know they need some volatility to make money but it must be very frustrating getting whipsawed all the time). I really am doing very little with my Portfolio at the moment. I still have the Long Spreadbets on the FTSE100 and the S&P500 and they are a bit frustrating with all this sideways action. I see no great need to mess about with the Stocks I hold and I have a lot of ‘wild card’ kinds of Stocks which have been quite beat up by the Crisis but if things end up improving (which I think is the most likely outcome) then we should see them make big and fast gains. Such Stocks as Hostelworld HSW and On the Beach OTB are in this category along with Retail stuff like Hotel Cholocat HOTC and maybe even troubled ones like Superdry SDRY can bounce a lot if they avoid more problems. Oh, I think it was a few days ago that I bought a Long Spreadbet on Vodafone VOD – I already hold them in my Income Portfolio and I wanted to bring it into my Spreadbet Portfolio because they look like they want to move up and because the Margin Requirements and the relatively low level of volatility make it quite a nice boring one which is ideal when using Leverage. As always you can see more details about this on my ‘Trades’ page. I really can’t see myself doing much for some time. Perhaps if I end up selling something then I might be looking to bring in a new Portfolio member but if I do anything it is likely to just be tinkering really. I must put more focus on my Spreadbet Portfolio though and I will try to direct my attention that way. Blog Slate In the last few days I have made very good progress on a Blog about how to use Funds to best effect and it includes lots about the upsides and downsides etc. I have done pretty well on it so I think it should be issued later in the coming week and I then have a couple of ideas for what to start writing next. I need to do that ‘Weekly Performance’ page as well but I am definitely lacking enthusiasm for that – I suspect that the solution will be just to give monthly breakdowns rather than doing it by the weeks – it would take me forever to catch up on all the weeks I have not done !! With some focus I can probably get this done quite easily so I need to get my mind in gear. From back when the Dinosaurs roamed the Earth I have dug out a Series of Blogs I wrote back in 2015 and these were some of my first efforts but I suspect Readers will find them worth reading again - or for the first time if you have not suffered them before. It is interesting to note though that I have shifted a bit from what is written in these Blogs these days because I am more reluctant to sell Great Stocks now and back in the past I was a lot more active (probably for little advantage). Don’t worry about the bizarre numbering on these Blogs !! https://wheeliedealer.weebly.com/educational-blogs/when-is-it-time-to-dump-a-stock-an-overview-of-wheeliedealers-sell-triggers-part-1-of-2 https://wheeliedealer.weebly.com/educational-blogs/when-is-it-time-to-dump-a-stock-an-overview-of-wheeliedealers-sell-triggers-part-2-of-3 https://wheeliedealer.weebly.com/educational-blogs/when-is-it-time-to-dump-a-stock-an-overview-of-wheeliedealers-sell-triggers-part-3-of-might-be-5 https://wheeliedealer.weebly.com/educational-blogs/when-is-it-time-to-dump-a-stock-an-overview-of-wheeliedealers-sell-triggers-part-4-of-might-be-5 https://wheeliedealer.weebly.com/educational-blogs/when-is-it-time-to-dump-a-stock-an-overview-of-wheeliedealers-sell-triggers-part-5-of-5 Enough waffle, let’s do the Charts !! Brent Oil Composite As per normal the Charts I show are all taken from the excellent SharePad software that I use. If you click on the images they should grow larger on your screen so you can see more detail. I showed a similar Chart to this last week so hopefully it should make sense if you are keeping up !! First off my Black Arrow is pointing to a quite nice Hammer Candle from Friday where the Price of Brent dropped down but Closed up near the Open by the finish of the day. Note how it found Support on the 13 Day EMA Line which is the Black Wavy Line (Exponential Moving Average), and a Hammer like this could be signalling gains ahead. There was Resistance at the Blue Horizontal Line (Blue Arrow) at $36.4 which was broken through for a few days but the Price fell back. If it can get above this Blue Line again, then the next big Resistance is just under $40 and comes from where my Red Arrow is. My Green Arrow marks a ‘Bull Cross’ between the Black 13 Day EMA Line and the Red 21 Day EMA Line – these usually mean weeks of gains to come. My Black Ellipse is capturing a sort of Hammer Candle and it looks more and more like this was a Capitulation Day and this Reversal was when everyone was freaking out about WTI Crude going to Negative $38 or something like that (I recall mentioning this in the latest Podcast TPI 23). I am fascinated by Oil because I think if it can rise (which looks very likely) then I think the FTSE100 will go up with it. 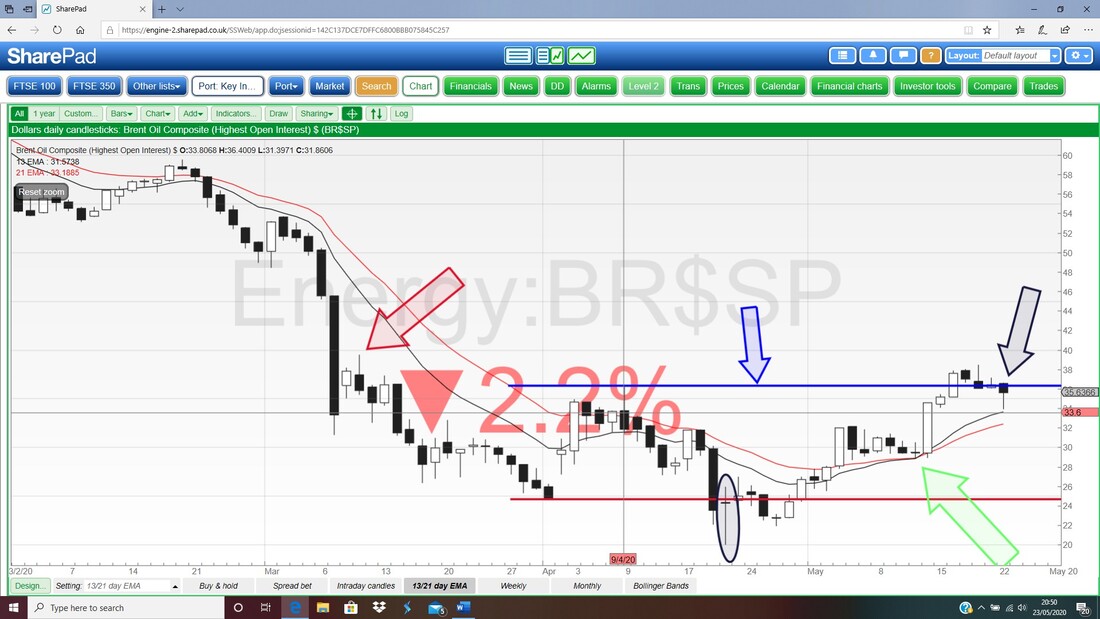
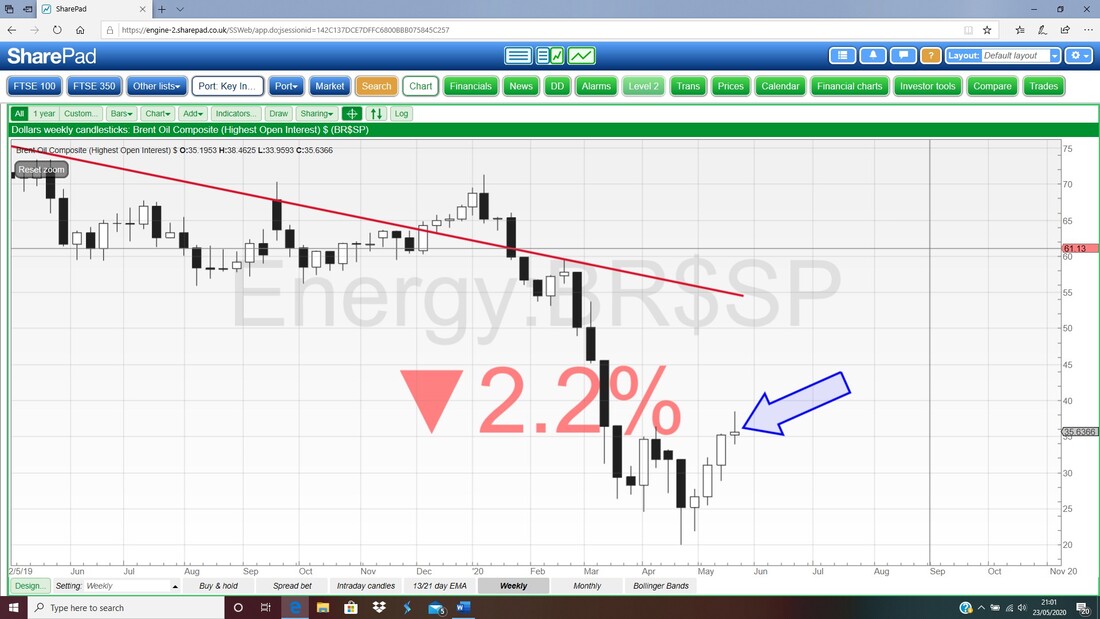
My Chart below has the Weekly Candles for Brent Oil Composite and my Blue Arrow is pointing to a ‘Bearish Shooting Star’ type of Candle which suggests we might get a Pullback. Obviously this is conflicting with the Signals from the Chart I showed earlier so the thing to focus on here are the Resistance Levels and if $38.5 and then $40 are taken out, then expect a lot more gains.
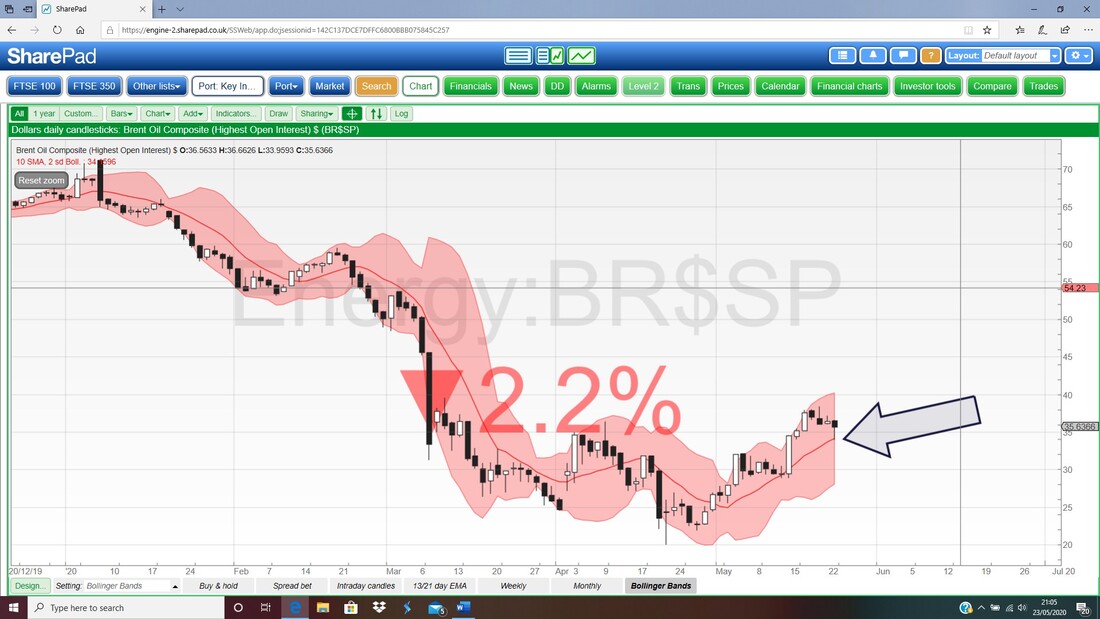
The next Chart has the Daily Candles for Brent Oil Composite and the Pink Shading marks the Upper and Lower Bollinger Bands. Note how on Friday the Price dropped back to the Red Midpoint Line on the Bollingers – my Black Arrow is pointing at this. These Midpoint Lines often act as Support or Resistance.
S&P500
First up the Weekly Candles. My Blue Arrow is marking an Up Candle that was formed last week but note it couldn’t quite hold the High which was at about 2980. If it can get through that Resistance, then we come up against my Red Line (Red Arrow) which marks 3000 which is a psychologically challenging Resistance Line. Note how last week the S&P500 managed to rise and that meant that the Down Candle from the previous week was unable to cast a Bearish shadow on the S&P500 – another win for the Bulls and a failure by the Bears to capitalize on a setup they had created. 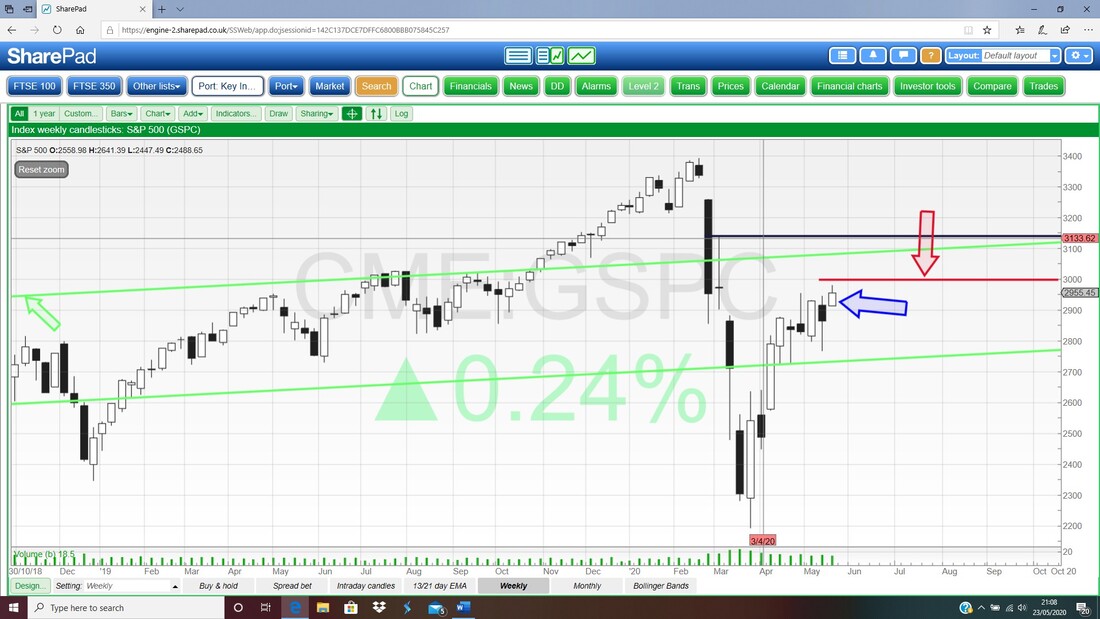
This looks very Bullish and a major reason why I am happy having a Long Spreadbet on the S&P500. My Red Arrow marks a ‘Bull Cross’ between the Black 13 Day EMA Line and the Red 21 Day EMA Line. If you look where these lines are now, they are quite widely apart and that suggests more gains.
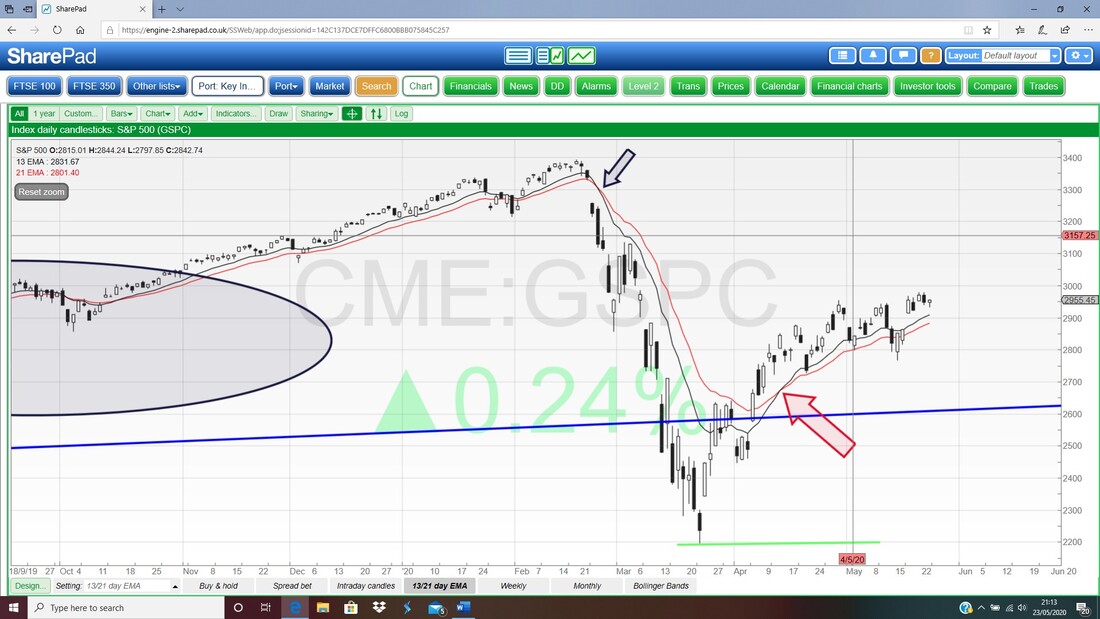
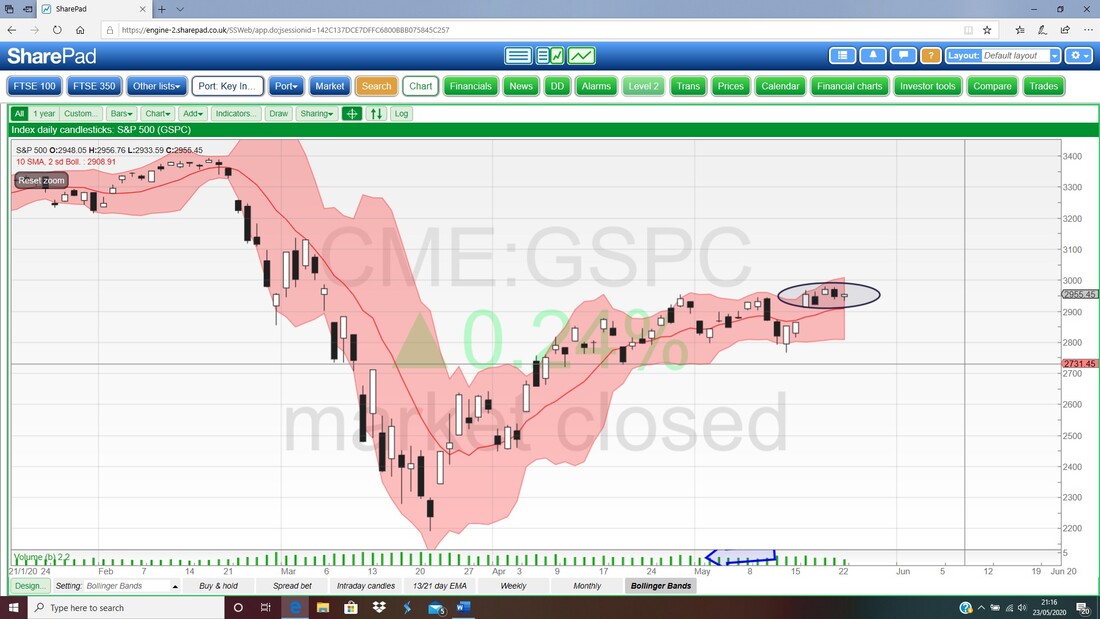
Next we have the Daily Candles for the S&P500 with the Bollinger Bands. My Black Ellipse is capturing where the Daily Candles didn’t really do much last week and I won’t be surprised if we get more of this sort of grind. As I mentioned, 3000 is the key number to watch here.
FTSE100
First we have the Weekly Candles. My Blue Arrow is marking an Up Candle from last week and note that like the S&P500 it managed to kick away the Bearish hint from the week before. The key here is the Resistance that comes from the Top of the Bearish Shooting Star Candle which is under my Black Arrow – that is at about 6151. 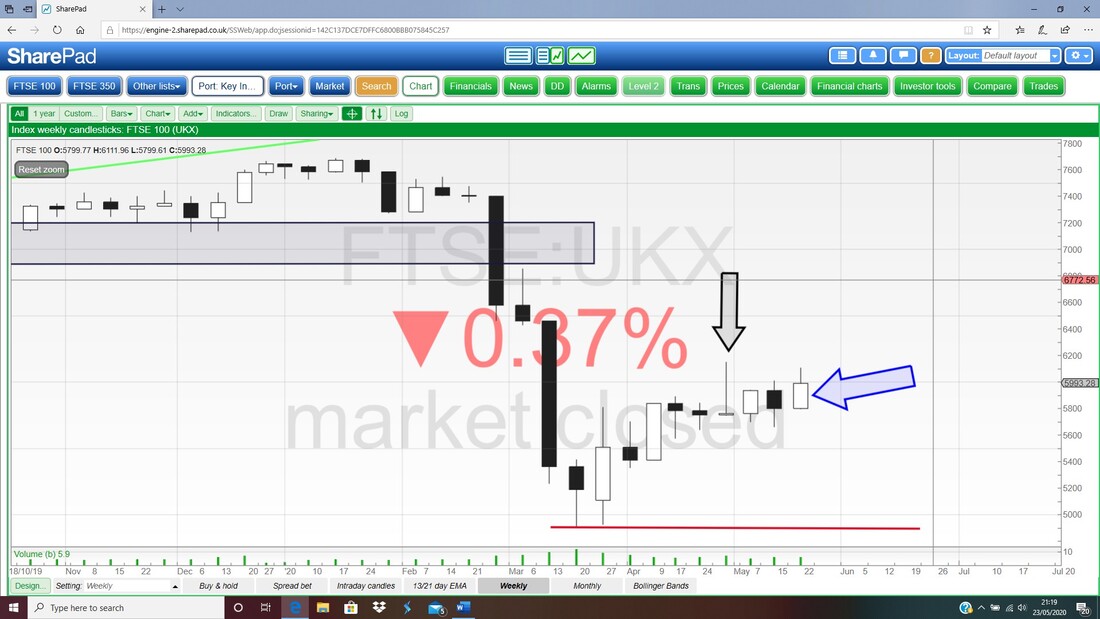
Next we have the 13 and 21 Day EMA Lines – my Red Arrow marks a Bull Cross and this is still in force although I would like to see those Lines move wider apart because when they are close together it does not take much weakness to trigger a Bear Cross.
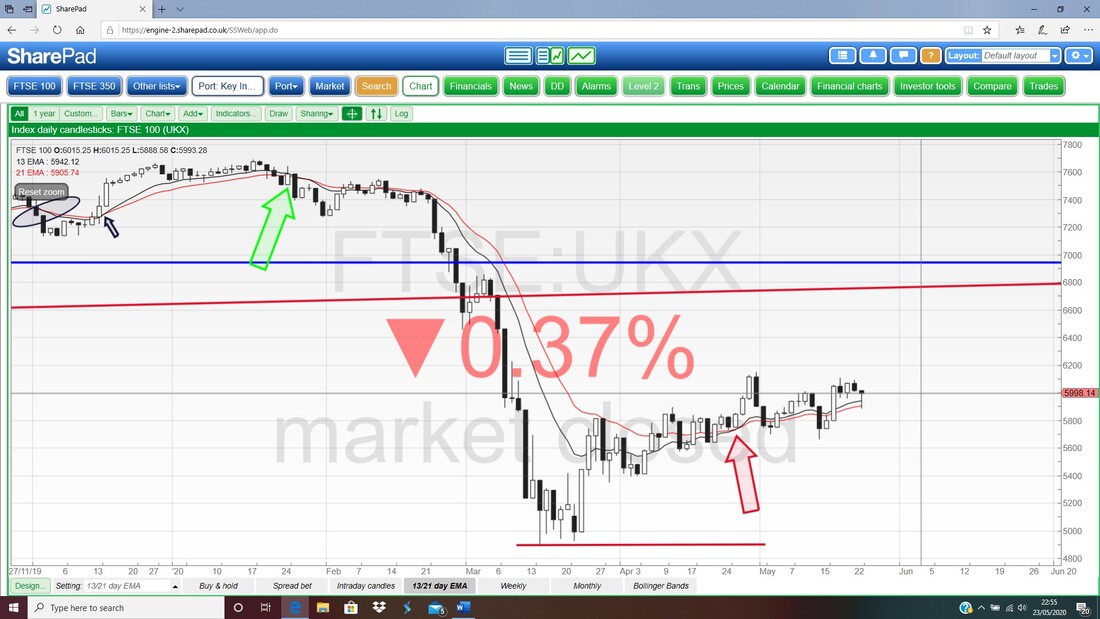
Finally quite a busy Chart with the Daily Candles for the FTSE100 with the Bollinger Bands. My Red Arrow is pointing to the Hammer Reversal from Friday and it is quite possible the FTSE100 can gain off this. My Blue Arrow is marking a Blue Horizontal Resistance Line at 6231 which is important Resistance to break through.
So far it looks like the gradual Uptrend Channel marked by my Green Lines is valid. Down at the bottom my Black Line with the Black Arrow at 4898 is critical Support which must hold if we have any weak periods. The FTSE100 is not really moving a great deal around the 6000 Level and it would be nice to see it move up away from this soon – before we all die of boredom. OK, that’s it for this weekend – good luck for the coming week and remember to enjoy the Sunshine if we actually get any. Cheers, WD. 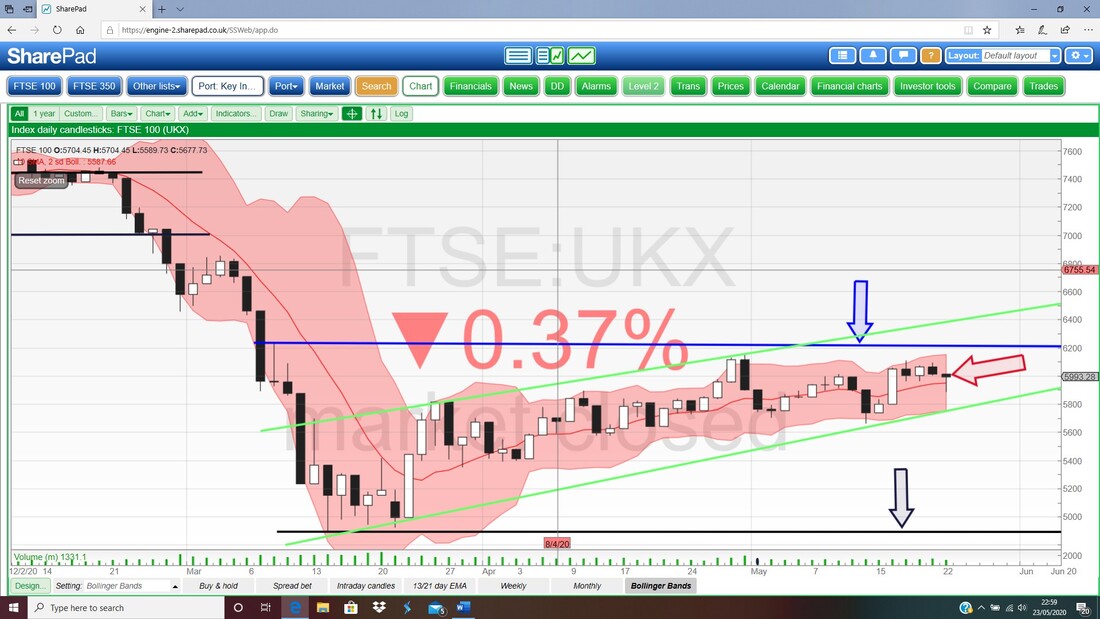
0 Comments
Leave a Reply. |

Stocks & Markets WheelieBlogsThese tend to be more Markets and Stocks related and timely - the Blog Page on the Main WheelieDealer Website has the 'Educational' stuff (well that's the theory anyway !!). Archives
October 2021
Categories
All
|
