

|
stocks & Markets blog |
|
I was truly astonished back in March when the Government willingly forced the UK Economy into Recession as throughout modern history governments of all colours have understood the link between bad economic times and social problems such as increased poverty, wealth inequality, worse health, shorter lifespans etc. etc.
So I am really taken aback that a Government – and above all that, a TORY GOVERNMENT – would deliberately force a Recession for the second time in around half a year. It is truly history in the making; although of course it would be fully justified to get a sense that this will not play out well at all.
Anyway, it is what it is, and our job as Investors is to navigate what the Markets throw at us and there is no point crying about it. Fortunately for me I am pretty heavily Hedged via Short Spreadbets on the FTSE100 (see my ‘Trades’ page for details) and at the time of writing, this leaves me fairly relaxed because I am pretty sure my Portfolio positioning will be able to cope with most eventualities that the events throw up. I am 50% Hedged so that has in effect massively reduced my exposure on the Long side, and if Markets fall the impact will be far less than it would be if I had just gone into the storms fully invested.
Something I noticed that was a bit strange last week was that the Markets were pretty moody and the FTSE100 and other global major Indexes dropped back, but on many smaller Stocks there were actually several that were up and the falls on these Stocks were nothing like we saw in March when quality Stocks were often dropping 8% in a day and pretty much no Stocks in my Portfolio were up. Maybe if the mood gets worse in the coming week then these Smaller Stocks will get whacked as well. Hard to know. To a large extent the Markets may have priced in the UK Lockdown although the length at 4 weeks is probably a slight shock and this morning (I am typing this on Sunday Night) one of the Lunatic Ministers, Micky Gover, said that the Lockdown potentially could be longer than 4 weeks and even once this period is over, the UK will then drop onto this ‘3 Tears’ nonsense which will also crush Economic Growth. And of course we have the potential drama of the US Presidential Election which I think all kicks off on Tuesday Night for us in the UK. I guess we might know the winner on Wednesday although the worse possible outcome is perhaps uncertainty on the day and the votes being recounted and all sorts of ‘hanging chads’ craziness or something. It seems that a Jo Biden win is most expected so a Trump win could be a shock, but I am not sure how Markets would react. I think the worst thing would be if we get riots and suchlike in many American Cities as the losing side flips out and starts running amok. That is sadly quite a possibility and I picked up a story over the weekend that Walmart are removing all guns from their Store Shelves in anticipation of problems……… And then we have the spectacle of much of Europe shutting down……..I struggle to see why anyone would want to buy Equities in this environment !!!! Last Week Well I had an extremely pleasant surprise to end up gaining 0.8% for the week and this brings my Portfolio to 1.6% up since January 1st 2020; which I think is quite insane when you think about how bad things were in March and how screwed up everything is. I really can’t complain. To be fair though, I did get a bit lucky. I have a ridiculously huge position in MPAC now and Simon Thompson has been pushing this one in ‘Investors Chronicle’ this week and that pushed the price up nicely. Without that benefit I think my FTSE100 Shorts helped a lot but I would probably have been down on the week. Sometimes the luck does go my way. I am sure I mentioned this recently either on Tweets or in a Podcast or something, but I have a sneaky hunch that my Portfolio may perform better if we have a big drop on the Markets in coming weeks, than it did back in March. The reason for this is simply around how Stock Weightings have moved through recent months – what has happened is that the Stocks which are hugely impacted by C19 (OTB, HSW etc.) fell loads in March but haven’t recovered all that much so are now relatively small Positions. Conversely, the Stocks that benefit from the circumstances like TM17, TSTL etc., have grown and become relatively big Positions within the Portfolio. So if you like, over time, my Portfolio has inbuilt automatic adjusters which help overall performance. Of course I might be wrong and everything will get whacked again !! Clearly with this backdrop my Strategy stays the same and I am really not doing much apart from monitoring my Short Positions and figuring out my Tactics for how to steadily reduce them when I think the time is right and to get positioned 100% Long ready for any rebound. I don’t think we will see that for a while, but of course December, and especially around the Xmas Period, tends to be a very strong month. Other than that I am steadily building Cash as a few Dividends drop in and if I sell anything I will be just sitting on the Cash – even though there are lots of Stocks I either would like to buy, or I want to top up on. Mello Monday I saw a Tweet from David Stredder @Carmensfella saying that there was another Mello Online thing on Monday 9th November and you can sign up to this one event for £19.50 but for just £95 you can get an Annual Pass and that looks like a minimum of 15 Events, so it is a chunky discount. I watched the first Mello Monday they did and it was very good although I found it exhausting and something like 4 hours is quite demanding on the concentration. There is so much information and so many Companies and Ideas that my brain nearly exploded. I may watch this coming one if I am free next week. I think David would like me to appear on one soon so that could be a fun thing for me to do. Anyway, you can find out more at the link below: https://melloevents.com/ When the Markets are like they are, I tend to focus my time on digging out interesting Opportunities and getting a nice short list of Stocks to buy once the time is right. If you go to my ‘Little Black Book’ page on WD2 then I added a load of new Stock Ideas onto there on Friday night just gone. These Mello Events could be very useful for identifying Stocks you want to invest in, as well as picking up some useful pointers from experienced Investors with regards to how they manage their Portfolios. Blog Slate I’ve made good steady progress on that Blog about Volatility of a Portfolio and whether smoothing it down is a good idea etc., and I am hoping I can get it finished in this coming week because it has dragged on a bit. I keep getting distracted and not knuckling down on it so I better find some self-discipline !! It is actually coming along pretty well but I don’t want to rush it and end up leaving out something important – it is actually quite an interesting blog to write and some of the conclusions from it have surprised me really. I have no idea what to write after that although I am a bit tempted to do something on Income Stocks along the lines of digging through some and perhaps finding 1 or 2 potential candidates for me to buy for my Income Portfolio in 2021 (I really can’t see myself buying before that). I quite fancy doing a Blog with Stocks in it because I haven’t done one for a while. I also have quite an interest in Lok ‘n Store LOK and I might do a Blog about that which would force me to do more Research and ensure that if I do take the plunge and buy it, then I will at least know something about what I am buying. On top of that we should be recording Podcast TPI 35 at some point this week and I have a few good ideas for topics scribbled down. The response to recent Podcasts has been immense and I must thank WD Readers (and Listeners !!) for your continuing support. It is much appreciated. Obviously, you can find all the Podcasts on the appropriate page on WD2. And now another month has whizzed by, I need to update the ‘Monthly Performance’ page and I might be able to get this done but I don’t see it as a top priority really. From Periods of Previous Imprisonment As ever you can find the full slate of Blogs I have scribbled over many years on the ‘Blog Index List’ on WD2 and all the Educational ones have a link so you can find them dead easy peasy. I know there are loads of ‘New’ Readers (welcome aboard !!) and they might find this old blog about difficult markets worth reading: https://wheeliedealer.weebly.com/educational-blogs/taming-the-bear-how-i-handle-nasty-markets And this other one might be a useful refresher: https://wheeliedealer.weebly.com/educational-blogs/affirmative-action-timidity-vs-assertiveness That one has actually surprised me. When reading it through quickly just to get a sense of what it was about, it struck me that I really don’t remember writing it !! That is unusual, most of them I remember pretty well – either because they were very painful to write or because they were an interesting task. I guess that implies this one was neither !! Anyway, time for Charts and I am particularly interested in those Monthly Candlesticks…….. FTSE100 As always the Charts I show are taken from the excellent SharePad Software I use and if you click on the images they should get larger on your Screen. If you fancy using SharePad or ShareScope yourself then there are adverts all over my Websites where you can sign up and get 1 months free data, which is worth a fair bit. I will follow ‘Best Practice’ and look at the long-term picture first and then drill in, and my Chart below has the Monthly Candles for the FTSE100 and we are not exactly off to a happy start on my Charts !! My Red Arrow is pointing to a Big Black Down Candle for October and the trend is clearly down with the FTSE100 turning (pivoting) from where my Blue Arrow is on the Candle from back in June. 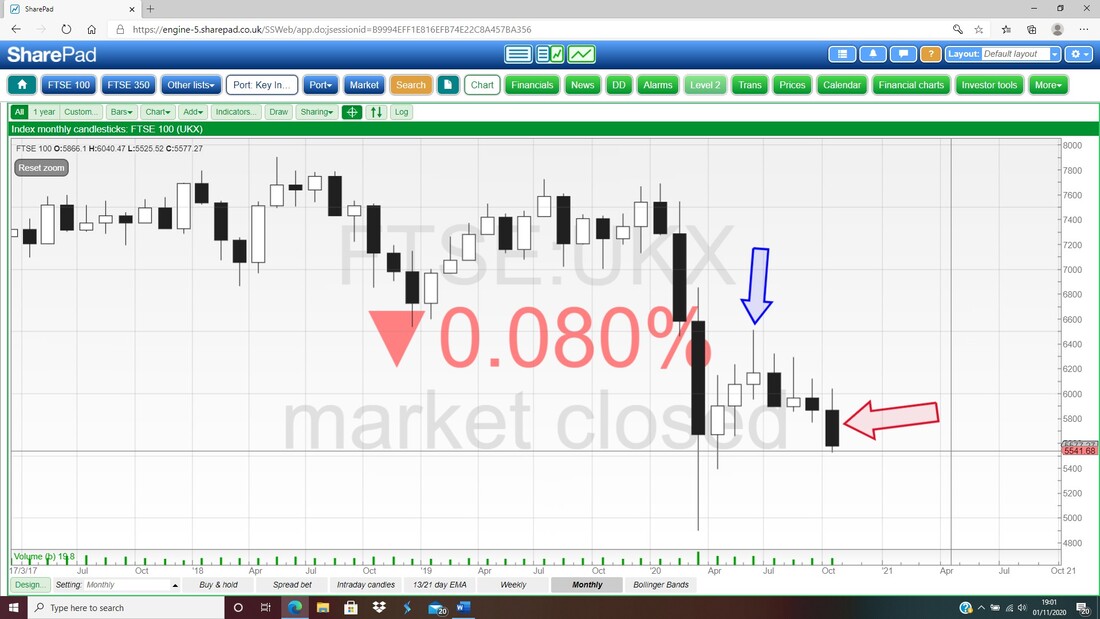
Next up the Weekly Candles for the FTSE100 and my Blue Arrow is pointing to a big Black Down Candle from last week which is clearly not a good thing. Down below that we have my Black Line (marked by my Black Arrow) at 4898 and this is the critical Support which must hold. If that fails, then it could get really ugly.
Ahead of that there is a bit of Support at 5400 and then 5250. 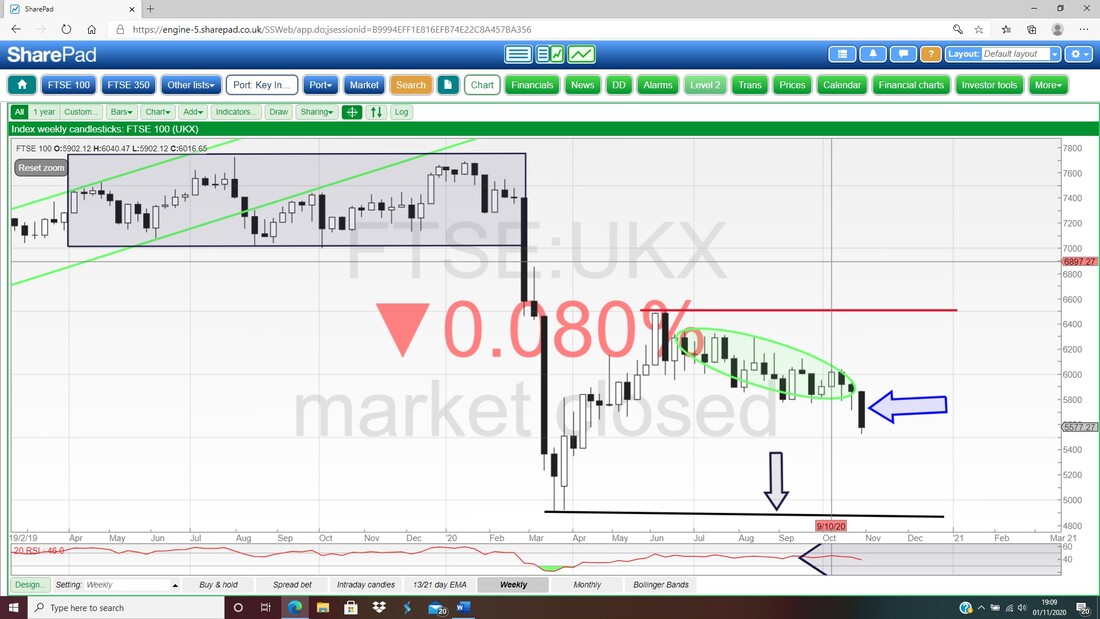
Next I am focused on the Black 13 Day EMA Line (Exponential Moving Average) and the Red 21 Day EMA Line and where my Blue Arrow is there was a ‘Bear Cross’ between these and that is still very much ‘in force’. This is one of my favourite Signals and I find it pretty reliable, and when in Bear Mode it is very unwise to be Long.
Now have a look at my sloping Green Line marked by my Green Arrow. What is interesting here is that if you were to imagine a Parallel Line down below so that we have a Downtrend Channel, then arguably we could be at the bottom of such a Channel now. I am not convinced by this but it is something to be aware of. 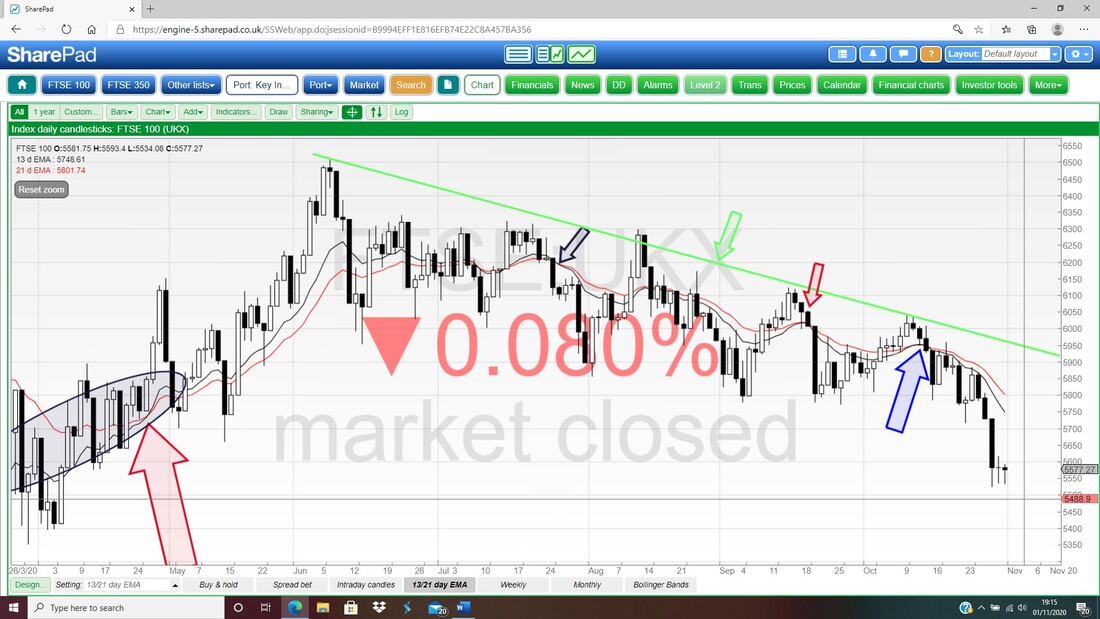
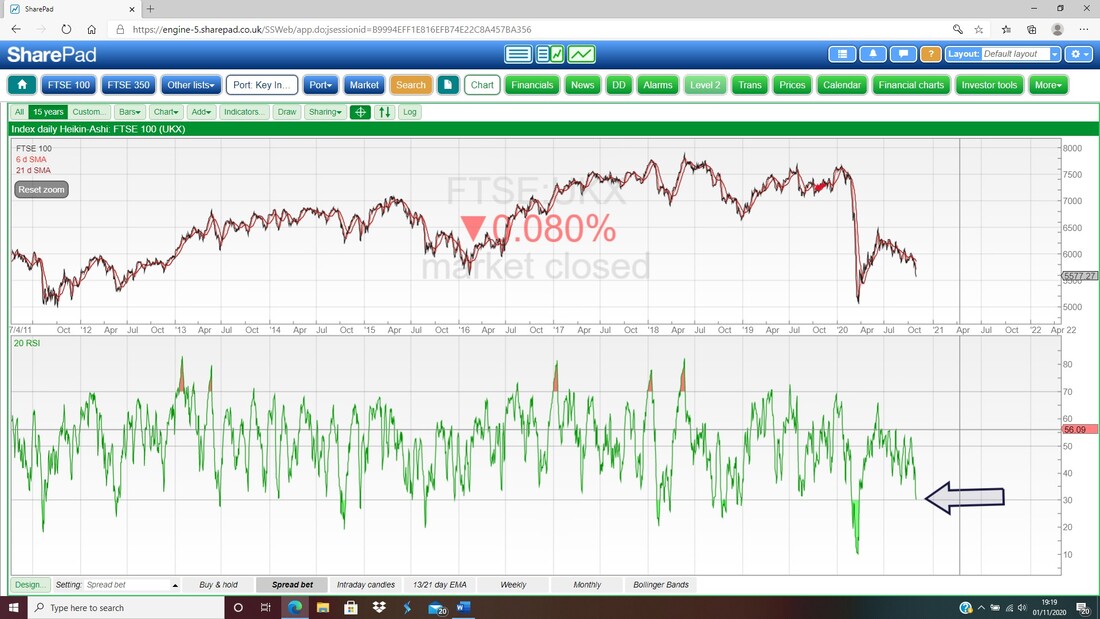
In the bottom window on my Screen below we have the RSI for the FTSE100 Daily (Relative Strength Index) and on a Reading of RSI 30 where my Black Arrow is this is ‘Oversold’ but note that in the recent past it has been much lower on several dramatic occasions, and back in March it was down at RSI 11 which is nuts.
Finally for the FTSE100 we have the Daily Candles with the Pink Zone marking the Upper and Lower Bollinger Bands. My Blue Arrow is marking a sort of Hammer Shaped Candle from Friday and note it is moving sideways and away from the bottom Bollinger Band. Perhaps the FTSE100 could move up from here but if it does so then the Bollinger Midpoint at about 5745 where my Red Arrow is could be Resistance. It is interesting that the FTSE100 was given an opportunity to rise from Wednesday and Thursday but it could only manage a sideways move – that shows some weakness.
The Low on Wednesday was 5525 and if the Market freaks out about the Lockdown and drops below 5525, then that would clearly be Bearish and set up more falls. 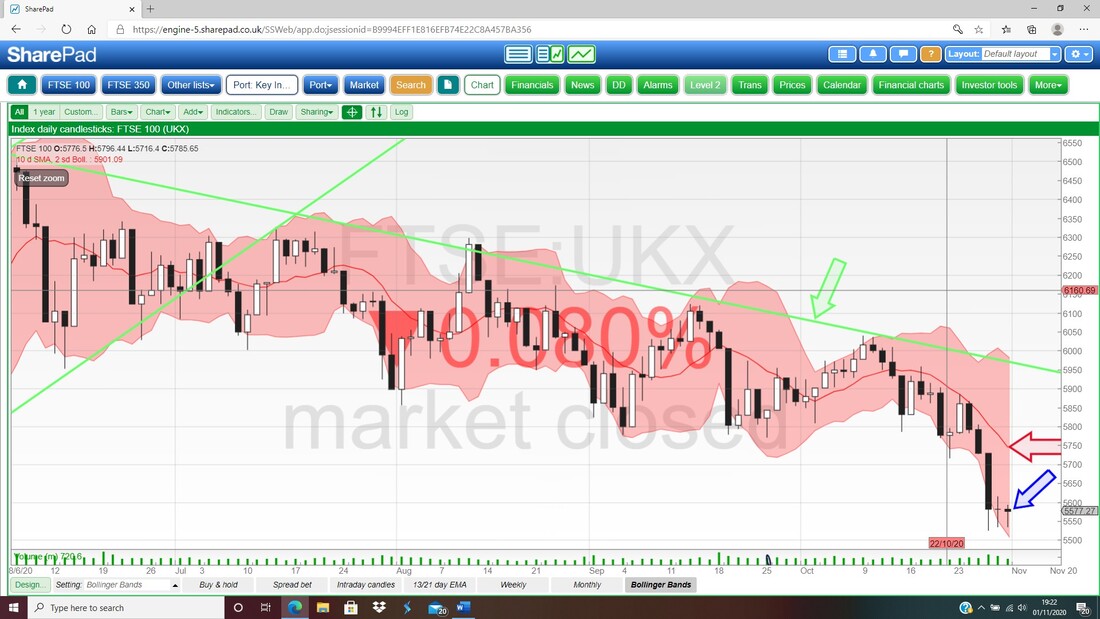
Brent Oil Composite
I keep an eye on Oil because it impacts the FTSE100 a fair bit and with my Shorts that is clearly something I must keep tabs on. First up we have the Monthly Candles and my Blue Arrow is marking a Big Black Down Candle from October and clearly this is not good. Please ignore the tiny line just after this because it is not valid as it is the start of the Candle for November (Oil trades 24 hours I think so SharePad has this slight glitch in how the data is presented). 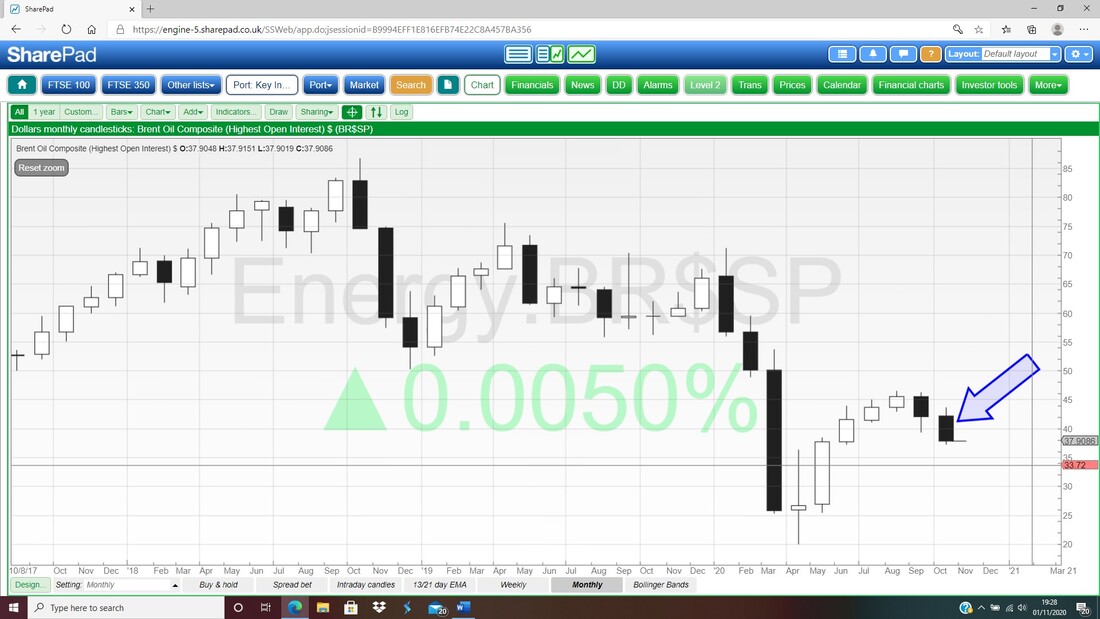
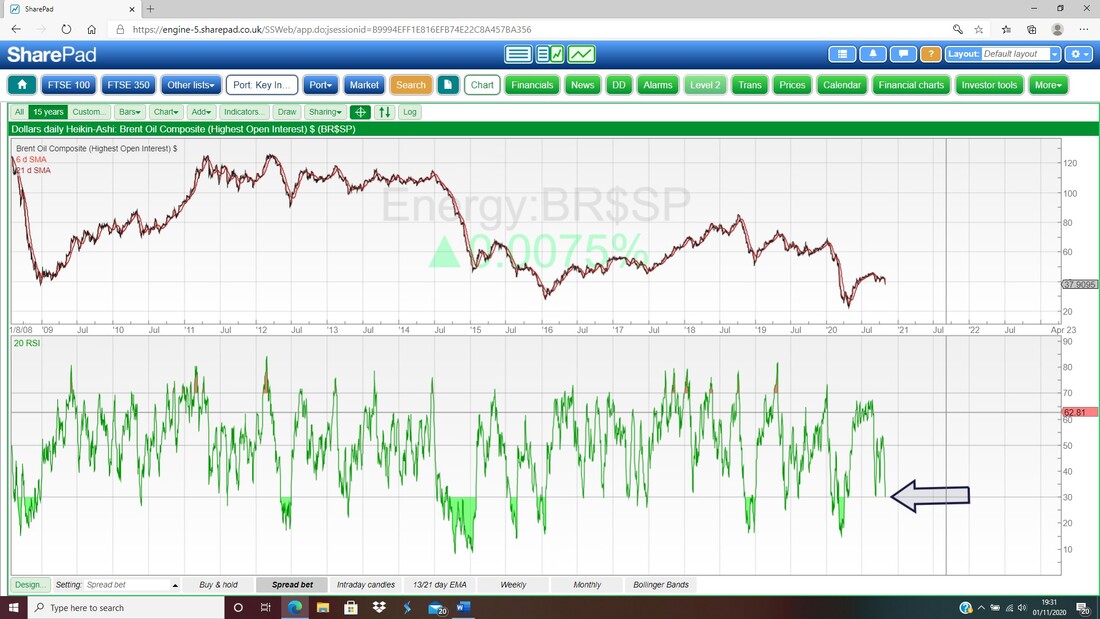
My bottom window has the Daily RSI for Brent Oil Comp – on a Reading of RSI 30 where my Black Arrow is, this is Oversold but note in March it hit RSI 15.
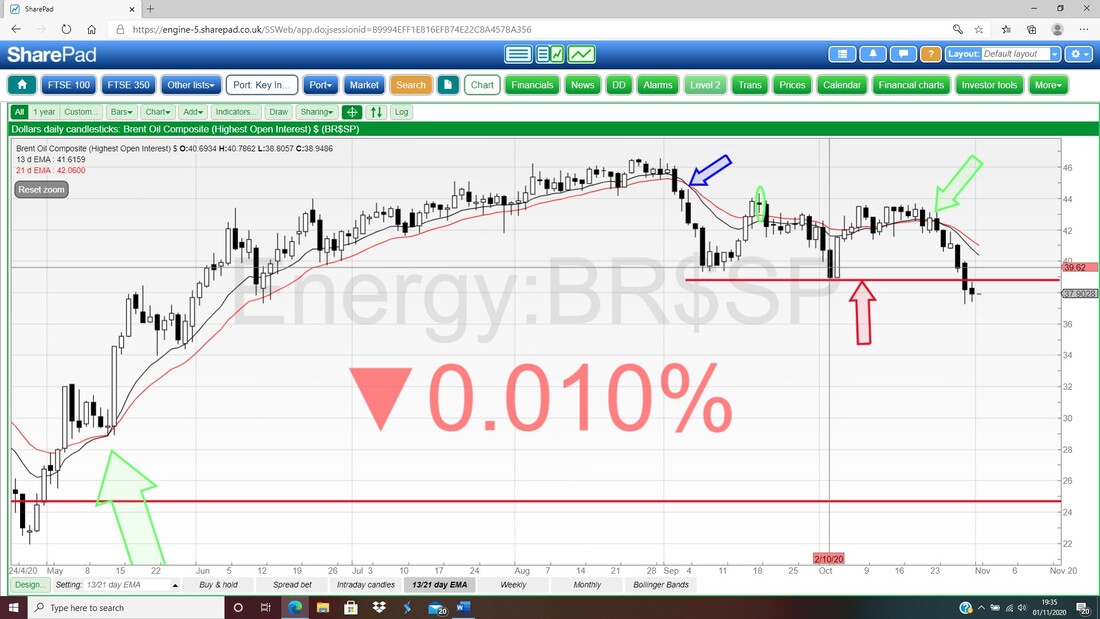
Next we have the Daily Candles for Brent Oil Comp and my Green Arrow is marking a Bear Cross between the Black 13 Day EMA Line and the Red 21 Day EMA Line. My Red Arrow is marking what was Support at about $38.8 and the failure here is not a good thing. Down below there is Support in a ‘Ladder’ around $37, $34 and $29 in particular.
S&P500
First off the Monthly Candles and the Bearish picture is confirmed here. My Blue Arrow is pointing to a ‘Bearish Shooting Star’ sort of Candle for October and after the ‘Bearish Harami’ 2 Candle pattern that we had for August and September in combination, things are clearly turning down. The Pivot seems to be that All Time High (ATH) up near 3600. 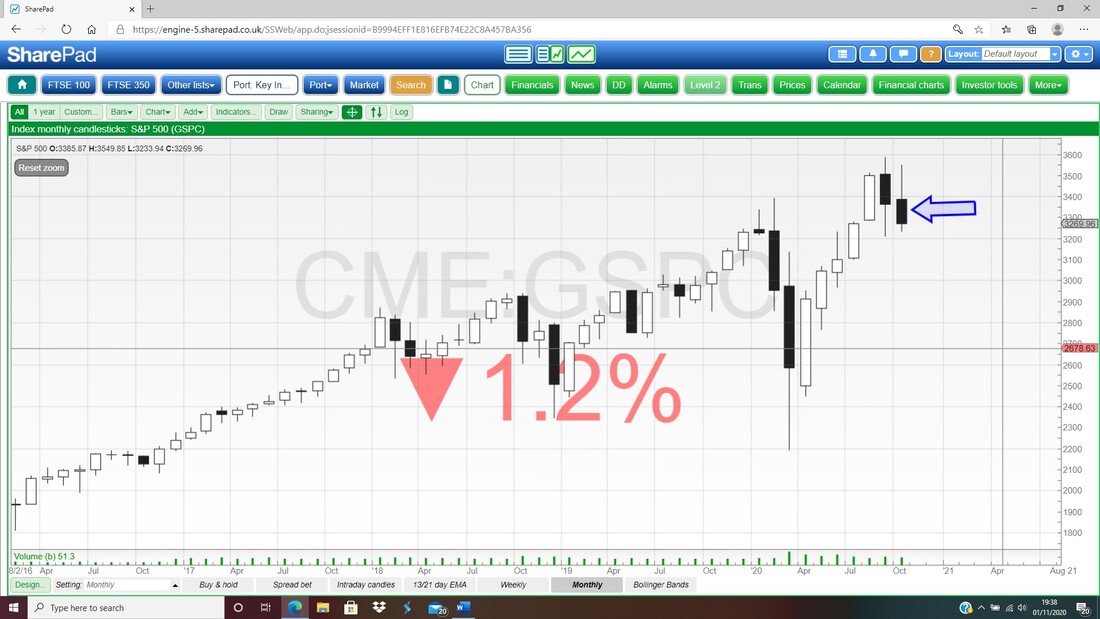
My Chart below has the Weekly Candlesticks for the S&P500 and my Blue Arrow is pointing to a Big Down Candle from last week. This has turned down off the Doji Candles from previous weeks and clearly the Trend is down here. My Black Arrow is pointing to nearby Support from that Hammer Candle at 3209.
Below this there is Support at about 2965 where my Red Line is (marked by my Red Arrow) and below that we are looking at 2721. 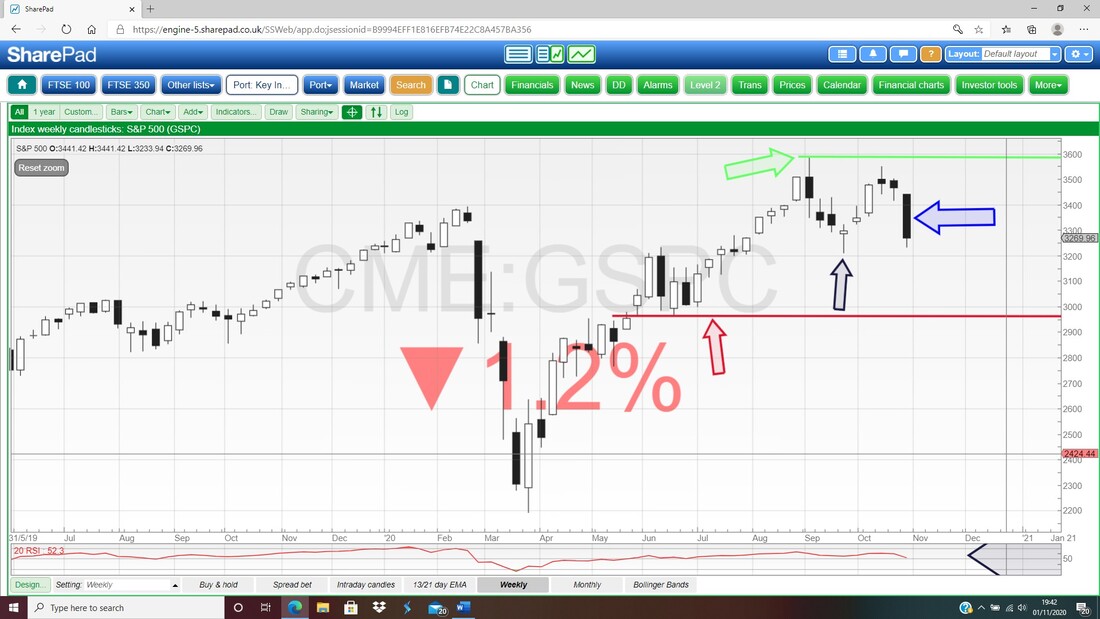
Lot on the next Chart and some really important stuff. First up we had a Bear Cross between the 13 and 21 Day EMA Lines on the S&P500 Daily where my Green Arrow is, and next if you look at the Blue Line (marked by my Blue Arrow) then this is crucial Support at 3209 and if this fails then it would be very troublesome.
This is because my Black Ellipse and Red Ellipse are marking the possible Peaks of a ‘Bearish Double Top’ pattern and the ‘Neckline’ if you like is that 3209 level – if it fails, then the Double Top is in force and would imply large falls ahead. 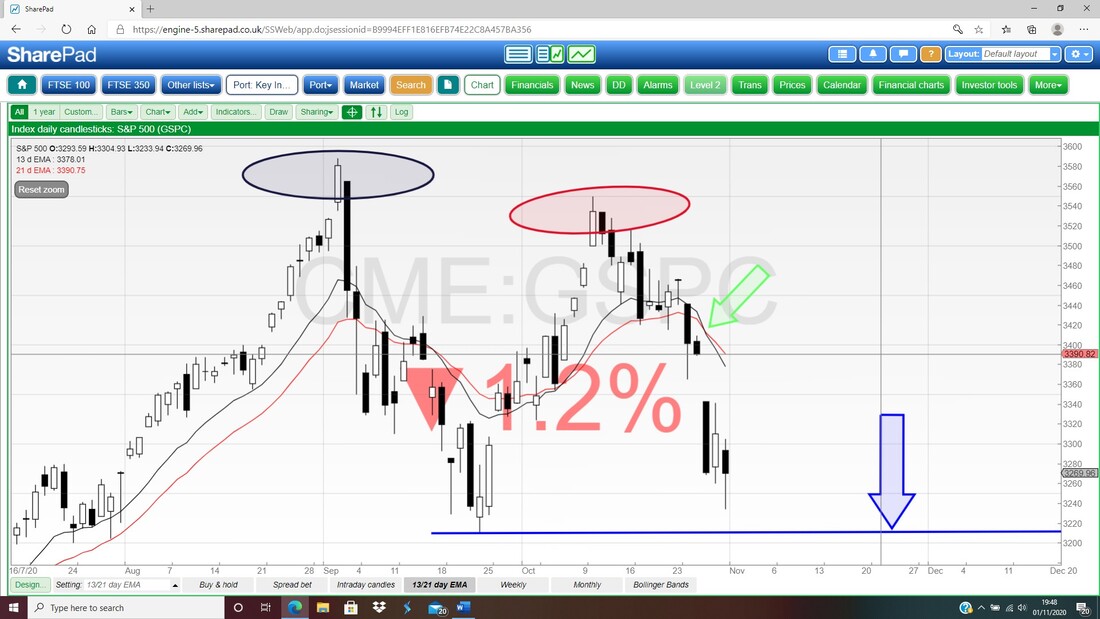
In the bottom window below we have the RSI for the Daily S&P500 and my Black Arrow is pointing to RSI 39 which is heading down but can go loads lower. Back in March it was RSI 19…….
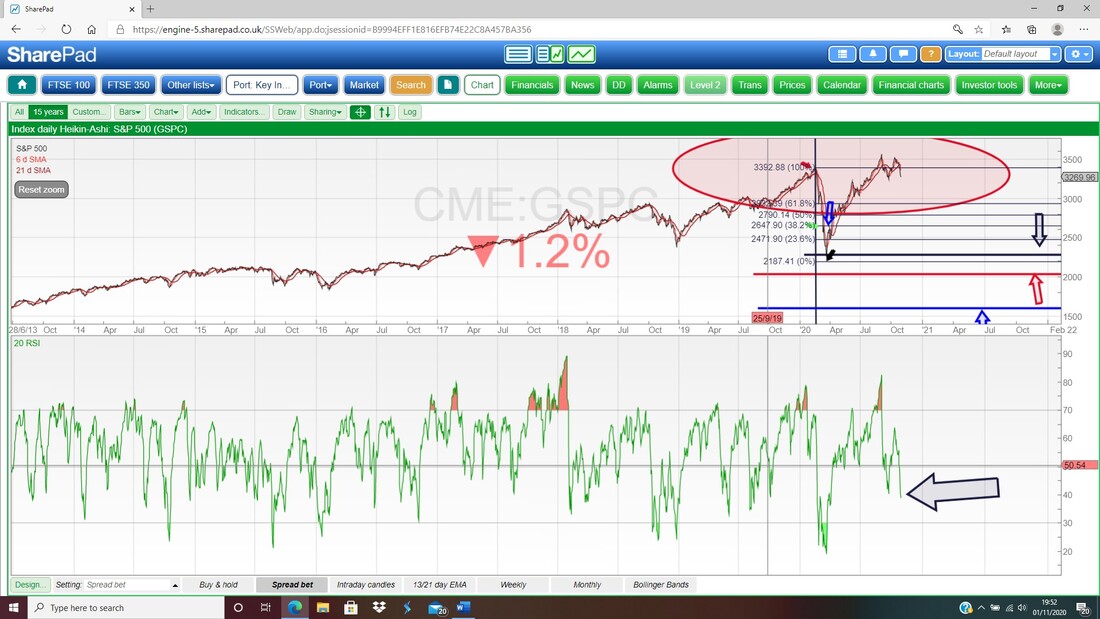
Below we have the Daily S&P500 Candles and the Pink Zone showing the Bollinger Bands. My Blue Arrow is pointing to a Hammer Candle from Friday which moved up from the lower Bollinger Band and maybe the S&P500 can try to gain off this. However, the fact it Closed down on the day is not great, and up above where my Red Arrow is, there could be Resistance from the Bollinger Midpoint Line at 3385. The Low on Friday was 3233 and that is obviously a level to watch now.
OK, I will leave it there. Good Luck for the coming week and keep your wits about you and if the Markets get moody then the best thing you can do is turn your Screen off and go and do something a lot more fun and useful. The Markets will do what the Markets will do – whether you stare at them or not. Cheers, WD. 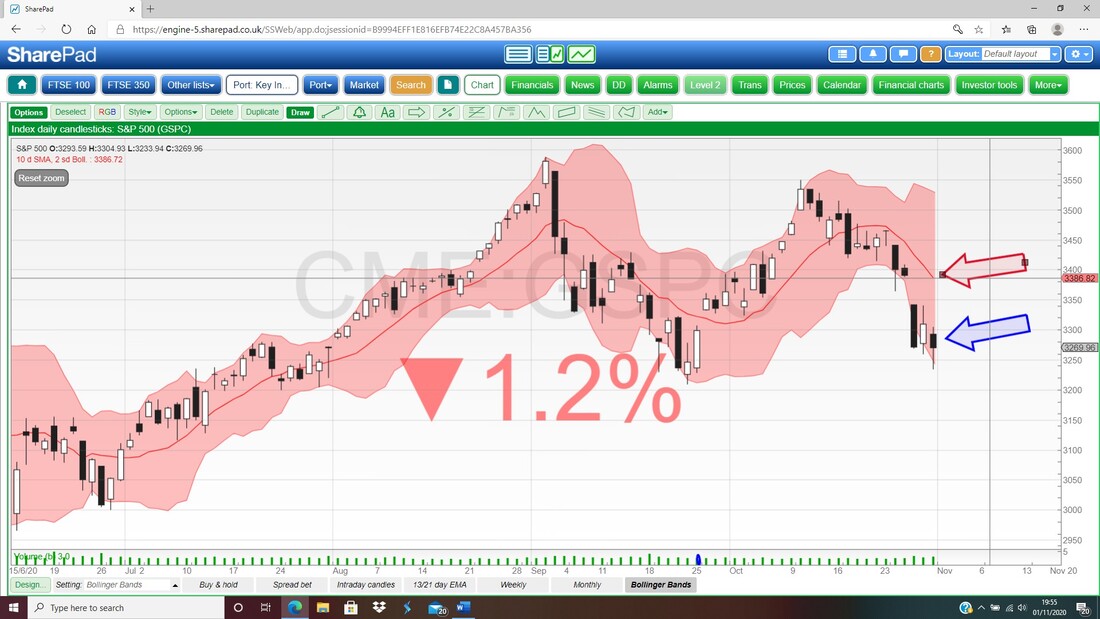
2 Comments
Kevin S
11/1/2020 02:29:59 pm
Thanks Pete - interesting as usual.
Scott (Gorney) Gornall
11/6/2020 10:29:09 am
Hi Pete, I've only recently discovered your Blog and podcasts. I'm enjoying them tremendously and find it to be a great learning resource. I realise I have strengths/weaknesses and gaps in my knowledge that I hope to fill. Leave a Reply. |

Stocks & Markets WheelieBlogsThese tend to be more Markets and Stocks related and timely - the Blog Page on the Main WheelieDealer Website has the 'Educational' stuff (well that's the theory anyway !!). Archives
October 2021
Categories
All
|
