

|
stocks & Markets blog |
|
Phew, what a week that was. What a fortnight really, but I felt the falls on Wednesday and Thursday this week in particular were extreme and if not a Final Capitulation, they certainly had the sniff off a Capitulation of some sort and there was definitely panic in the air.
After what was a very draining week for me with just the sheer intensity of staying mentally focused on the constant newsflow and developments on the Charts and suchlike and a barrage of worried people calling and Direct Messaging me; I was certainly feeling frazzled by Friday and I had to duck out to a large extent that day just to recharge.
Luckily one highlight of the week for me was picking up the divine MX5 on Friday evening after such a long wait and although it was a relatively brief drive and in the dark, I can tell there is something very special there and I anticipate a lot of fun to come. In time I will get some pics on the Website and I know many Readers are intrigued by the Hand Controls so I will make sure I take pictures of those, and with my newly discovered Microsoft Paint talents I might be able to stick some labels and arrows on it to show what is what.
I don’t want to spend too long on this Blog and a lot of writing has been covered for me in this Special Double Bill edition of Twin Petes Investing Podcast which is number 19 and comes in 2 parts. We have purposefully recorded these because we know just how strung out many Readers and Listeners are and we wanted to get something issued which would help to calm some jangled nerves and to help make sense of what is going on. As always they are unscripted but we purposefully did even less preparation than normal because we wanted to catch the authenticity and the raw emotion which you should be able to feel from them. You can find both Parts at these Links below on Soundcloud and if you use Apple or Audioboom then go to the ‘Conkers Corner’ Channel and look for anything with Number 19 on it !! https://soundcloud.com/user-479955511/conkers3-wheeliedealer-19a-winning-shares-coronavirus-ocdo-sbry-mrw-qe-gaw-futr-tsco https://soundcloud.com/user-479955511/conkers3-wheeliedealer-19b-best-investing-indicator-of-a-recovery-oil-mcs-vrs-kgp Last Week Another shocker of a week with my Portfolio taking a hit of 7.7% and without the perkiness on Friday it would have been much worse. For the year so far my Portfolio is down 24% but of course there is a long way to go on the year yet and it could get worse or it might get better by 31st December 2020. No doubt it will be a very tough time and my expectation is various Rallies that then fizzle out and plenty of choppiness. With the Global Economy pretty much put into Suspended Animation it is hard to see how Stocks can make much progress to the upside but then again the alternatives in terms of Cash, Bonds, Property etc. are not any more attractive and arguably they are worse depending on where we end up in the next few months. I am very pleased with how my Hedging efforts have gone so far and they have reduced the hit to my Portfolio by 8% but with hindsight I wish I had Shorted more. However, that is really a silly thing to say because Shorting requires Margin Deposit Cash and also plenty of ‘Cash Buffer’ to cushion a Spreadbet Account when we get vicious ‘Snapback’ Rallies and in truth I just didn’t have more Cash lying around to enable me to Short much more than I did. All good practice for the next Crash though and I am certainly pleased I spent so much time focusing on my Index Trading in recent years, because I felt that something like this would be coming almost inevitably after the Longest Bull Market ever !! Going forwards now I am not eager to do much on the Share buying side yet but I will be tracking the Index Charts and some Stock Charts all the time as per usual. If things break-down again I will Short more and if we get some decent positive Chart Patterns I might be looking to go Long on an Index with a Spreadbet but I will be very careful to keep Position Sizes (i.e. Exposure) small as things are going to be fragile for a while I suspect. If I see weakness I will Short more I expect. Blog Slate I don’t need to write a lot here because I spoke about it in the Podcast I think but I have been promising to do a Blog that looks back at 2009 and highlights various Chart Buy Signals that are worth knowing. I will do this but last week I did not get a chance to do it and who knows what the coming week will bring. It is next on the list but there is no particular rush because I suspect a ‘Proper’ Bottom is yet to either appear or be confirmed (we might have had it last week but we cannot know until things have played out a bit more). Anyway, if something happens that is important I will be tweeting about it no doubt and probably Trading on it so you will see something appear on the ‘Changes List’ on my Homepage and on the ‘Trades’ page where the detailed Trade Entries are scribbled. As ever, all my Trades get flagged on Twitter just minutes after I do them. Other than that, a mate has sent me the text for a Guest Blog which should be a useful read and I will try to get that out soon. You might find this worth reading With all this talk of Hedging and Spreadbetting and stuff you might find this old Blog worth a look: https://wheeliedealer.weebly.com/educational-blogs/how-to-use-leverage-safely-and-successfully-spreadbetting-and-cfds-part-7-of-7 It’s a long one with 7 Chunks and if you scroll down on Part 7 which that Link gets you to, then right at the bottom there are Links to the earlier Parts. Right, let’s stop the faffing and get on with Charts……. FTSE100 As per normal, all the Images are taken from the excellent SharePad software that I use and if you click on them they should get larger in your Browser and on your Mobile Screen. I want to start here because last week was quite interesting with a potential Capitulation phase on Wednesday and Thursday and many individual Share Charts looking oversold and turning up. It was interesting also that the UK and European Markets had a strong up day on Friday but the US Markets dropped back. It is unclear to me if the US will drop more and if it does whether or not it will take the UK down with it. It has struck me for a while that UK and Europe had dropped a fair bit more than the US and maybe this reflected the reality with the Virus in that they are perhaps a week or so behind how the Infection has spread over here. I wonder if it is possible that the US could fall more yet the UK and Europe Markets be relatively muted. It is possible, but normally if the US drops then we follow so it would be unusual. Fridays do weird moves though so things might be quite different come next week. I expect more ‘Bailout’ type actions by the UK and Europe and the US is about to announce a big Fiscal Package that also includes $1000 to each American so that could be an interesting occurrence. Anyway, when it comes to the Charts I don’t want to get too blinded by the ‘Fundamentals’ and my own biases and I will try to be as objective as I can be about what the Charts are actually telling us. I am starting a little bit ‘Big Picture’ but not too much as there is a lot going on in the very Short-term with these Charts. First up we have the Daily Candlesticks for the FTSE100 but I am not really interested in those here. My focus here is the Black Wavy 13 Day EMA (Exponential Moving Average) Line and how it interacts with the Red 21 Day EMA Line. I find these superb Indicators in terms of how and when they crossover and if you look at my Chart there was a nasty Bear Cross where my big Green Arrow is and after that things have just got worse. In the big scheme of things this will only look a lot more better (is that English?) when the Black Line crosses the Red Line from underneath and does a ‘Bull Cross’- so watch out for that because you don’t want to be Shorting when that has occurred. 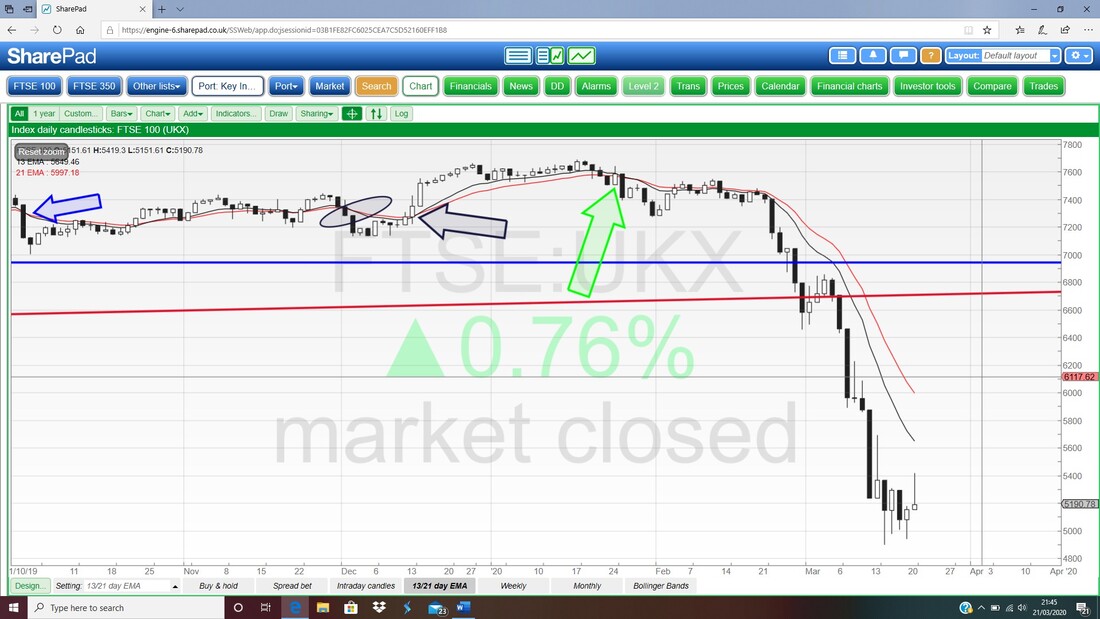
This next one is very interesting. Here we have the Weekly Candlesticks and after a massive ugly Down Candle 2 weeks ago, last week we had a bit of a Hammer which I am pointing at with my Blue Arrow. That is a good sign and could be marking a Turning Point from where the Weekly Candles rise or maybe go sideways for a bit.
The key thing here is that Support where my Red Line is at the bottom of the Hammer at 4898 – if that fails on an End of Day Close basis, then expect more falls. 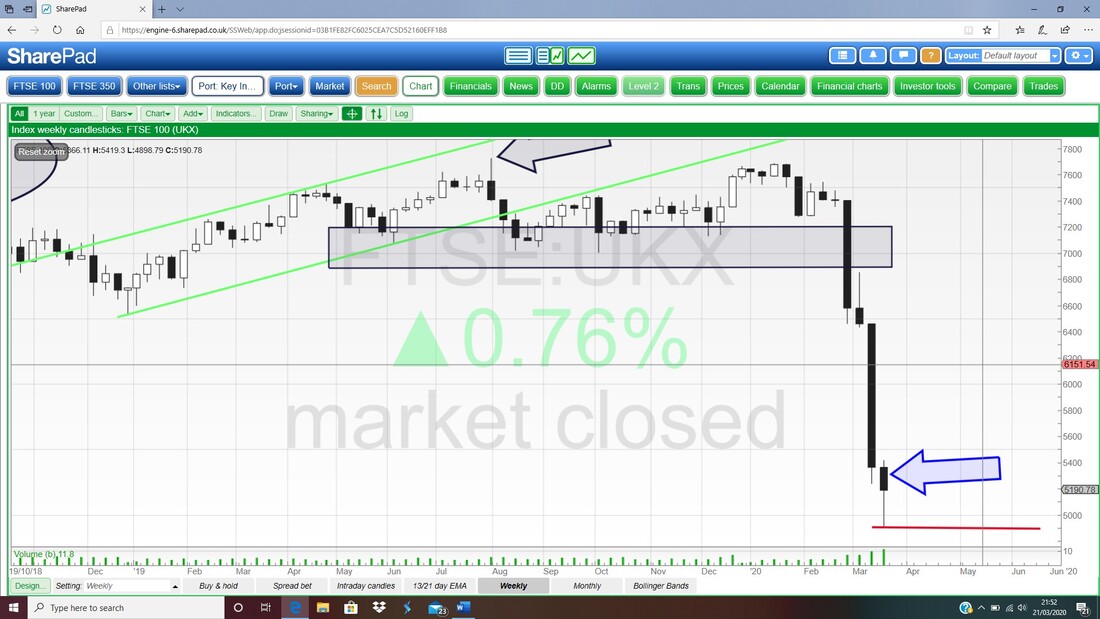
On the bottom window here we have the RSI (Relative Strength Index) for the FTSE100 Daily and on a Reading of RSI 16 where my Black Arrow is, this is heavily Oversold and a move up from here is highly likely. If you look back on the Chart there are no instances where the RSI has been this low.
Even back in 2009 it only went down to RSI 20. 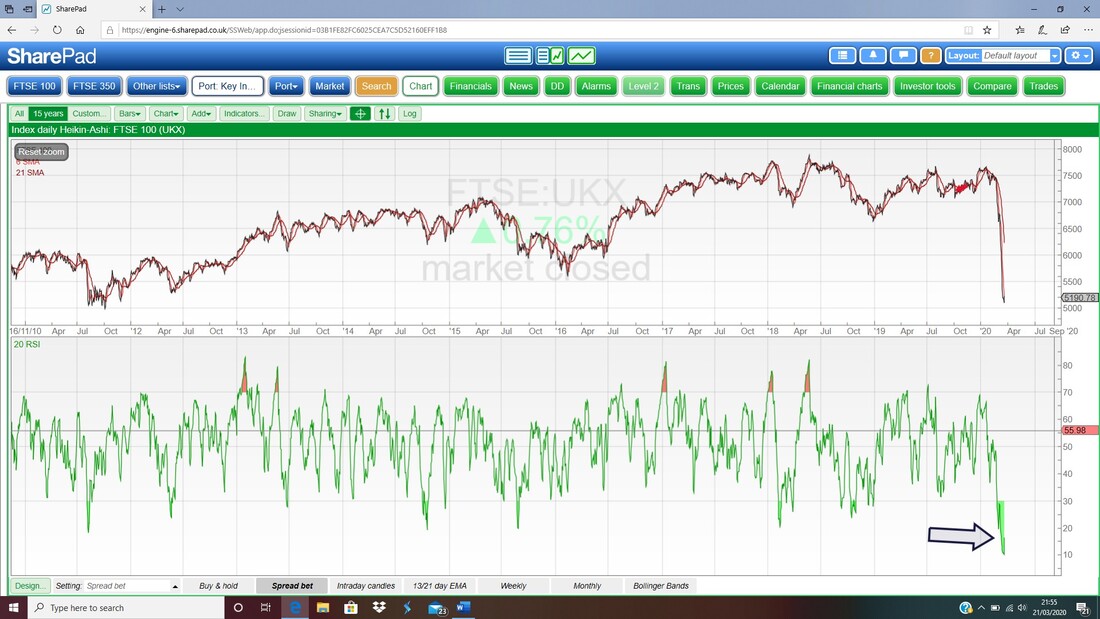
Finally for the FTSE100 we have the Daily Candles with the Pink Zone marking the Upper and Lower Bollinger Bands. My Black Arrow is pointing at an ‘Inverted Hammer’ kind of Candle where the FTSE100 was unable to hold the High on Friday. Note how it went up to the Mid Line of the Bollingers and then dropped back. Very textbook that.
If you look back at the previous 4 Candles they all are finding Support around that Green Line at 4898. That is the critical Support and must hold or we drop more and it could be a lot. The Resistance where my Blue Line is at a shade under 5700 looks difficult to get through. The Trade here would be to Short on a Break below the Support at 4898 and I might have a go at that myself if it happens. You can do it Intraday if you are brave or a Close below this would be a Sell Signal most likely as well. No Trade is easy at the moment because although things seem very weak, the Oversold nature of the FTSE100 (that RSI) and the action on Oil could complicate things a lot. We’ll see how it goes but I am more likely to Short the S&P500. 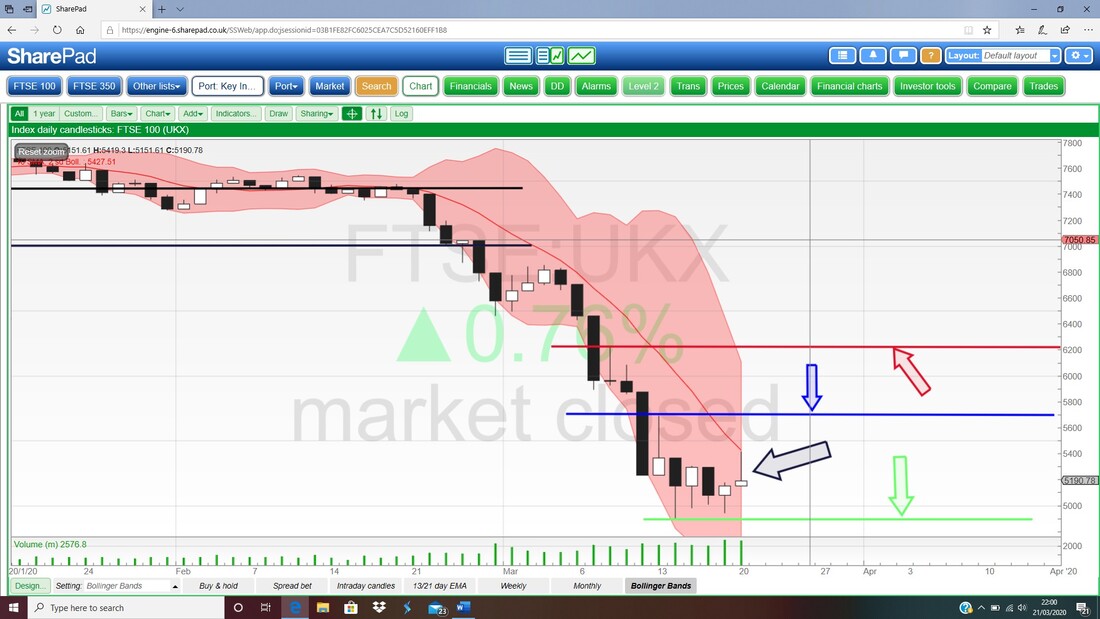
FTSE250
I won’t spend long on the FTSE250 because I want to bash this blog out quick but there are some things to note and of course many Readers and myself have exposure here and the FTSE250 has quite a bearing on how Smaller Stocks move. My Chart below has the Weekly Candles and my Blue Arrow is pointing at a Down Candle from last week with a Long Tail which is marked by my Red Ellipse. This is not a classic Hammer although the Recovery off the Lows of the week is promising. 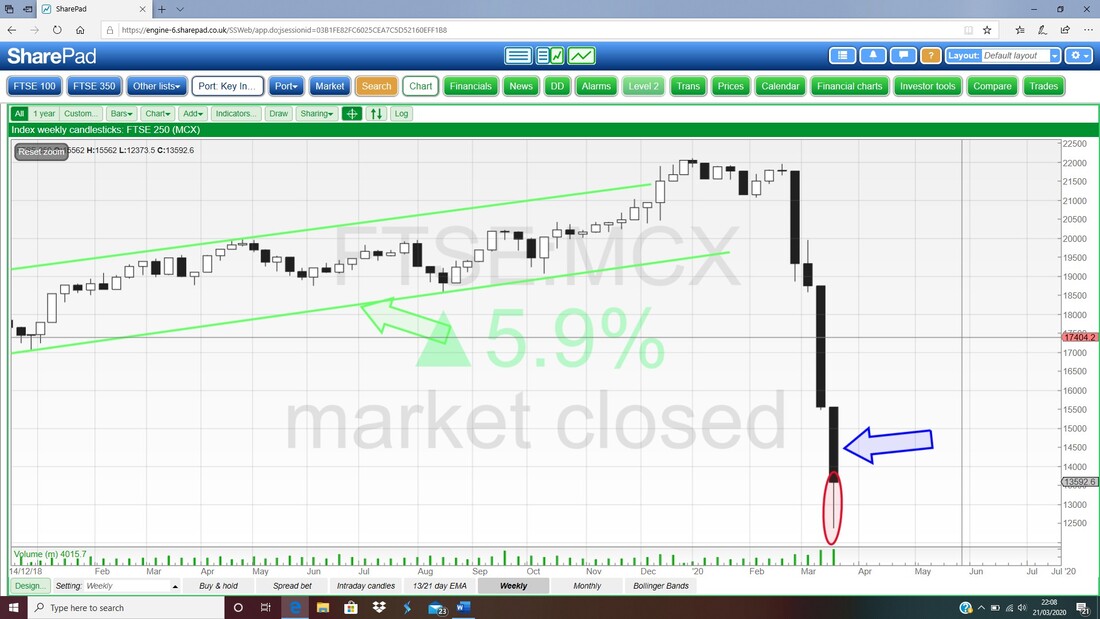
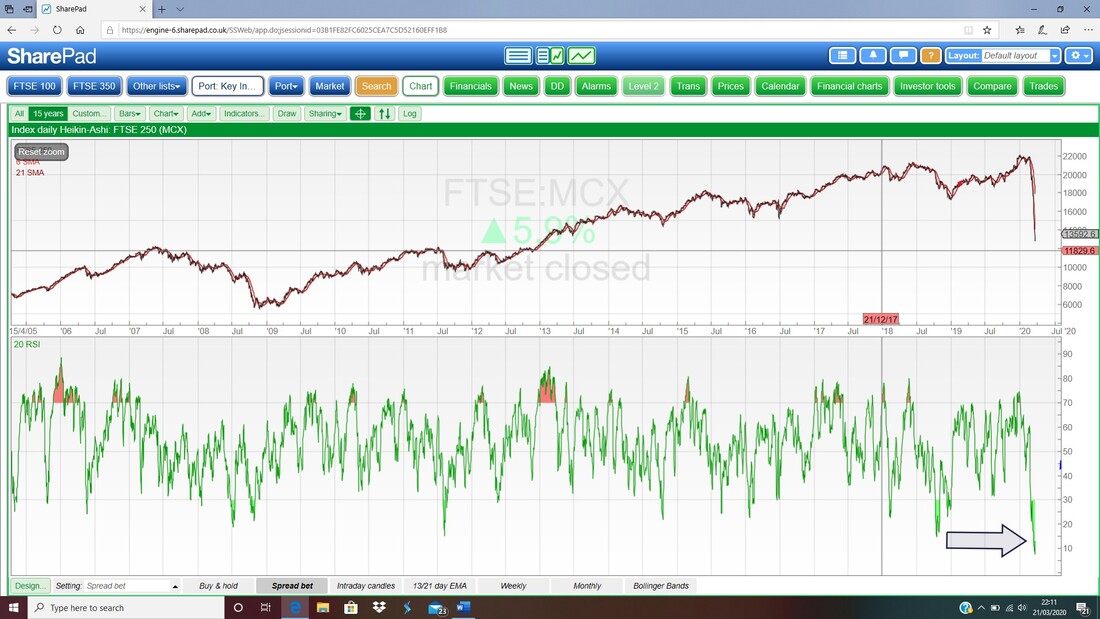
Like the FTSE100, the FTSE250 looks extremely Oversold. My Black Arrow below is pointing to a Reading of RSI 13 on the Daily which is bonkers. Look back and you will see it is the lowest Reading for 15 years, and worse than the Credit Scrunch in 2009.
To save time I have tried to whack a few Birds out of the Tree with one piece of Rubble here (don’t tell the RSPCA !!). Next up is the Daily Candles for the FTSE250 and my Black Arrow is pointing at a decent Up Candle from Friday and this turned off a Hammer from Thursday where my Red Arrow is. When combined with the Oversold RSI, it does look like the FTSE250 will attempt to build some sort of Floor here.
Unfortunately, like the FTSE100, my Blue Arrow is pointing at a ‘Bear Cross’ on the 13 and 21 Day EMAs and that suggests more weakness unless things go sideways for a while or move up a bit more. 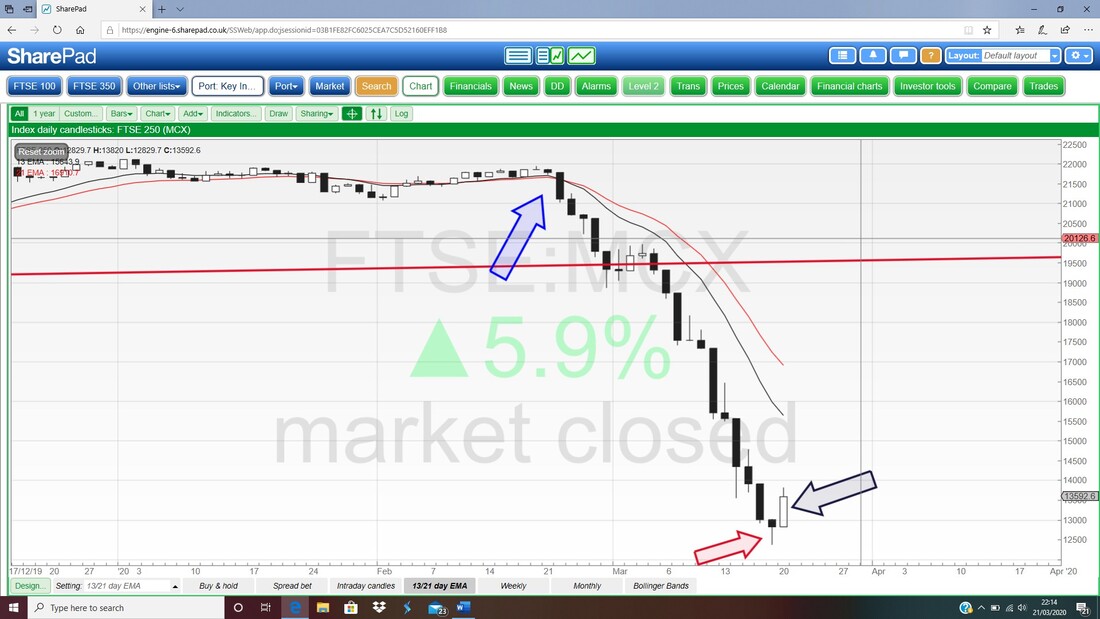
S&P500
I like to trade this one because it is highly liquid and has a lot of constituents unlike many other Indexes which only have 30, such as the DOW or the DAX. First up the Weekly Candles, and my Red Arrow is pointing at one big Ugly Devil where the S&P500 fell pretty much all week. Obviously Support at the bottom at 2280 is critical and this must hold or expect more trouble. I would probably Short if this is breached. 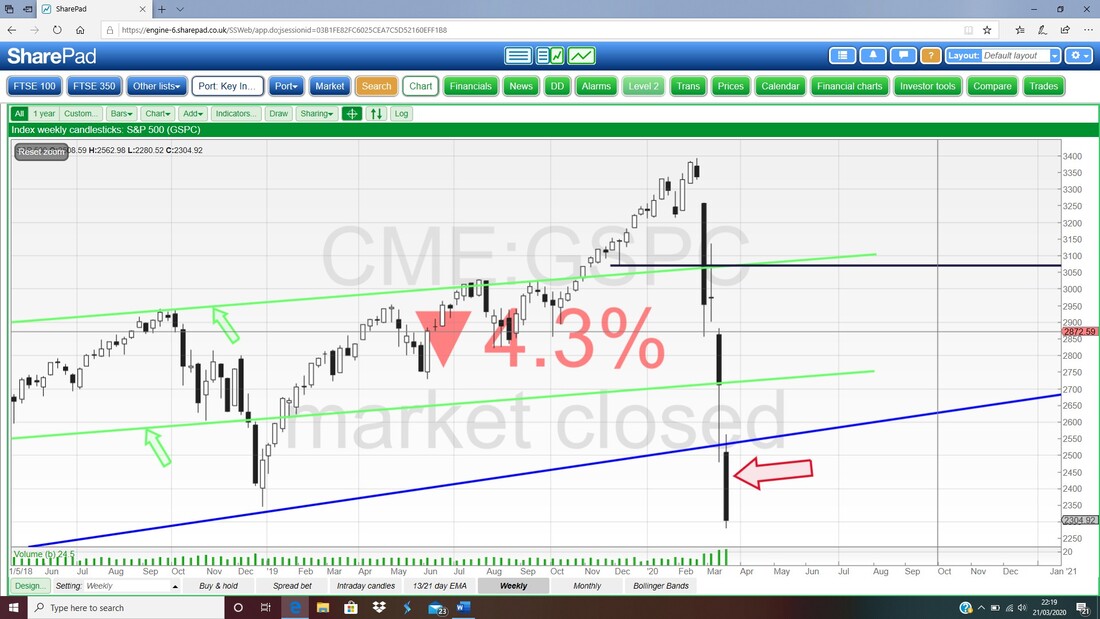
Next, the Daily Candles and the EMAs. My Black Arrow is pointing to a ‘Bear Cross’ which is still in force. My Blue Arrow is pointing at a Big Black Down Candle from Friday which doesn’t look too promising although the important thing here is the Green Support Line (Green Arrow) from the Bottom of the Hammer from Wednesday and this must hold at 2280.
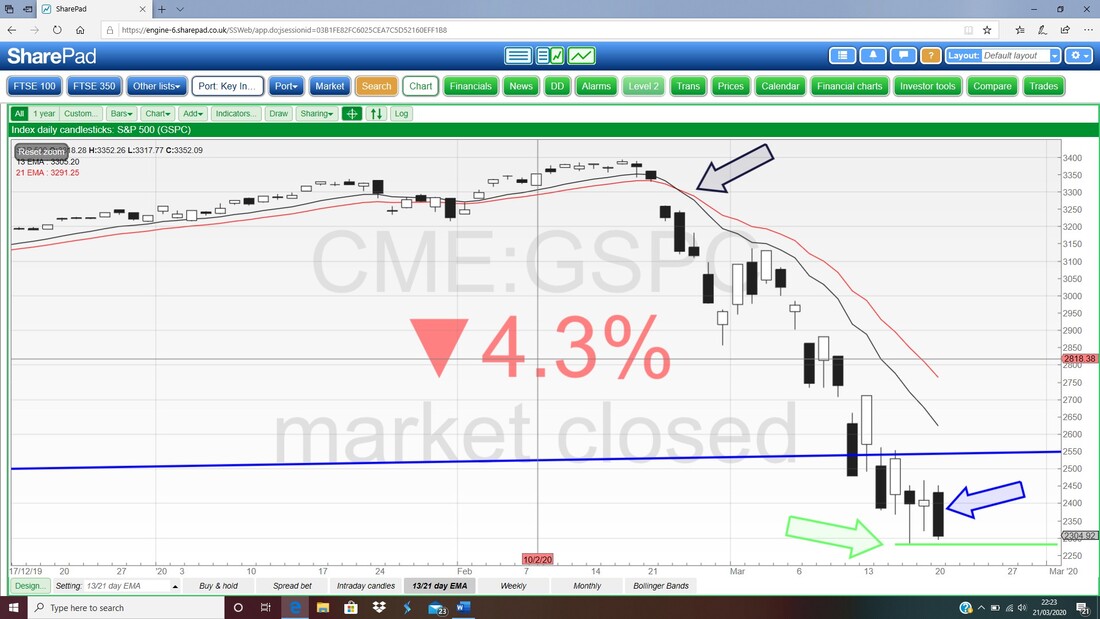
Finally, in the bottom window we have the RSI and a Reading of RSI 21 is extremely low although not quite where it was back where my Blue Ellipse is when we hit RSI 18. Maybe it will dip a bit more but we are at very low levels and at some point the Buyers won’t be able to resist dabbling.
OK, that’s it. Make sure you listen to that TPI Podcast Special as it will help your nerves and Good Luck for the coming week. Cheers, WD. 
0 Comments
Leave a Reply. |

Stocks & Markets WheelieBlogsThese tend to be more Markets and Stocks related and timely - the Blog Page on the Main WheelieDealer Website has the 'Educational' stuff (well that's the theory anyway !!). Archives
October 2021
Categories
All
|
