

|
stocks & Markets blog |
|
Well that was a ‘funny’ old week where we got off to an absolutely storming start but then it all went very smelly in the last two days and all the quick gains evaporated like a Virus droplet on a hot sunny day.
It was certainly a bit squirmy for me just after I had increased my Long Exposure via more Spreadbets (see my ‘Trades’ page) and I am currently sitting on about 145% or so Long. However, I just don’t buy the idea that because we have a couple of wobbly days, then we are going down the toilet again. I suspect it is more about people’s inability to pull themselves out of the weeds and to see the Big Picture and they are suffering from acute ‘Recency Bias’ after a few days earlier suffering chronic FOMO (Recency Bias is where we extrapolate current events into the future and cannot possibly envisage that things might actually work out differently. FOMO is Fear or Missing Out and this was clearly in evidence during the early part of the week as the Markets rocketed upwards).
I will come onto the Charts later in this Blog to flesh out the specifics, but at a high level, the US Markets are still very much in their Uptrends and the FTSE100 got spanked partly due to the surprise Shell RDSB/RDSA Dividend Cut on Thursday (Shell has a massive weighting in the FTSE100 index and accounts disproportionately for how the Index moves – and the drop in Shell was extreme by its usual standards). Friday is often a ‘weird’ day and I always say this and yesterday was no surprise in line with this.
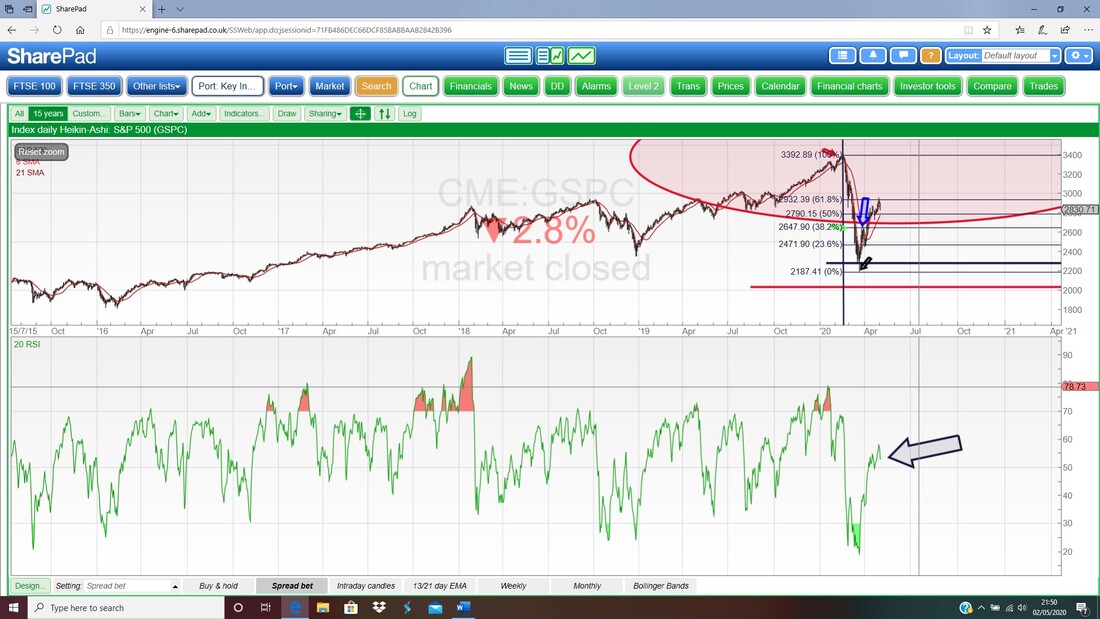
To base the idea that we are about to have a major Market Collapse on a weak Friday, which was also ‘Labour Day’ across Europe so their Markets were closed, seems like an extrapolation too far. I might be wrong. But on a balance of probabilities it is much more likely in my view (when I am allowed to have a view LOL), that Markets will avoid this huge sell-off scenario. If we think back a few weeks to when we had that utter Market shellacking (I’ve no idea what that is but it sounds nasty – ask Barrack), then we were just going into Lockdowns and the future was extremely uncertain and people just panicked and dumped Stocks and they couldn’t sell them fast enough. And nobody was buying unless things were marked down in Price massively. Fundamentally the key point here is that the overall situation was highly uncertain AND IT WAS GETTING WORSE. However, if we now fast forward to where we are today, the Outlook is quite different. Yes, things are currently extremely cruddy, but the key factor now is that we are now seeing the end of Lockdowns and an early restart to Western Economies – AND THE OUTLOOK IS NOW ONE THAT IS IMPROVING. OK, it might not feel that way at the moment but it is the simple reality – and Stocks are most likely I think to look forwards and to re-adjust to that improving situation. It is important to differentiate between sectors because some like Pubs and Restaurants and Events and Airlines and suchlike are clearly going to face an uncertain future and their Shares might take a while to respond, but other Sectors should now start to see the benefit of the Economic Engines starting to fire up again. On top of that we have a US Presidential Election year where Trump is desperate to get the Economy back on track, immense amounts of Government Money being pumped into the system and such ‘clever’ ideas as QE (Quantitative Easing) and NIRP (Negative Interest Rate Policy) which are ensuring that many big Market Players are awash with Cash and when they look at the options for where to put their Cash to work, they are repelled by Bonds, Cash and Property and the only game in town is Stocks or Gold. TINA – There is no alternative. Another thing I have got my eye on is Oil. I suspect that once Demand starts to pick up again, we will see the Oil Price start to move up with it. If we get Supply Cuts as well from OPEC or whatever, then that could result in quite a prompt move up. This could drive Stocks higher. Commodities like Iron and Copper and suchlike could have a similar effect. Last Week After all that messing about, my Portfolio finished the week down 0.5% which was a bit irritating after such a strong start. But that is what the Markets do – sometimes they go up and sometimes they go down. It is very much our job to roll with the punches and to punch back when things are in our favour. My stance is staying the same for the very short term but if I see more weakness early next week and the Charts give me the appropriate Sell Signals, then I will be closing my Index Longs and at some point I will think about doing some Spreadbet Shorts to Hedge my Portfolio. However, just to be clear, I do not think this will happen but it could, so I am thinking ahead and planning what I would do in that scenario. Flexibility of thinking is a huge advantage in this game. Oh, I must add that I actually checked my iWeb Income Portfolio Account last night and that was the first time in 2020. It is very much a ‘do nothing’ Portfolio and I was very pleased to see it was ‘only’ down 10.4% and I think that is pretty decent when you consider that it holds Shell RSDB and HSBA and both of those have been really rubbish recently. On the flipside, AZN has done really well and several of the others like PHP, IGG, TEP, GSK have held up very well. If you go to the ‘Portfolios’ page which is on WD1 then you can see more details about it and in the recent ‘Scores on the Doors 2019’ Blog that I wrote back in January you can see a Screenshot of how the Account looked back then. Blog Slate On the subject of Income Portfolios, my mate Phil (@sloan_phil on the Tweeterer) wrote a superb Guest Blog for WD Readers (and for me because it saved me writing something !!) on this subject and it has had a hugely positive response – you can find it on the ‘Educational Blogs’ page on WD1. Thanks again mate. It’s a long story and all that but I have some other stuff going on and have not been able to focus on writing any Blogs yet, but I have a particular idea or two in mind and I hope to crack on with those later this week. It’s a really weird situation but in this Lockdown I seem to have less time than I ever did before – I really don’t understand it although I must say my motivation for the basic stuff like getting up in the morning is severely impacted. This week hasn’t been helped by pants weather so I have not felt overly spirited for the old ‘carpe diem’ thing. I must say it is quite a strange time for me on the Stocks where there is not really all that much for me to do and perhaps that is partly why I am feeling a bit uninspired by Markets and suchlike. I am pretty much fully invested in my Share Portfolios and I am not in a position to be buying more Stocks on that basis, and at the moment my obsession is more with placing Long or Short Spreadbets and playing the game that way – partly because it is extremely fast and efficient and doesn’t need me to think too hard about Forecast Earnings and possible futures for a company etc. It is also a natural continuation of the focus I have put on Index Trades in recent years and learning how to get sharper at it. I am pretty sure we will have a new TPI Podcast out soon and if you have not yet heard the most recent one to be released, then you can find TPI 21 here: https://soundcloud.com/user-479955511/conkers3-wheeliedealer-21-the-winning-stock-that-is-up-161-ytd-covid19-spt-smmt-clin-otb As always if you go to the ‘Conkers Corner’ Channel on the Apple and Audioboom platforms then you should find TPI 21 there. Oh, and I must get around to that ‘Weekly Performance’ page !! I did manage to get a load of pics of my lush ‘new’ MX5 up on the site though – have a poke around, I think there are 6 new pics in all and one of them shows my Hand Controls with a brief explanation pointing to the relevant bits. At some point in the distant future I must try to take a pic with the roof down !! From previous Dark Days of imprisonment……… I dunno what happened last weekend but for some unknown reason I forgot to include a Blog from the past which I know many Readers really appreciate and it is always useful to get a refresher on something that is different to what is happening at the moment. I come back to this subject time and again. It is just so important and I think a lot of people really fail to grasp the concept and more so to put it into action. There is so much nonsense out there which doesn’t help you and it just leads you astray and wastes your time. Cut it out. There are links to the earlier bits at the bottom: https://wheeliedealer.weebly.com/educational-blogs/enjoy-the-silence-cut-out-the-noise-part-3-of-3 Time for these blessed Charts then……. The Monthlies As ever, all the Charts I show are taken from the excellent SharePad Software that I use and if you click on them then they should grow larger on your screen. An important thing to get across here is that there are several conflicting Signals and that is often the case with Technical Analysis (TA) and we need to weigh things up and take a view. An important element for me is that Bears have a superb opportunity here to take the Markets lower – if they fail again, then it will show that Bulls are very much in control and having none of it. However, I think it is another strange week as we lead into a Bank Holiday at the weekend – so that might impact on things. Anyway, April finished on Thursday and it is extremely significant because we now have completed Candlesticks for that month and we must always remember with TA that the longer-term stuff dominates over the shorter term. So a Bullish Outlook on the Monthly would tell us a lot. Of course nothing is perfect, but if you look back on my ‘Educational Blogs’ page you should find a blog I wrote about the TA Signals that mattered when the Bottom was in back in 2009 and the key things were 13/21 day EMA Bull Crosses (Exponential Moving Averages) and Bullish Formations on the Monthly. There are no guarantees that these will Signal the Bottom again but they are the best we have. So this weekend I am starting with those Monthly Candles and I will probably show quite a few of them. Brace yourselves…… S&P500 First up the S&P – I have a small Long Spreadbet on this at the moment. Please focus your eyes on the tiny Black Candle that is captured by my Red Ellipse – this is the start of the Candle for May and is based on just one day so it has zero validity and we must ignore it (TA extremists may note that it is not a great start for it to be below the High of the Candle for April but that does not necessarily mean we should be Bearish). My Blue Arrow is pointing to a huge White Up Candle for April and this on its own is Bullish. However, if you combine it with the Candle for March, then we get a ‘Bullish Piercing Lines’ 2-Candle pattern and this is obviously good for Longs. Note, a vital aspect of a Bullish Meeting Lines is that the Second Candle Closes up above the halfway point of the previous Candle – in this case we have exactly that (where my Black Arrow is pointing). 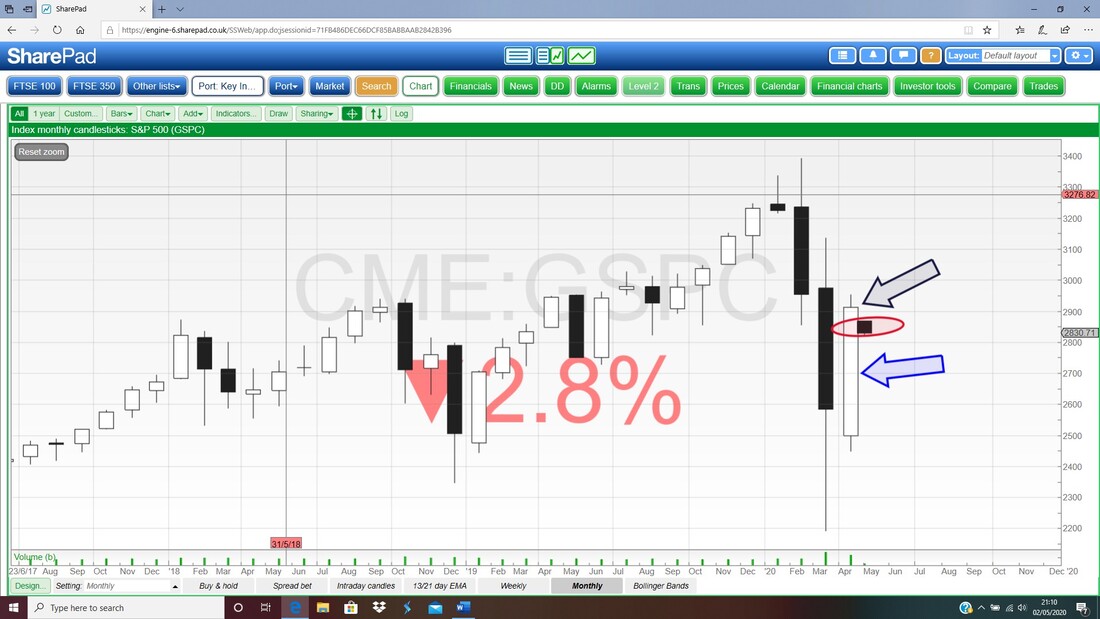
Nasdaq Composite
This is a beauty. My Blue Arrow is pointing to a Big White Up Candle for April and note how it ‘engulfs’ the whole of the Candle for March – a classic Bullish Engulfing Candle. Hugely bullish that. 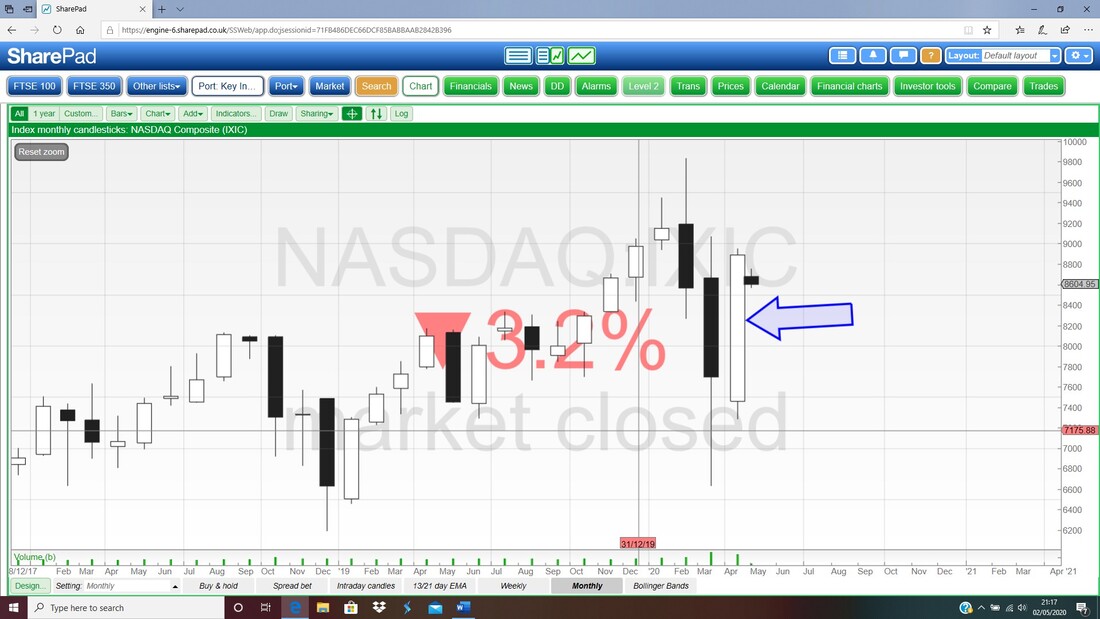
Dow Jones Industrials Index (the DOW)
Again please ignore the irritating May Candle. My Ellipse is capturing another Bullish Piercing Line 2 Candles pattern although this time it is not as pretty as the S&P500 one as the High is only just above the Halfway point (pointed at by my Black Arrow). 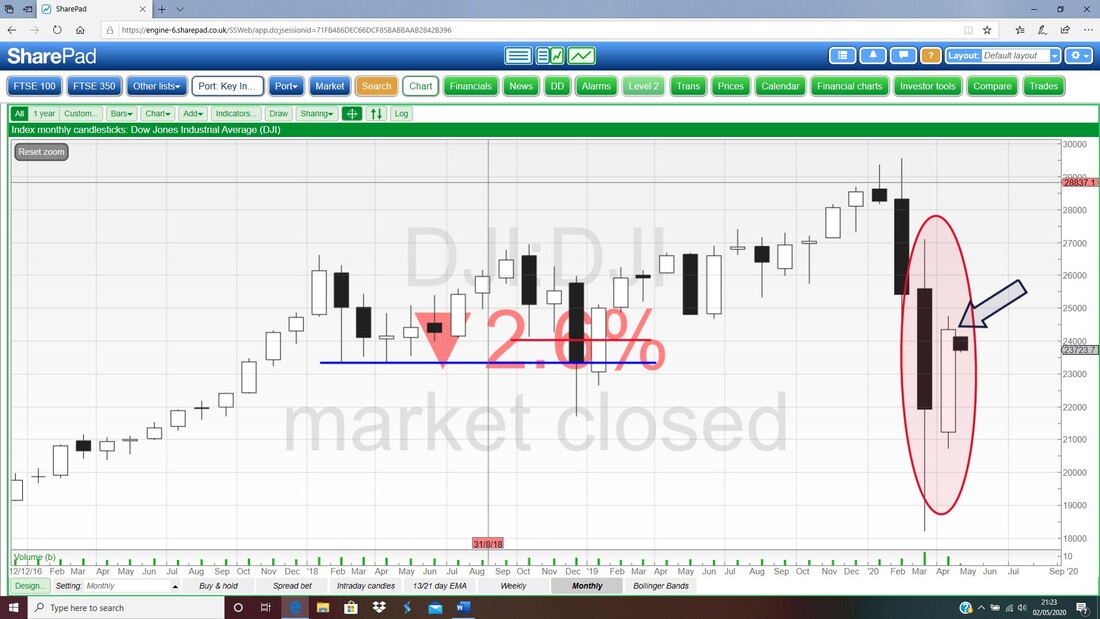
Brent Oil Composite
Of course we can use the same technique on stuff other than Indexes and Brent Oil throws up an interesting result as well. Again ignore the May Candle, and my Blue Arrow is pointing at a ‘Long Tails Doji’ from April and after the 3 falling Candles beforehand, this could be a Turning Point upwards. Note the Low at $20 – my hunch is that this will hold and is a key reference level if Oil comes under pressure again. As Economies start to fire up once more, I think we could see Oil at least find some stability. 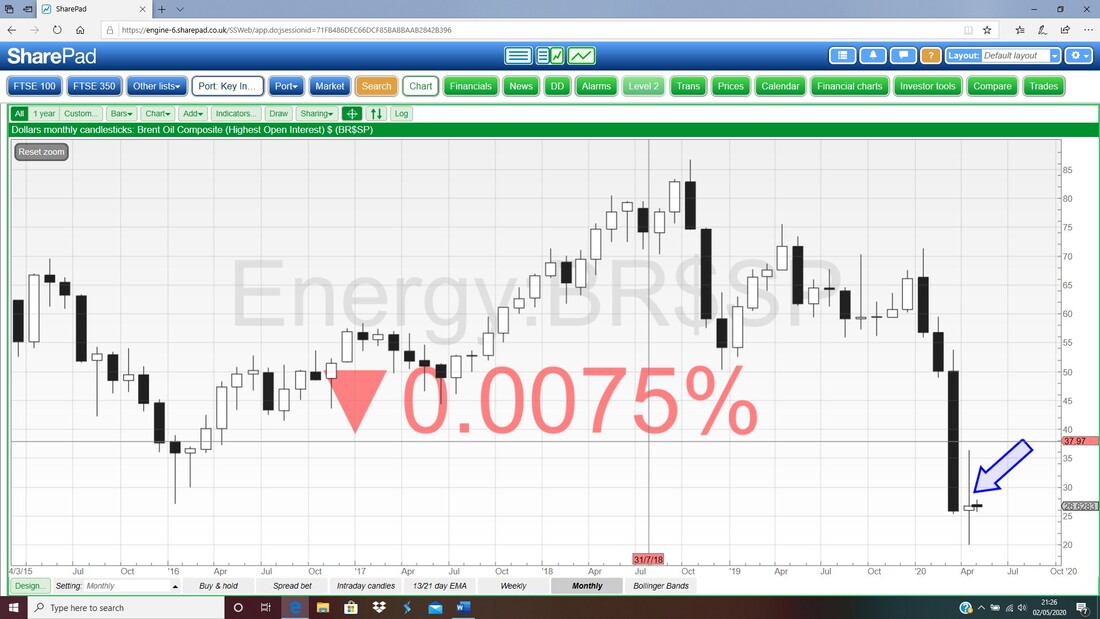
DAX (Germany)
My Ellipse is capturing 2 Candles that are probably just about a ‘Bullish Piercing Line’ pattern. It is marginal because it only just reached the halfway point on the April Candle. Note there is no irritating May Candle because the European Markets were closed for Labour Day. If we see US and UK Markets rising off these Bullish Monthly Candles, then I suspect that the DAX will be dragged along with the tide. 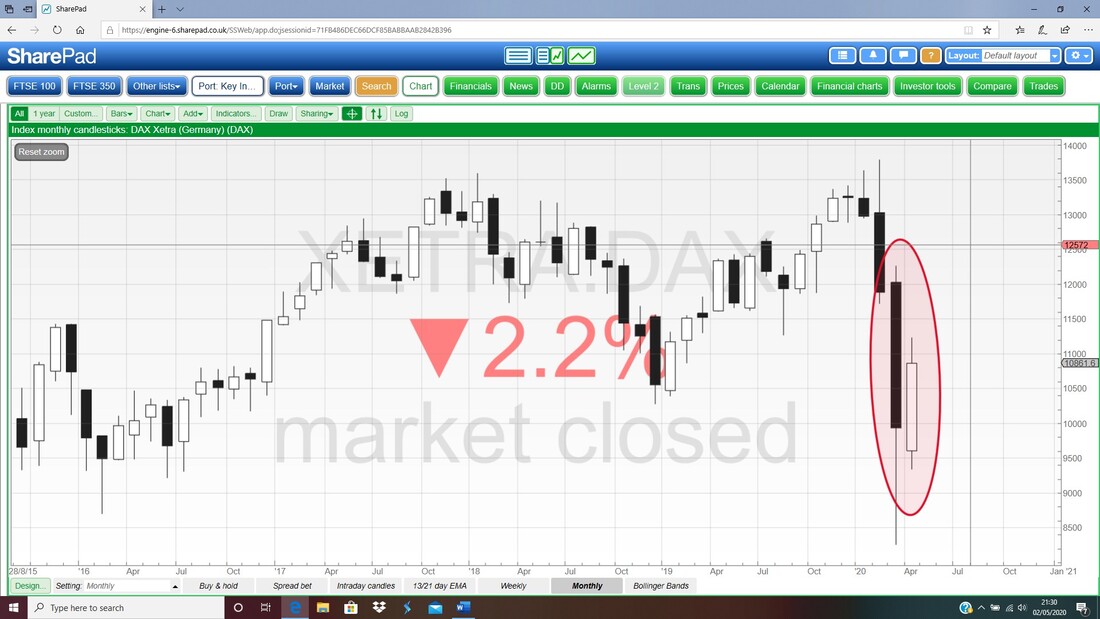
CAC40 (France)
Like the DAX, this one is not so clear cut as a Bullish Signal and if anything it could even be Bearish. It is not impossible for other Indexes to rise yet the CAC40 to drop, but that would be hugely unusual. From the Bullish viewpoint the combination of March and April’s Candles could be seen as a ‘Bullish Harami’ (albeit a messy one) but from the Bearish viewpoint it looks like a ‘Bearish Thrusting Line’. As I said, my hunch is that it will follow what the other Indexes do. 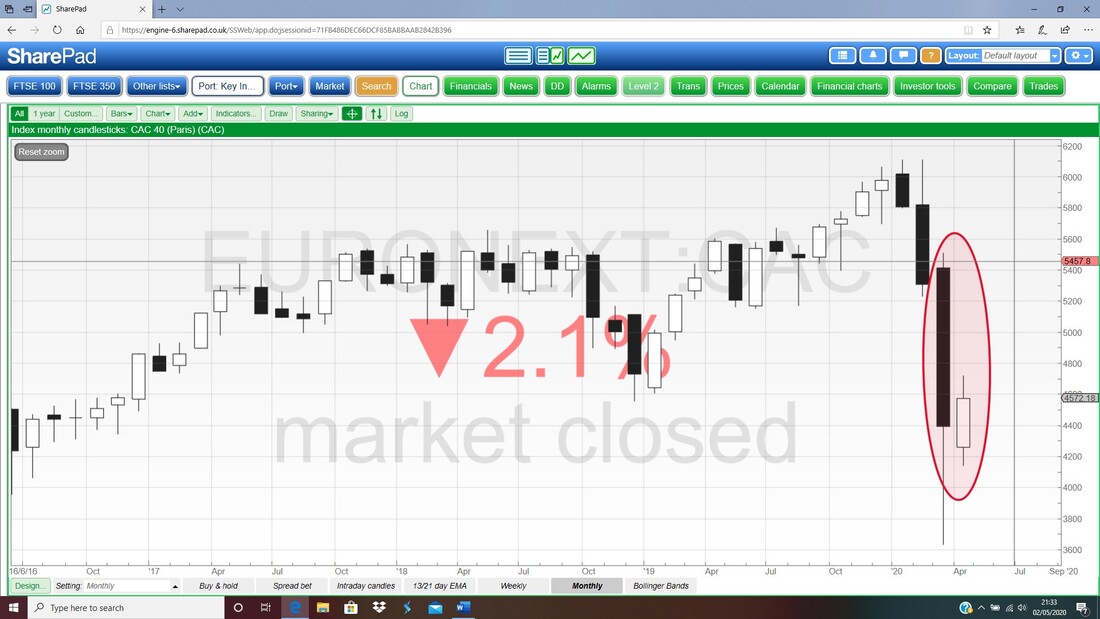
NIKKEI 225 (Japan)
My Ellipse is capturing another Bullish Piercing Line formation. 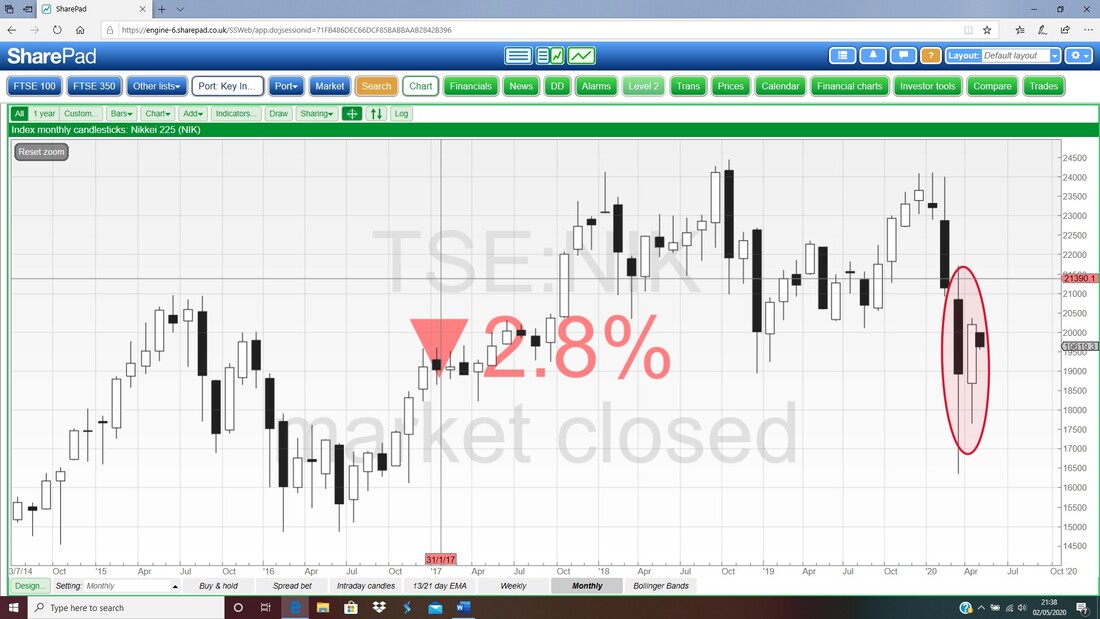
FTSE100
Ah, that’s more like it. A great example of a Bullish Harami on the 2 candles. 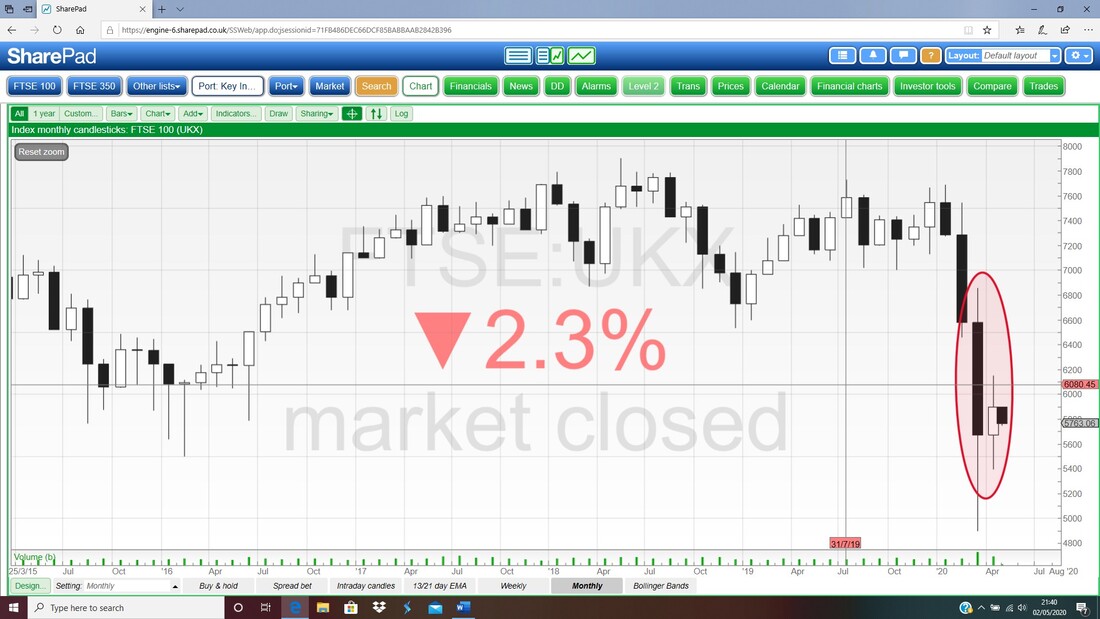
FTSE250
Bullish Harami again. 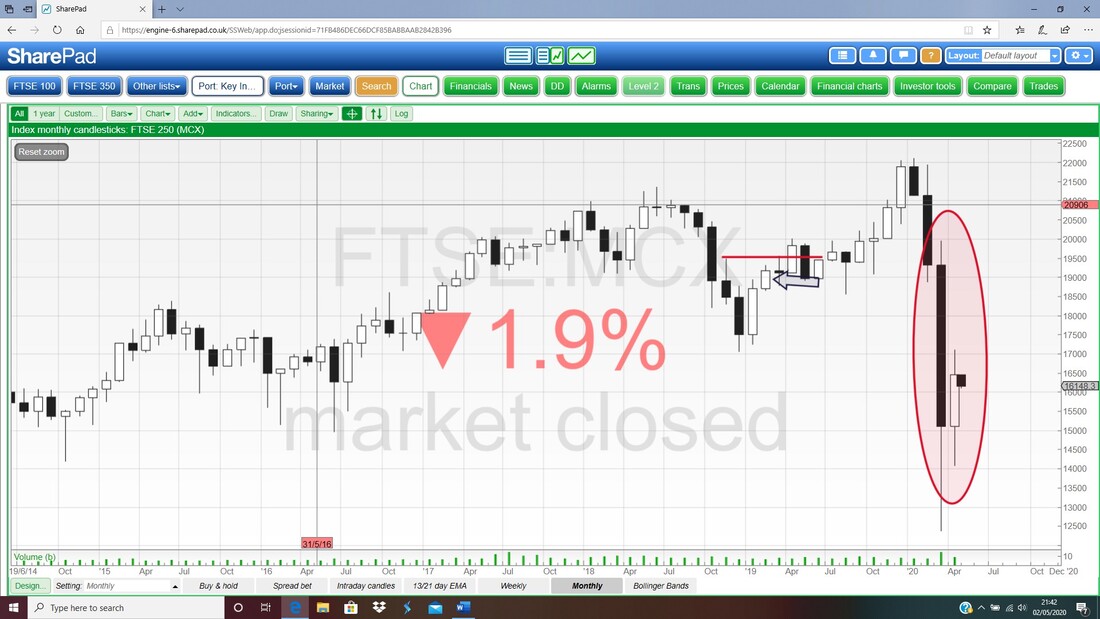
OK, so you should get the picture. The CAC40 is a bit weird, but otherwise there is a consistency here. Now I will look in more detail at the S&P500 and FTSE100 because I have Long Spreadbets on both of these.
S&P500 Below is the Weekly Candlestick Chart. My Red Ellipse is capturing a ‘Bearish Shooting Star’ from last week and this suggests a drop is coming. If it does fall from here, then we cannot know how far it can drop and this comes back to the inconsistency among TA Signals that I mentioned earlier. It is very possible to be Bearish in the Short-term as per the Weekly but to the Bullish on a longer timeframe from the Monthly. But remember, the Monthly dominates. Important Support here comes from the Low of the Candle from the Week before which is at 2727. 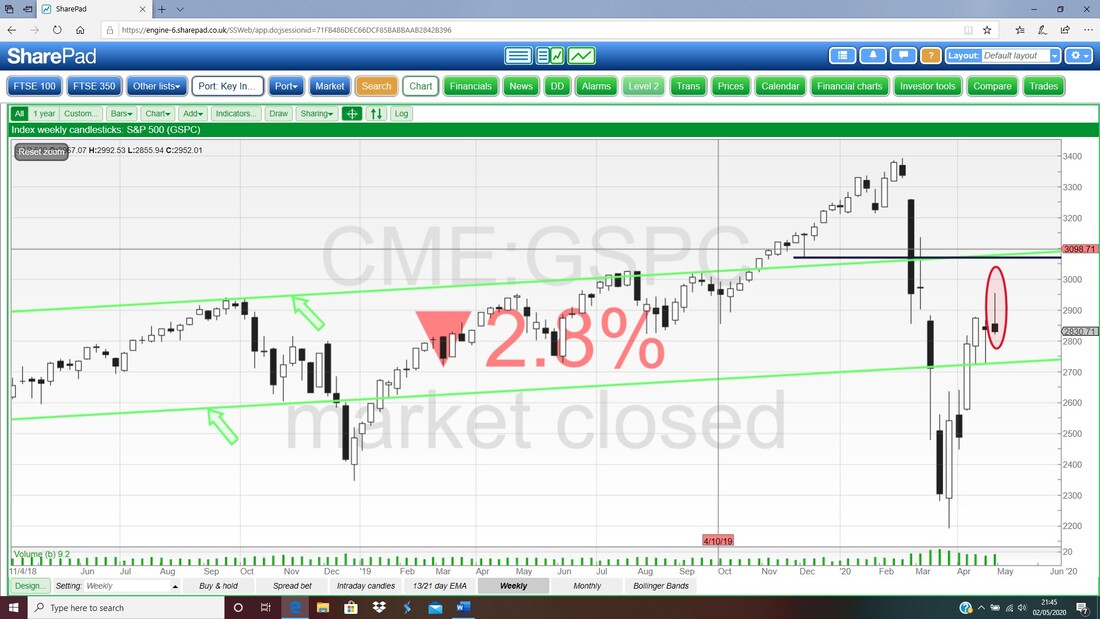
Next an extremely useful and reliable Indicator. My Red Arrow is pointing to a ‘Bull Cross’ between the Black wiggly 13 Day EMA Line and the Red 21 Day EMA Line. These are highly predictive and suggest more upside. This picture only changes if we get a Bear Cross like we did where my Black Arrow is.
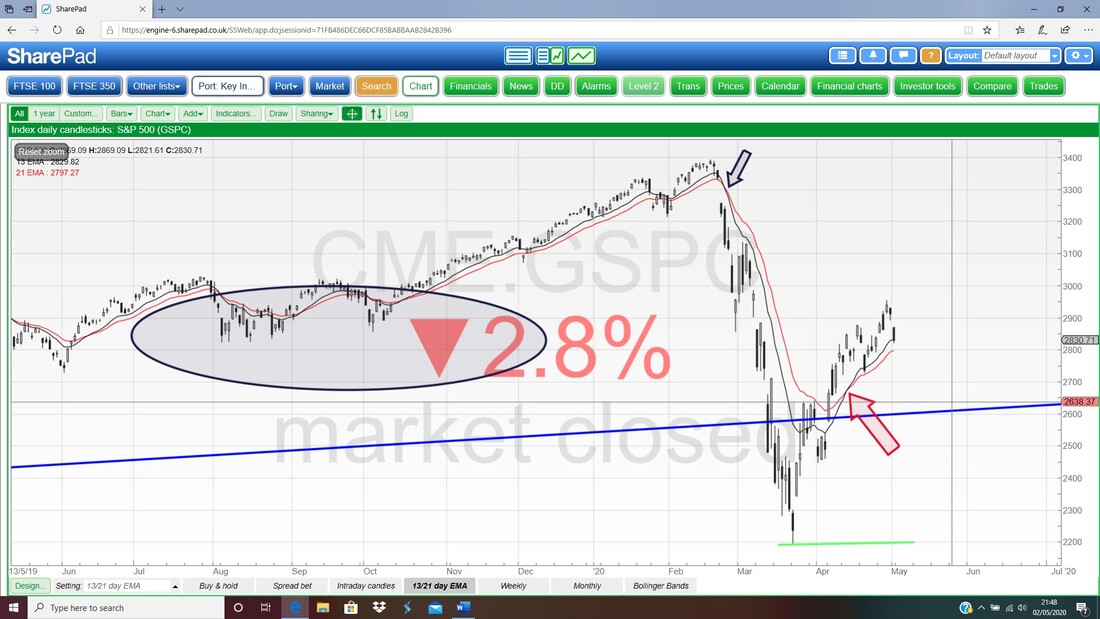
In the bottom window on the Screen below we have the RSI (Relative Strength Index) for the S&P500 Daily. On a Reading of RSI 53 where my Black Arrow is, this is around Neutral and not Overbought nor Oversold.
Last up for the S&P500, the Daily Candles with the Pink Zone marking the Upper and Lower Bollinger Bands. My Black Arrow is pointing to a small Down Candle (bit of a Doji really) from Friday and note the bottom Bollinger Band is at 2730 and this could be Support.
Lower down in the bottom window, my Blue Arrow is pointing to the Volume from Friday and it was relatively low. The time to be really worried is when we have a big down day with a huge volume spike. 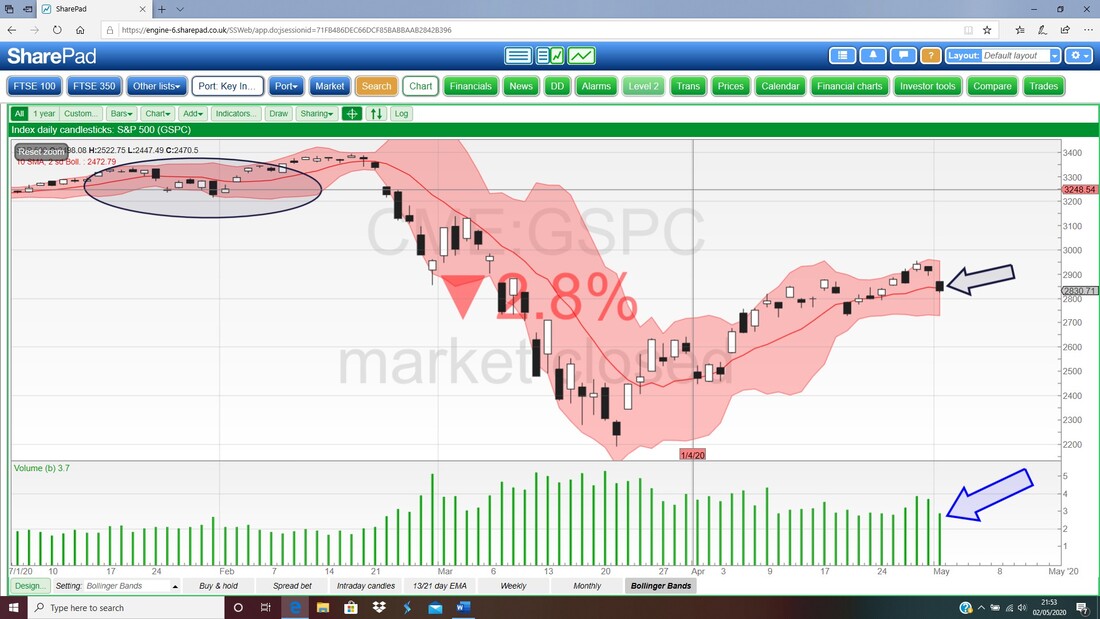
FTSE100
First the Weekly. My Blue Arrow shows a horrible looking ‘Bearish Shooting Star’ and clearly the High here at 6150 ish becomes difficult Resistance. However, take note that the Candles from the 2 Weeks before were Hammer Shaped things also and really show that this Market is chopping about a bit. To the downside, there is Support at 5576 and 5415. 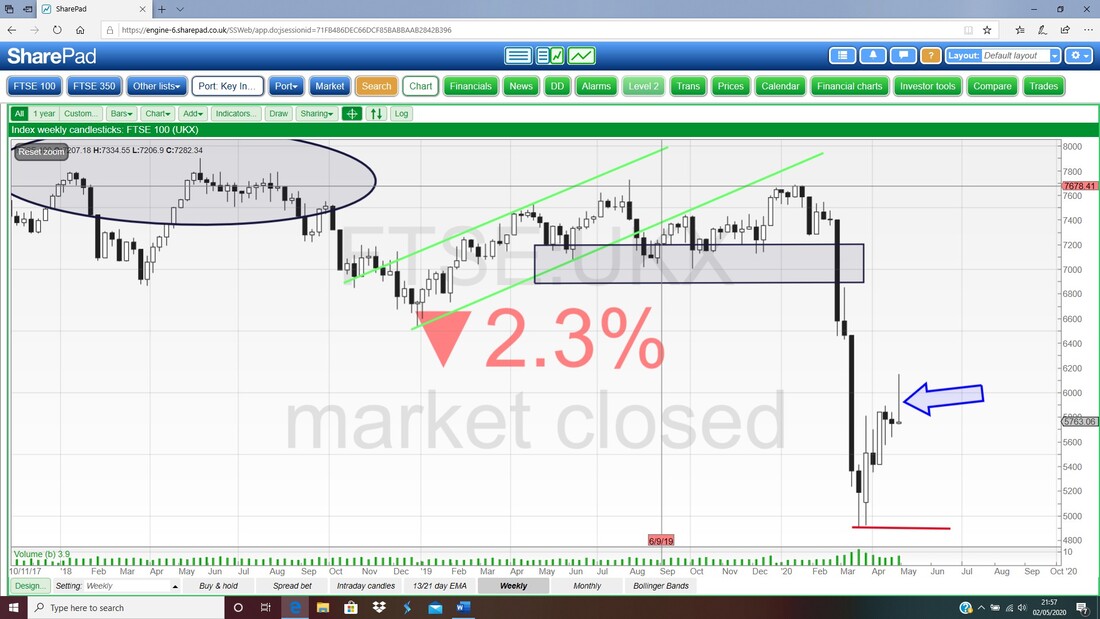
Next the 13/21s – my Red Arrow is showing a Bull Cross but note how it is very near a Bear Cross now – if we see weakness on Monday and Tuesday, then this would trigger a Bear Cross and I would not want to be heavily Long then especially on the FTSE100.
I find that the early days of a Bull or Bear Cross are a ‘dangerous’ period – it doesn’t take much weakness or strength to result in the opposite Cross very fast. Once a Cross is more established, this risk seems to reduce. 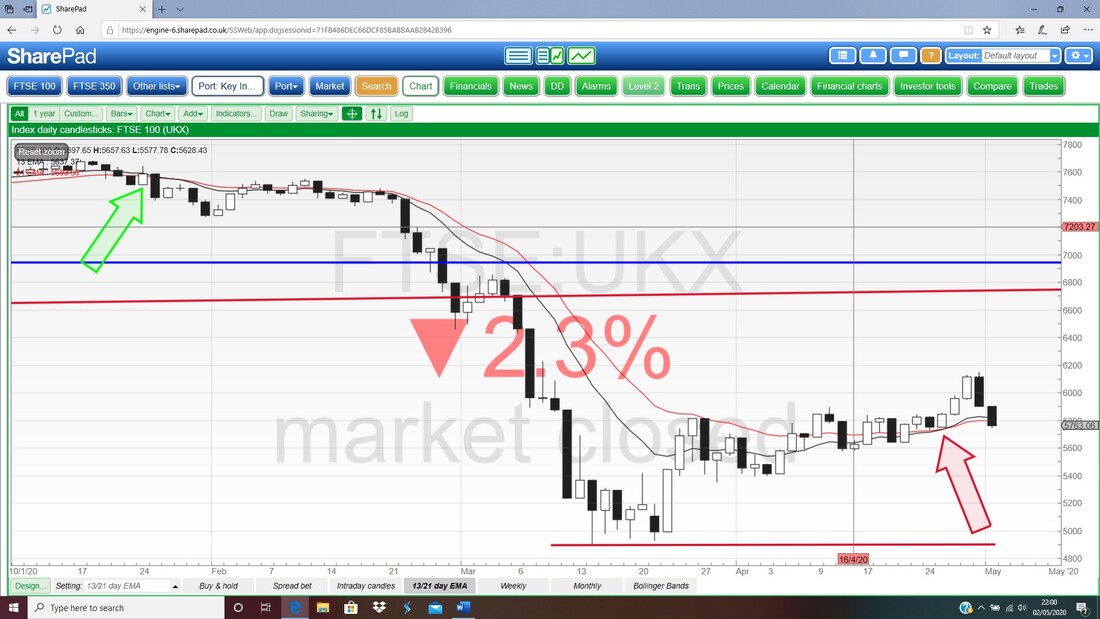
I won’t show the RSI but it is around Neutral.
Finally we have the Daily Candles and the Bollingers for the FTSE100. Last weekend I talked about the Bullish Triangle Squeeze (anyone fancy Toblerone or Dairylea?) and it truly delivered with a lovely pop but only to then evaporate instantly. Now we have a Down Candle for Friday but note it is small and a bit of a Doji and if you look in the bottom window, my Black Ellipse is a feeble attempt to highlight that the Volume was really very low. This is not too concerning in my view. The bottom Bollinger Band is at about 5595 and this could be Support. OK, that’s it for tonight. I am shattered after scribbling all that !! Good luck in the coming week and stay sane people, Cheers, WD. 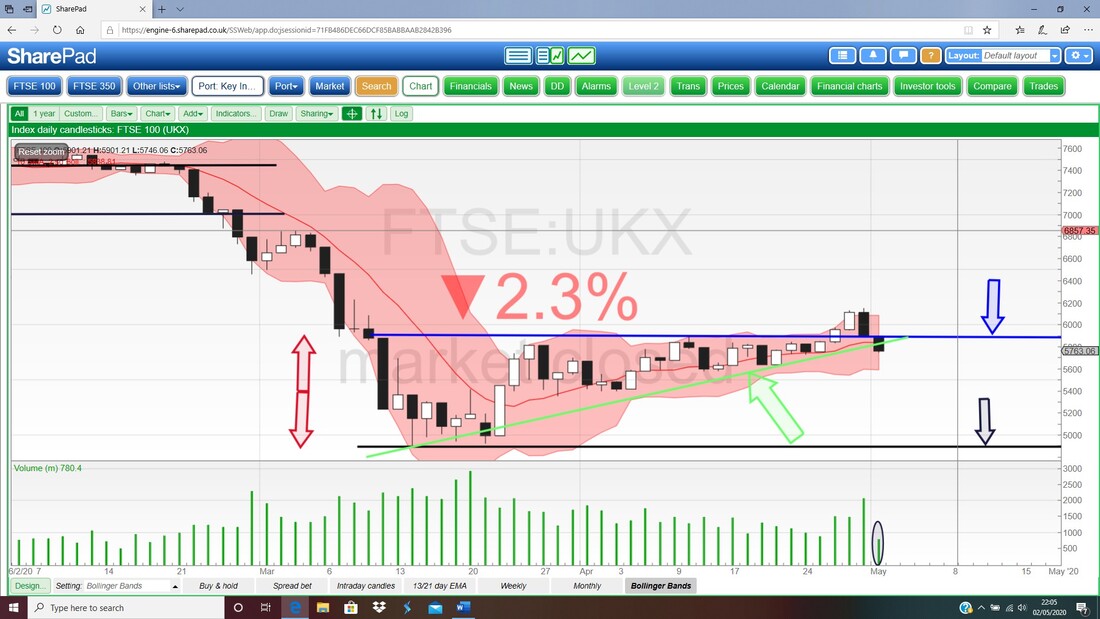
0 Comments
Leave a Reply. |

Stocks & Markets WheelieBlogsThese tend to be more Markets and Stocks related and timely - the Blog Page on the Main WheelieDealer Website has the 'Educational' stuff (well that's the theory anyway !!). Archives
October 2021
Categories
All
|
