

|
stocks & Markets blog |
|
Well Autumn is clearly trying to establish itself and things in Windsor are distinctly fresh today and the intense heatwave of just a few weeks ago seems like purely an imaginative figment.
Of course Autumn is particularly influential upon what Stocks do and historically it can mean some hefty falls; although there are no guarantees of this and after the utter spanking we got back in March, my hunch would be that any drop will be relatively mild, although it won’t feel much fun at the time I am sure.
The relative performance of Major Indexes I recent weeks has been quite unusual with the US Markets (and particularly the Nasdaq Tech Index) storming ahead in a seemingly never-ending tight Uptrend Channel, and yet with the FTSE100 looking a bit ropey and struggling to hold any Intraday Highs lately. I guess this is a cause for concern around the FTSE100 because if it is struggling at the moment, then if and when the US does drop back a bit, it follows that the FTSE100 will perform especially poorly.
I am Short on the FTSE100 in a small way (about 15% Hedged against my Long Portfolio of Stocks) and very alert to Shorting more if I see the necessary Triggers. Because of the way the August Bank Holiday has fallen, we have a complete Candlestick for August for the FTSE100 and I will address this later in the Charts section; but for the US we need to let Monday’s trading complete before getting a full and valid Candle. However, it would take a complete disaster on Monday to make the US Candlesticks look bad for August, whereas the Candle for the FTSE100 looks smelly. Anyway, I talk about this a lot (and loads of other gubbins) with Peter @Conkers3 in our new Podcast TPI 30 which you can find on Soundcloud at the link below or if you use Apple, Spotify, Audioboom, or Overcast, then go to the ‘Conkers Corner’ Channel and you should find TPI 30 there: https://soundcloud.com/user-479955511/conkers3-wheeliedealer-30-tsla-rdsb-aapl-dddd-ai-pharma-gsk-dgoc-bowl-abdp-bp The WheelieBash – Next Saturday 5th September A FEW PLACES LEFT An extremely pleasant recent visit to the White Hart at Winkfield involved a chat with Phil the Landlord about what we could do for the WheelieBash this year, in light of all the Lockdown Rules etc. Fortunately, we will be able to do something but numbers have to be restricted to 30 in case the weather is unusually dodgy and we are all forced inside where of course ‘Social Distancing’ is harder to do. At the time of typing this we have a few places remaining so if you want to come then make sure you grab your slot – the best way is to DM me on Twitter or to send me an email at [email protected]. Oh, I am sure it would help if you knew the date and we are going for Saturday 5th September. You can see more about the White Hart here: https://www.thewhitehartwinkfield.co.uk/ As usual attendance is FREE and you just need to rock up when you like (I will probably get there about 12 noon ish) and you can stay as long as you fancy. We tend to get a great crowd with a total mixture of ages and skill levels and Newbies in particular will feel right at home and no one judges anybody or anything like that - it is a superb atmosphere of like-minded people who are all trying to do their best to take on the Markets and extract some dosh out of them. It is very much a shared endeavour and an almost unique opportunity to meet up with many outstanding Investors and Traders who are more than willing to share their knowledge and experience. The White Hart is not far around the corner from Legoland and not far from the centre of Windsor and there are Hotels in many nearby locations even in good old Slough, and in previous years several people have travelled from far-flung places and made a weekend of it. There is a Car Park at the back of the Pub but it is pretty small really and has a horribly tight passageway to get to it. You might be able to park across the road in front of the Church and I am sure you can park further into Winkfield village. If you go to the ‘Events’ page which is somewhere on my websites (I think it is on WD2 so you should be able to find it from the Dropdown Menu up above this Blog you are reading) you can see pics from WheelieBashes of previous years and I am sure that even with the limitations that we must follow, it will still be a very worthwhile and fun event. Last Week I gained a little bit last week but to be honest it was a bit frustrating to be going quite well all week only to have Friday kick me a shade with more negative coverage of Boohoo BOO in The Groaniad, and that meant I couldn’t quite get back to Breakeven on the year. My Portfolio gained 0.7% last week and is now 0.9% down since January 1st. I can’t really complain too much because despite recent weeks seeming a bit dull, I have actually had a run of 5 weeks of gains although the week before last was only just a gain. In light of my comments earlier about the Markets and what I say on the Podcast, I can’t see my Strategy changing much in coming weeks as I am pretty much fully invested in my Stocks and I don’t have any spare ‘Slots’ at the moment or any spare Cash to buy with !! My only real attention is on tracking the Indexes and looking for any need to Hedge more or to Close the Small FTSE100 Short I have running. With the US Markets looking quite crazy really after an incredible run up, I am tempted to look at those closely for a Short because it could be quite nice – although there is a Risk any fall will snap-back fast so you need to be sharp I suspect. Blog Slate As I mentioned in last weekend’s blog, I dug out the Draft I had produced ages ago about the idea of an ‘Opportunity Set’ from which to pick Stocks and I have made very good progress on this so I reckon I will be able to publish it later this coming week. In support of this, I don’t have so much on socially this week so I should be able to crack on with fine-tuning it although a slight complication is that I have another idea for a Blog which I might be able to fold into the Opportunity Set one and make a big one or even a 2-parter. I haven’t really decided yet and I need to revisit the idea for the new Blog and determine whether or not they do actually work well together. In many ways it might just be simpler and easier to issue them as 2 separate Blogs. After those I don’t know what I will start on next but no doubt something will crop up. I will have to update the ‘Monthly Performance’ page for August but that shouldn’t take long and could be something I complete this week. At least the result for August should be quite decent so there are no dis-incentives there !! Oh, I nearly forgot, I updated the ‘Little Black Book’ on Friday night and that has loads of ideas for Stocks to invest in which require more Research. From the Blog Vaults After 7 years or so of writing Blog material etc. for my Websites, the catacombs are stuffed full of my manuscripts and I am aware that many newer Readers will not have seen much of what is buried away down there among the cobwebs and cockroaches. If you go to the ‘Blog Index List’ which sits on this Website, WD2, then you should find the complete list of everything I have bashed out and there are links to most of them if they are of an educational nature. This Weekend I am bringing you one from way back in 2014 but it is a useful concept to think about: https://wheeliedealer.weebly.com/educational-blogs/what-is-your-edge Better see those Charts then………. FTSE100 As is always the case, the Charts I show are screengrabs from the excellent SharePad software I use and if you click on the images, they should get larger on your Screen. I am starting with the FTSE100 because I have the Short on it and because it looks so poor compared to the others !! (from memory, I think the only other rough looking one is the French CAC40). Of course the first up has to be those Monthly Candles because longer timeframe things dominate over shorter timeframes. On my Chart below, the Red Arrow is pointing to the Candle for August and what we can see is that after trading at much higher levels during the month, the Price fell back and in the end Closed pretty much around where it Opened. This failure to hold on to Highs is not good and the most positive spin we can put on these Candles is that perhaps when combined with the Candle for July we have a ‘Bullish Harami’ 2-Candle pattern. However, the context for that is weak as you would really need a run of down Candles in advance of this pattern to show a proper Reversal, so it is unlikely the August Candle here is Bullish. My Blue Arrow is pointing to the Candle for June and it really looks like that is a Pivot Point from which the FTSE100 has turned down. It is interesting because if you look at the Candles for April and May, then the FTSE100 was rallying like the US Indexes but then in June we had a Reversal and things have been heading the wrong way since !! 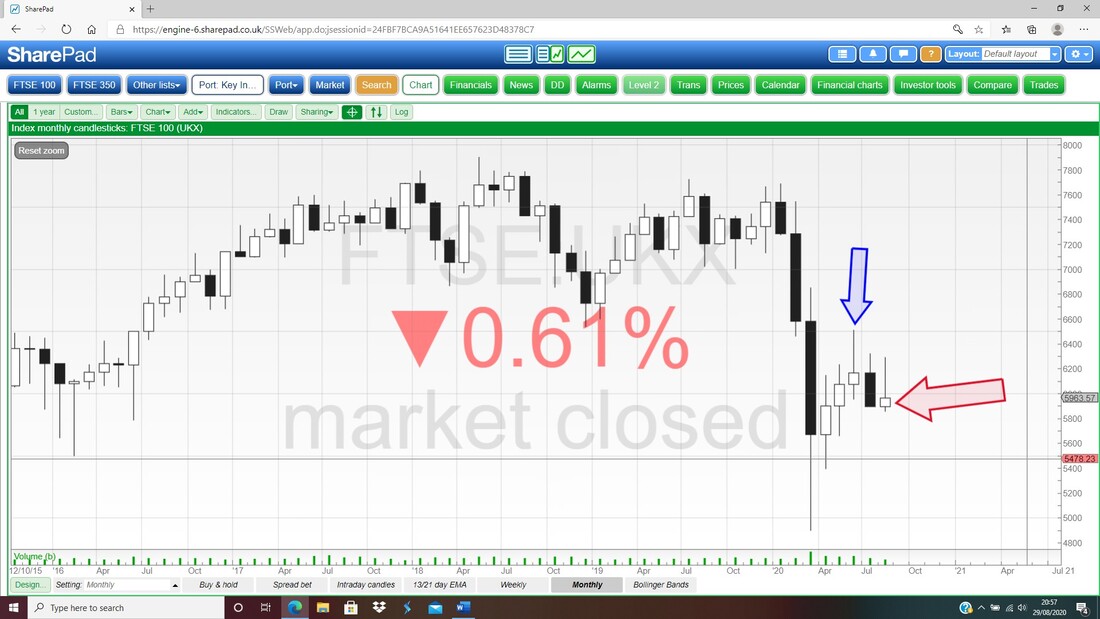
On the Chart below I am focused on the Black 13 Day EMA Line (Exponential Moving Average) and the Red 21 Day EMA Line and how they interact. I will zoom in on the next Chart I show but on this one I go back quite a bit so you should be able to see where we had a ‘Bear Cross’ where my Green Arrow is in Late January 2020 and how this predicted the falls which we then got hit by in February and March; and then in Late April we got a ‘Bull Cross’ where my Red Arrow is, and this predicted a lot of upside.
Since that though we got a ‘Bear Cross’ again where my Black Arrow is and that is the current feature that weighs over the FTSE100 and is a major factor in why I am running a Small Short Spreadbet. Note the Candlesticks shown here are the Daily ones but I am not really talking about them at the moment. 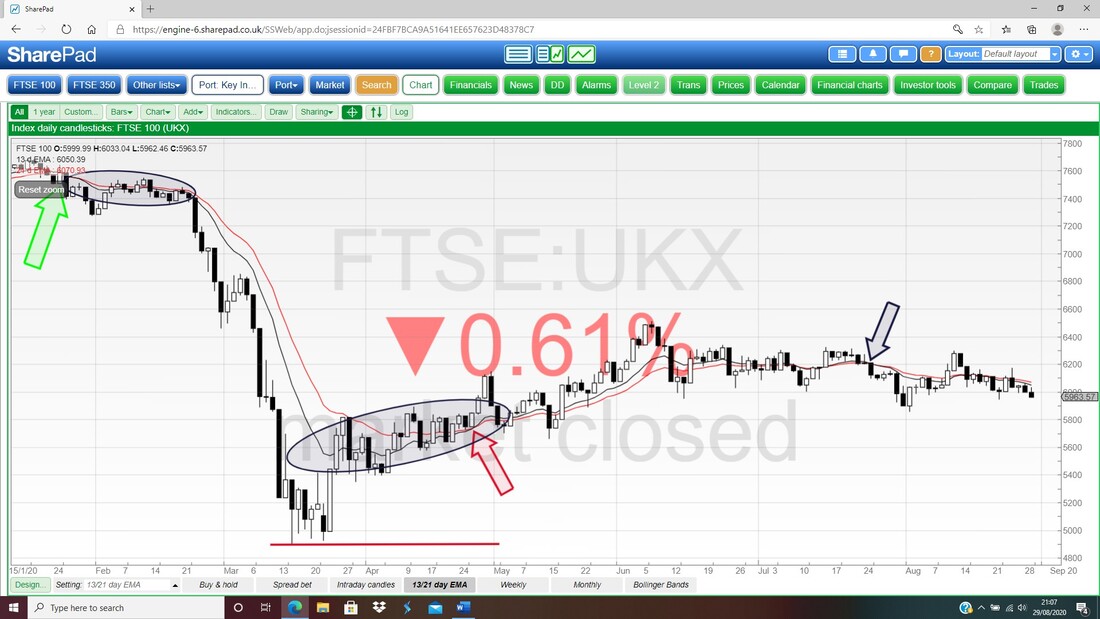
As promised, on the next Chart I have zoomed in and from where my Black Arrow is marking the ‘Bear Cross’, you should be able to see that the Black 13 Day EMA Line is now pulling away from the Red 21 Day EMA Line and that suggests the situation is getting more Bearish.
Note how just before the Bear Cross where my Black Arrow is, we had another Bear Cross which was quickly negated by a Bull Cross. This is something to be aware of – the 13/21 Day EMAs give superb and reliable Signals but sometimes if the Price is choppy and going sideways, then you can get False Signals. In general, the sensible action is to combine a Bull or Bear Cross with other Indicators to get a sense of whether or not this is False. In addition, giving a Bull or Bear Cross a few days to play out is often a good idea. 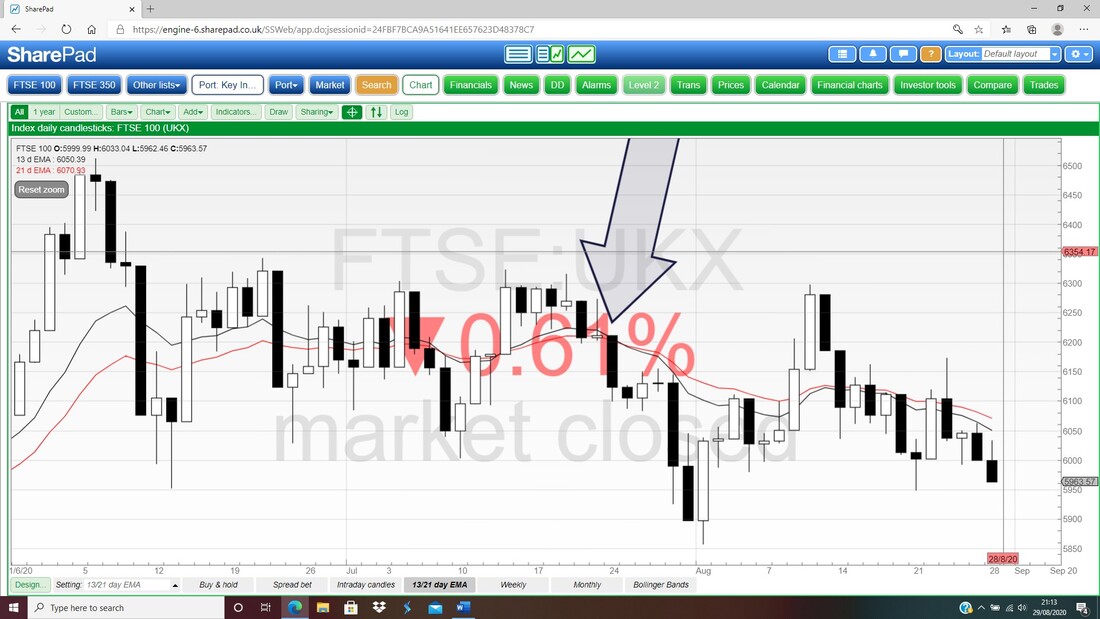
My next Chart has the Weekly Candles and my Blue Arrow is pointing to a pretty Bearish looking Candle for Last Week where again the FTSE100 could not hold onto the High of the Week.
Is it me or is there a pattern here? 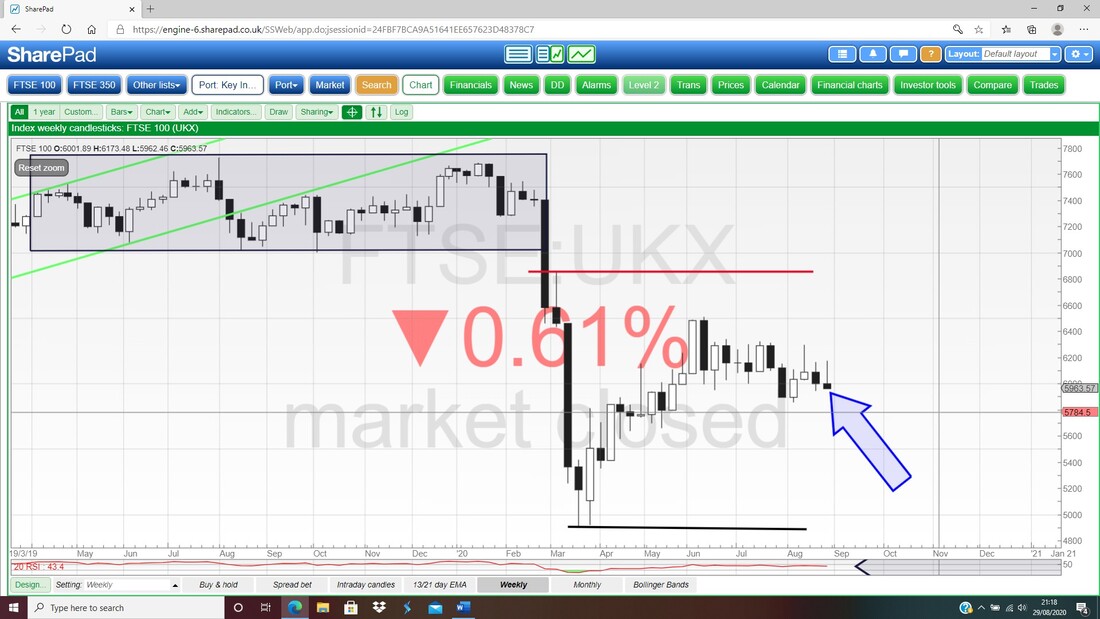
In the bottom window on my Screen below we have the RSI for the Daily FTSE100 (Relative Strength Index). Where my Black Arrow is we are on a Reading of RSI 43 which is not low at all but this creates the ‘problem’ that if the FTSE100 does want to fall, then it can drop quite a way before it gets ‘Oversold’ (which would be an RSI below 30).
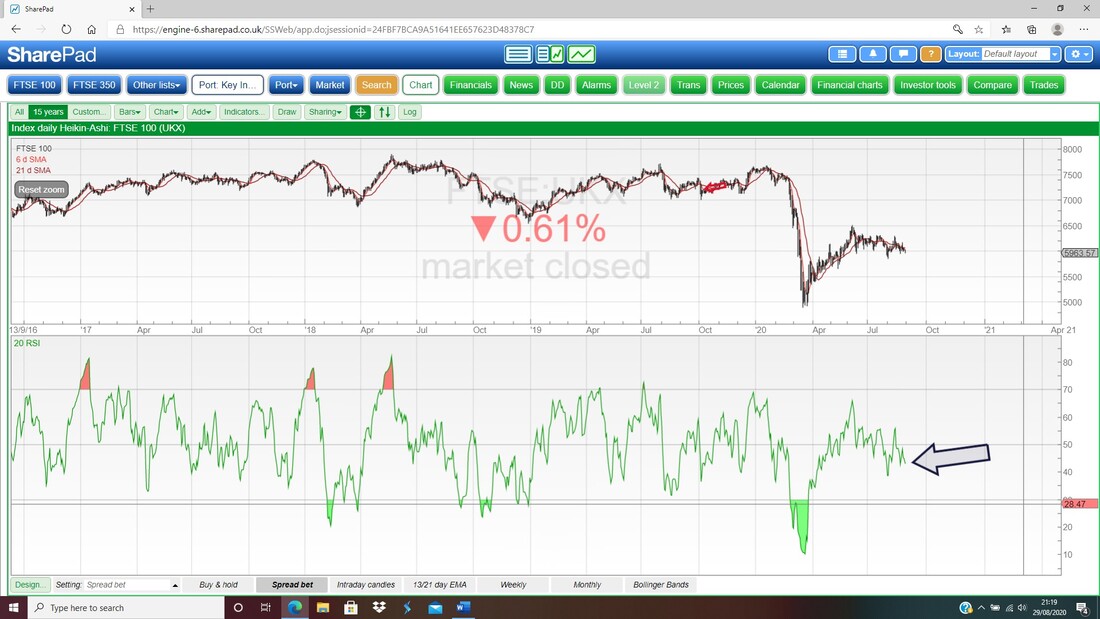
Hopefully you can see the details on the next Chart ok, but if not then feel free to dig out your Charting tool and just replicate it and zoom in. This Chart has the Daily Candles for the FTSE100 and the Pink Zone is marking the Upper and Lower Bollinger Bands. My Blue Arrow is pointing to the Black Down Candle from Friday and note how yet again the FTSE100 was unable to hold the High of the day. We Closed on Friday down near the Bottom Bollinger Band and perhaps we might see an attempt to bounce on Tuesday but it probably depends on what the US does on Monday as well (when off course we are shut for the Bank Holiday).
My Red Arrow is pointing to the recent Low at 5857 and this is an extremely important Support Level and if this fails, then that will most likely be my Signal to Short more although it will depend a bit on the Candle produced and how the RSI is looking etc. No doubt I will be tweeting out if this occurs and my ‘Trades’ page will be updated with anything I do. My Black Arrow and the Black Line right at the bottom of the Screen are marking the Support at 4898 from back in the March panic and it would be very surprising if we revisit this in coming weeks and even more surprising if Support at 4898 fails. 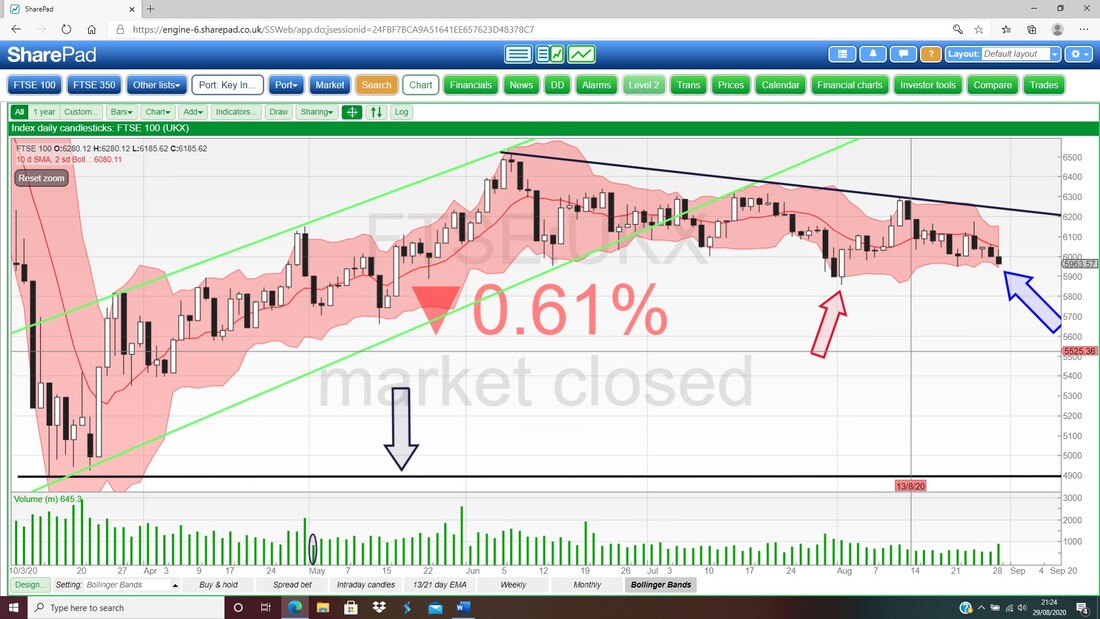
FTSE250
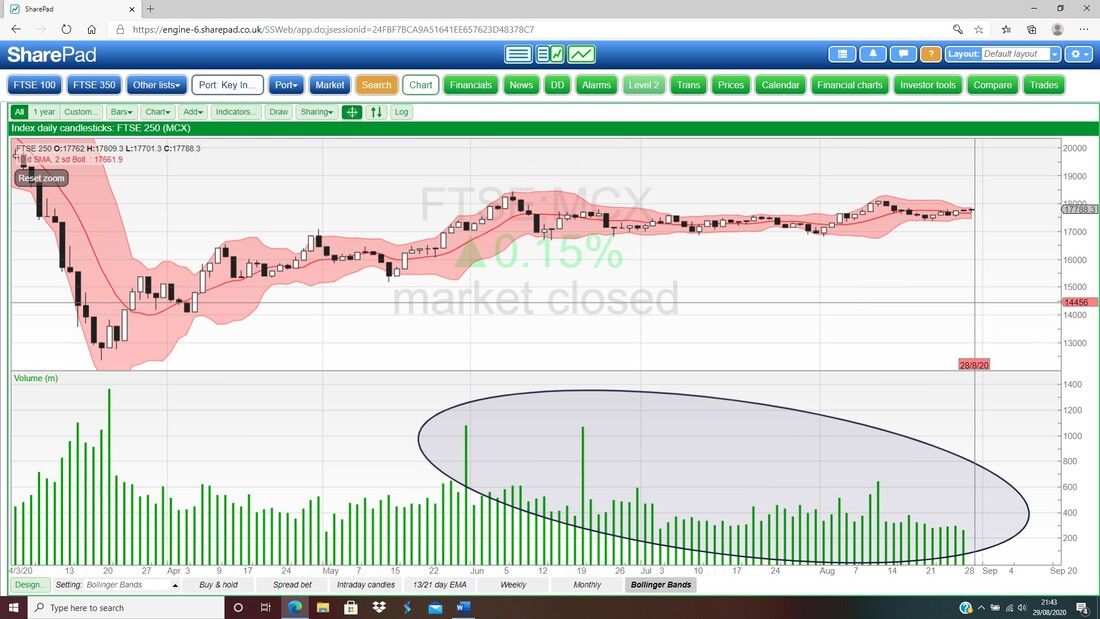
I won’t dwell on the FTSE250 but there are some things of interest. First up we have the Monthly Candles and this is a bit nicer than on the FTSE100. If the FTSE100 does continue to be weak then I would expect the FTSE250 to be dragged down as well, so it will be interesting to see how it all plays out. My Blue Arrow is pointing to a nice Up Candle for August and this is clearly better than the situation with the FTSE100. However, my Red Ellipse is highlighting the ‘Bearish Shooting Star’ Candle which was created in June and this is hanging over the Market like on the FTSE100. This means that 18448 is crucial Resistance and unless this is broken-above, then the Bulls won’t be achieving much. 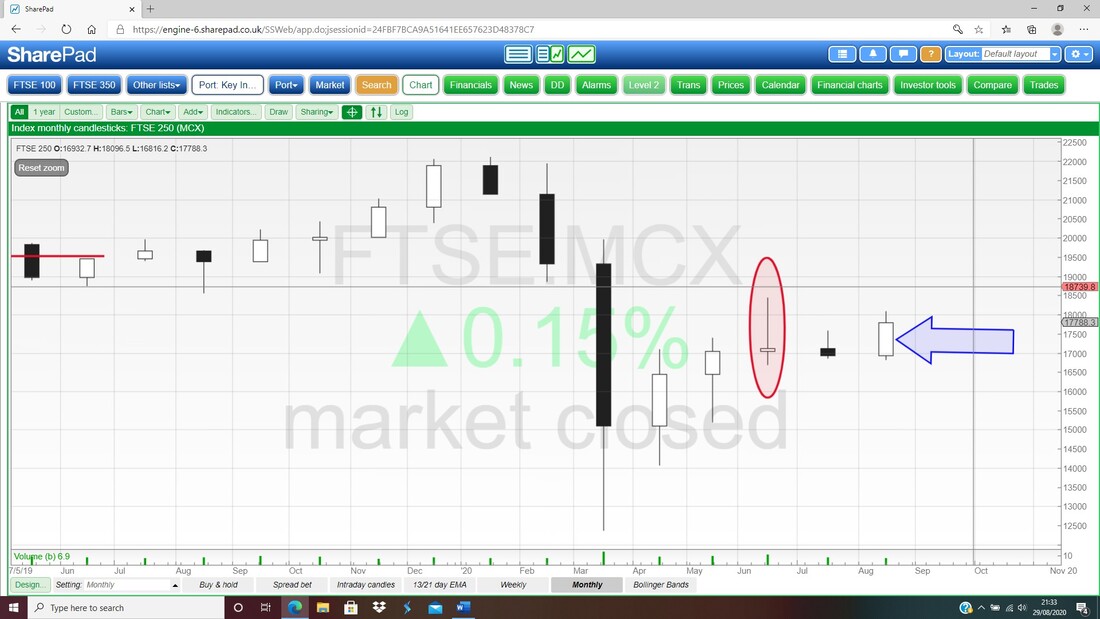
Next we have the Daily Candles for the FTSE250 and I am focused here on the 13 and 21 Day EMA Lines and at the moment we are in ‘Bull Mode’ after a Bull Cross where my Green Arrow is. This followed a Bear Cross where the Blue Arrow is which was clearly a bit of a False Signal.
Really though this is a Sideways Market and until we see a Break above about 18096, this situation isn’t changing. The real breakthrough will be if and when 18448 is taken out. 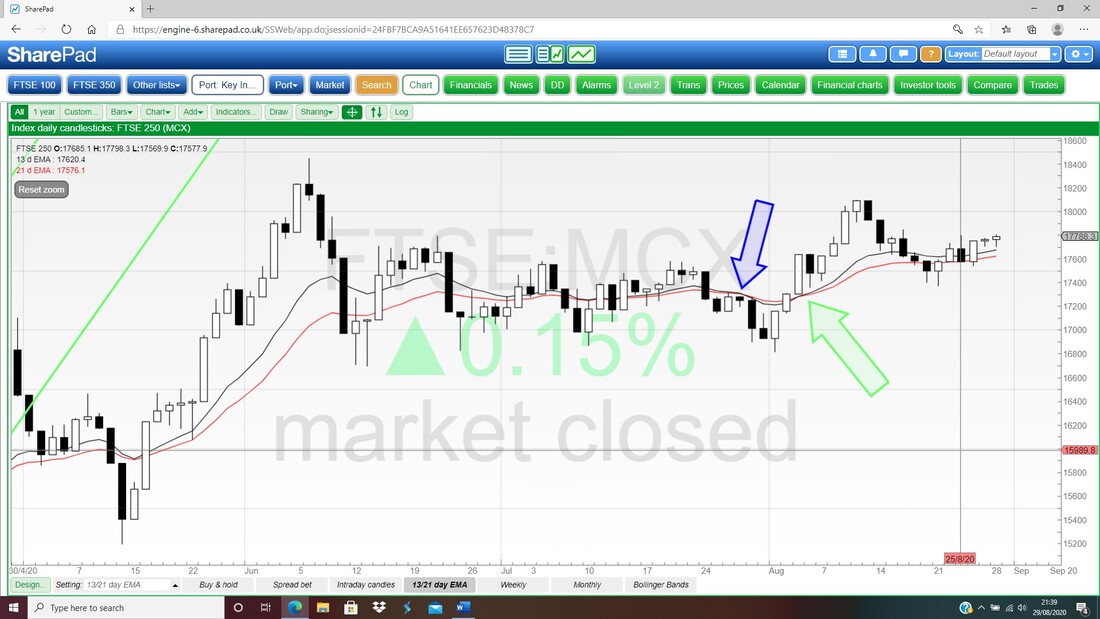
In the bottom window on my next Screen, my Black Ellipse is an admittedly poor attempt to show how the Daily Volumes on the FTSE250 are falling away. This suggests no real commitment and goes along with the lack of direction and choppiness of the Summer.
Nasdaq Composite Index (US Tech)
I just find this Index extremely fascinating from a Technical Analysis viewpoint (and the Fundamentals on it are intriguing as well !!). The run up has been truly incredible and frankly I just cannot see that such a strong and steep Uptrend can run a whole lot longer – especially as we come into Autumn, and in particular September, which is historically a tough time for Stockmarkets. My Chart below has the Daily Candles for the Nasdaq Comp and the Pink Zone marks the Upper and Lower Bollinger Bands but I am not really so much focused on those but really my interest here is in the Parallel Black Lines I have drawn to mark the Uptrend Channel since the March Lows and this is just an incredible run and it is very steep. My Blue Arrow is pointing to the previous All Time High (ATH) before the Coronavirus Collapse – look how far we are now above it. Amazing. 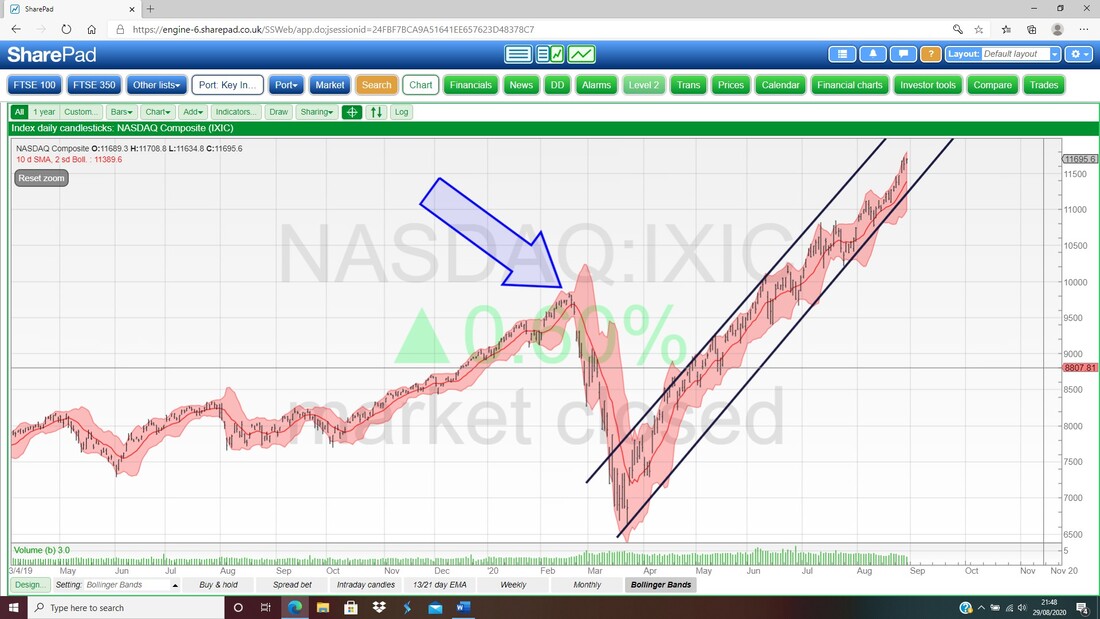
I stumbled over the next Chart but it shows what is going on in a really meaningful way. This is the Nasdaq Comp going back as far as it does in SharePad and my Red Arrows are trying to show the Steepness of the run up since March. That is steep.
Now look at my Blue Arrow – that is showing the run up for the Dotcom Boom in 1999/2000 – I would argue we are now the same Steepness or worse. That is not sustainable. 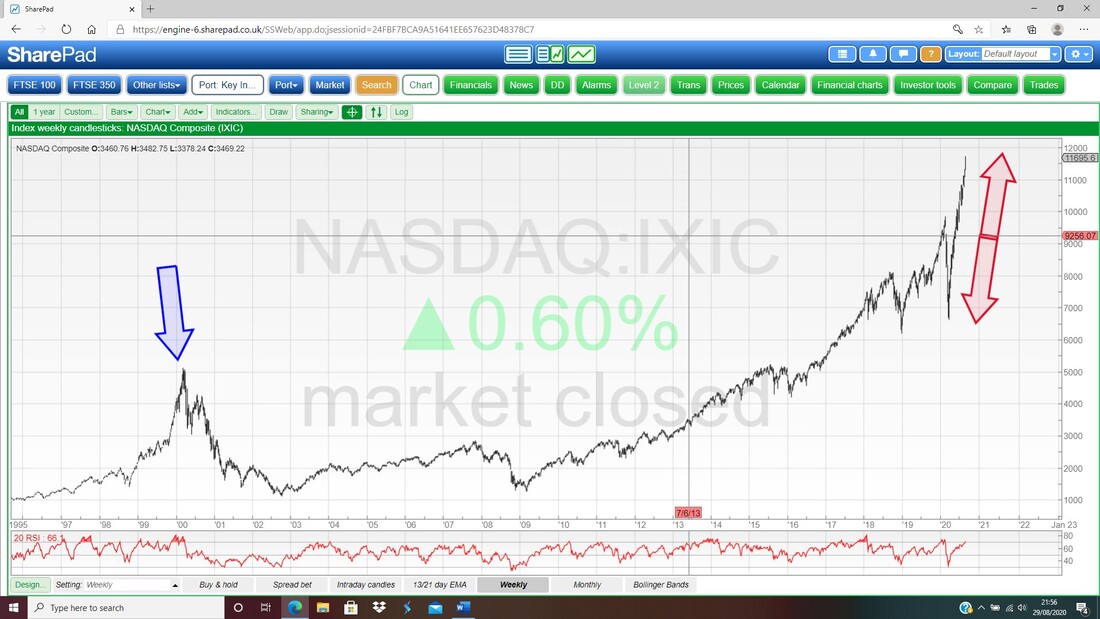
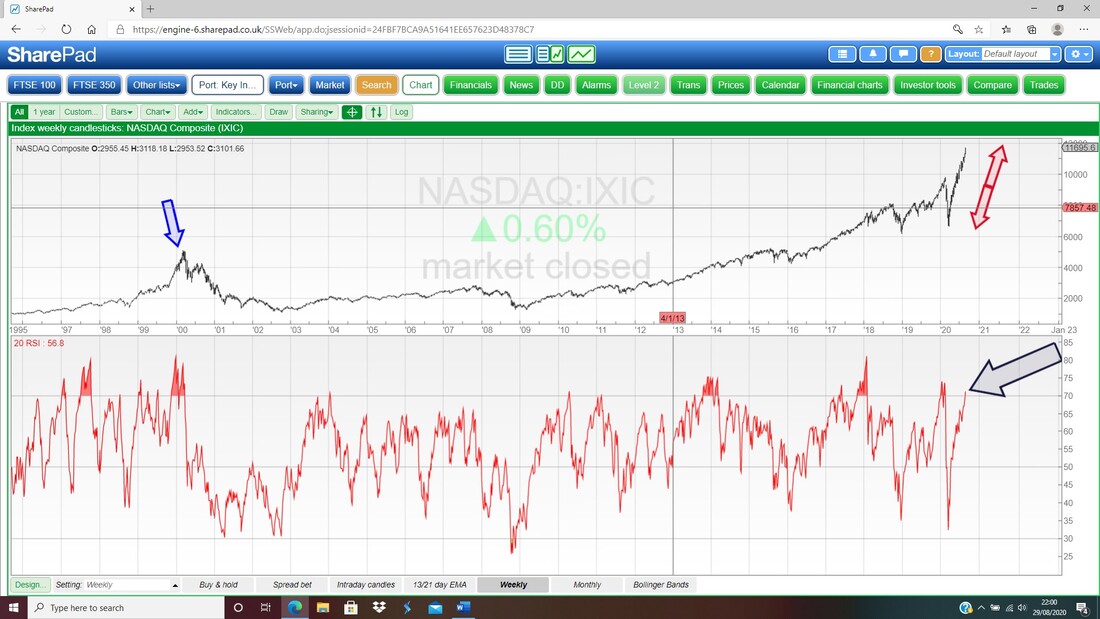
In the bottom window on my next Chart we have the RSI for the Weekly Nasdaq Comp and my Black Arrow is pointing to a Reading of RSI 71 which is high but note a few times we have been as high as RSI 81. This suggests we might see more upside but clearly there is a limit.
Next in the bottom window is the RSI for the Daily Nasdaq Comp. This is not so good because on a Reading of RSI 77, where my Black Arrow is, this is very overbought although in the past it did get to RSI 84.
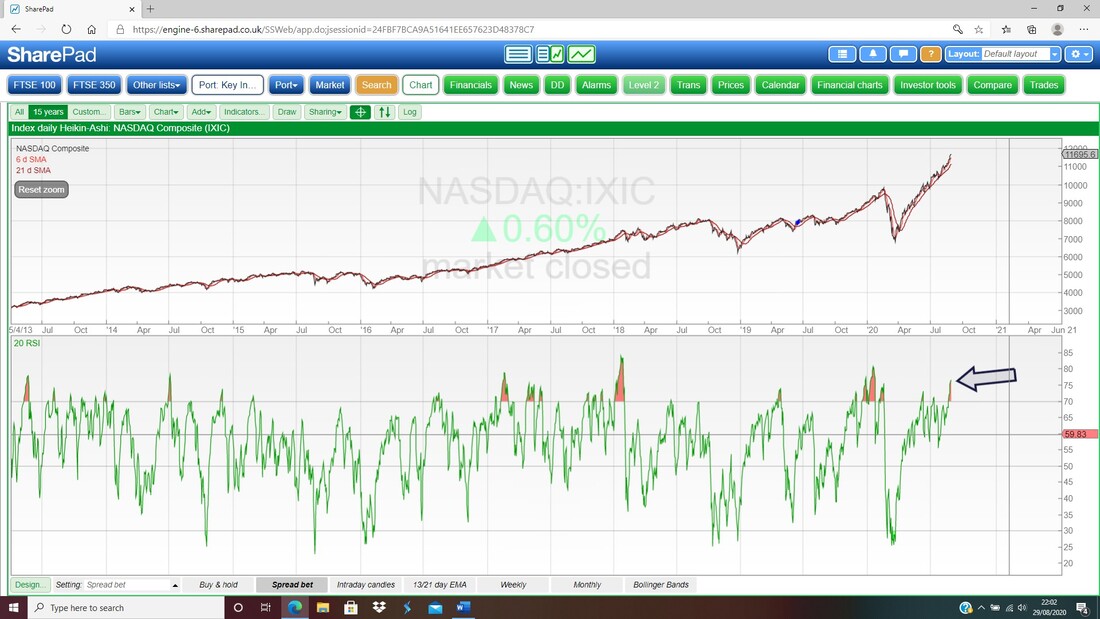
I won’t show more on the Nasdaq because really everything looks Bullish. However, that is always the case when something has run too far and what we need to be watchful for is Reversal signs which will show in Candlesticks first and on the Daily RSI. It is also worth tracking what the Volumes do as they are likely to drop away as the power of the move softens.
OK, that’s it for this week. Good luck in the coming Week and hopefully I will be seeing you at the WheelieBash on Saturday. Cheers, WD.
0 Comments
Leave a Reply. |

Stocks & Markets WheelieBlogsThese tend to be more Markets and Stocks related and timely - the Blog Page on the Main WheelieDealer Website has the 'Educational' stuff (well that's the theory anyway !!). Archives
October 2021
Categories
All
|
