

|
stocks & Markets blog |
|
Needless to say (but I will anyway), with all this Lockdown Life going on, I am watching far too much telly and I’m certainly not getting out much (I never do in the Winter anyway, but that’s not the point). But all this tellybox watching is not totally wasted because I heard some funny stuff as a consequence. Firstly, it was Johnny Vegas on ‘QI’ the other night going on about “DIY Gaviscon” which was a cocktail of half a pint of Baileys mixed with half a pint of Cointreau. The logic was that you could drink this during a heavy session, so that you could then keep going on the lagers…….
The other gem I heard was from one of the Founders of PayPal – I think his name was Hoffman and I caught him on CNBC or something and he said how starting a new business “…is like jumping off a cliff and assembling an airplane on the way down”. I did giggle at that.
Unfortunately though, my never-ending health problem has returned (I really thought it was resolved) and this is limiting what I can do in a big way. I will be speaking to my GP again on Monday and I think I need to turn up the heat and actually get them to run some tests and find out what the actual underlying problem is.
Last Week I am sure a lot of Readers had the same kind of experience as me. I was a bit disappointed with the way that my nice gains for January soon got eroded as we headed towards the start of February, but miraculously there was a superb rebound this week and my Portfolio gained 4.1% and hit the highest levels ever. Quite surreal really. One thing I did right (although in practice I would have done a little better to do nothing, but of course I did not know that at the time I took action), was to Close most of the FTSE100 Short Position I had put on to Hedge my Portfolio as soon as I sensed the bounce was on – but it turns out that the FTSE100 jumped a bit and then dropped back, whereas the FTSE250 and smaller stuff rose pretty nicely. All my Trades are on the ‘Trades’ page on my WD1 website and you can probably see that I kept a small FTSE100 Short Position running (equivalent to about 6% of my Long Portfolio) and this was partly to keep me cautious and ready to Hedge more if I need to. I will monitor this small Short and if I see a need I will Close it soon. I am certain the key to keeping any negative impacts from Hedging at a minimal level is to get out quick if it looks like they are not needed. For quite a while now I have been meaning to Sell the Shares and Spreadbets I had running on AA and finally on Friday morning I got round to doing it and crystallized a nasty loss on a rather unfortunate episode. Anyway, you can read all about it on the ‘Trades’ page but the real reason for doing this bit of housekeeping (that I should have done a while ago), was to free up the remaining tiny bit of Cash I had left in there, to wheel it round and get it lined up ready to buy something very soon. I have enough Cash (this has partly built up simply from Dividends dripping into my Account which is rather sweet) to buy more of something I already have and there are at least 4 candidates for this but I also fancy a brand new Stock for the Portfolio and I might take a Starter Position in that if I am happy with the prevailing Chart situation. I have several other Positions that are doing rather well and I will be TopChopping soon and feeding the Cash into the Stocks that are still waiting patiently for their turn to get on the upmove of the Roller Coaster. I have a few beauties awaiting their turn and some of them I think have pretty chunky upside – I talk about this a lot and I am sure Readers are aware of which ones I am particularly keen on. Oh, while I think about it, and sort of related to this, on Friday Night I got a bit carried away and I had a sudden WheelieBrainwave to tweak the Table on my ‘Portfolios’ page on the Website so that the Stocks which I have actually sold from the WD40 are now highlighted in Red and the Stocks which are pretty new into the WD40 are highlighted in a sort of Pinky colour. I think that should help Readers and it also had the side-effect that I was actually a bit unsure of how many Stocks I actually had and doing this has enabled me to count them properly and I now have 38. So I can easily slip one more in (and in fact I could buy another if I so wished). Something I must just mention is that most people probably think 40 Stocks is a lot in a Portfolio and they are probably right. However, it is important to realise that they are not 40 equally weighted Stocks and what I tend to do is to have lots of small Positions (could be 1% or 2% of the Portfolio) and when they start to display actions which make it look like they are going to go up, I will then buy more if the Value case still stacks up. So I often ‘Average Up’ as something builds momentum. And it works the other way as well. If something has done well and become a big part of my Portfolio, I will be on it constantly and thinking about how the Valuation etc. now stacks up and how big a chunk of my Portfolio it as become. For example, MPAC has been stunning and just recently it had got to 12% of my Portfolio, which is frankly madness for such a Small Company. Therefore, I topsliced a load off and it is now probably about 9% - but still a lot. The Valuation case on MPAC still looks exceptionally good and I am no way going to sell my holding, but if it gets really big again then I will continue to slice. I have a few other Stocks that I am now looking at to TopChop. I much prefer this approach to selling my whole Position because I have learnt the expensive way that chopping the legs off a Stock I know really well is a big error. It makes no sense to sell a Stock that has strong upwards momentum and from a Fundamental Understanding viewpoint, it is obvious that I will know a lot more about a Stock I have owned for 4 years than one which I have only researched for a few weeks. It is a lot less effort as well and that really appeals to me. Anyway, the point is that it is not 40 Equally-weighted Stocks and in reality it probably acts like a Portfolio which just has 15 to 20 Equally-weighted Stocks and yet I get benefits of more diversification. I guess the term ‘Dynamic Position Sizing’ would sum it up nicely. I need diversification because I then ‘Mirror’ these Stocks as Spreadbets and if you fail to manage Risk on Leveraged Positions, then you will get burnt nastily. It also ties up with one of my favourite Investing Tricks which of course all the Gurus and Textbooks will tell you not to do. I have made so much money over the years from situations where I have bought into a pretty good Company and then it has gone wrong. What often happens, as long as you stick to Quality, is that they have a temporary problem and then they recover. If you buy at a decent Valuation anyway, and then it goes wrong, you often get the opportunity to buy more once the problems are moving behind them and the Company is sorting itself out. This can mean you are given the opportunity to buy a lot of Stock at very attractive Valuations and if you wait for the Chart to show upside momentum – which can usually be seen easily by looking for Breakouts – then you can pounce at a really good time. Of course, the difficulty with this approach is that sometimes they don’t recover – but again, the idea of buying smaller Stakes first means that if/when they go ‘wrong’, then the damage is not too heavy on the Portfolio and your Winners will be more than making up for this particular Stock letting you down for a while. However, sometimes you get a problem with a Company and it is really serious, and then it is best to sell out and move on. Each case needs to be considered on its own merits and inevitably some will go very messy. Rather than thinking/obsessing about Individual Positions and what they are doing at a particular time, divert your focus onto the Portfolio Value overall and focus on optimizing that aspect. From deep in the Medicine Cabinet Whilst I am on this concept of ‘Dynamic Position Sizing’, it is actually something I have alluded to in the past and wrote some Blogs which carried the ideas but didn’t actually give it a specific name (I better Patent and Copyright that name !!). I think this is the one and as always you can find all the Blogs I have ever writing under the ‘Blog Index List’ page on WD2 and the ‘Educational’ ones all have Links so you can get to the ones you want quite easily: https://wheeliedealer.weebly.com/educational-blogs/pin-the-tail-on-the-monkey-musings-on-portfolio-management-part-1-of-2 https://wheeliedealer.weebly.com/educational-blogs/pin-the-tail-on-the-monkey-musings-on-portfolio-management-part-2-of-2 I found this one as well. This is Part 2 and there is a Link to Part 1 at the start of it: https://wheeliedealer.weebly.com/educational-blogs/the-power-of-patience-the-importance-of-being-idle-part-2-of-2 These ones are also relevant to the subject. Again, Link to Part 1 at the start: https://wheeliedealer.weebly.com/educational-blogs/the-diminishing-problem-part-2-of-2 Blog Slate Sadly there is not much to write here. Due to my health limitations, I am getting nowhere with that Blog about LOK (by the way it is due a Trading Update on Monday 8th Feb) – I have made a good start and that is about it. If I feel ok and up to it, I will try to progress it in the coming week but I can make no guarantees. I am doing what I can at the moment and that is about it. I did do some work on the Websites though – if you go to the ‘Changes List’ on the WD1 Homepage then you can see what I have changed, but in essence I updated the ‘Trades’ and ‘Portfolios’ pages and I also updated the ‘Monthly Performance’ page with details for January and I moved the Monthly Entries for 2020 down to the bottom of the page for future reference. Check it out. Right, let’s see how the Index Charts are looking after that remarkable rebound. S&P500 Every weekend I take the Charts from the excellent SharePad Software that I use and if you click on the images then they should get bigger so you can see more detail. If you fancy using SharePad or ShareScope yourself, then there are ‘Adverts’ all over my websites that include an Offer where you can get the first Month of Data for Free. I also get a drink out of it so thank you very much !! First up we have the Weekly Candlesticks for the S&P500. My Blue Arrow is pointing to a Big White Up Candle from last week and note how it hit yet another New All Time High (ATH). Note also that is it still within the confines of the Uptrend Channel marked by my Black Lines and pointed at with the Black Arrows. Clearly Bullish. 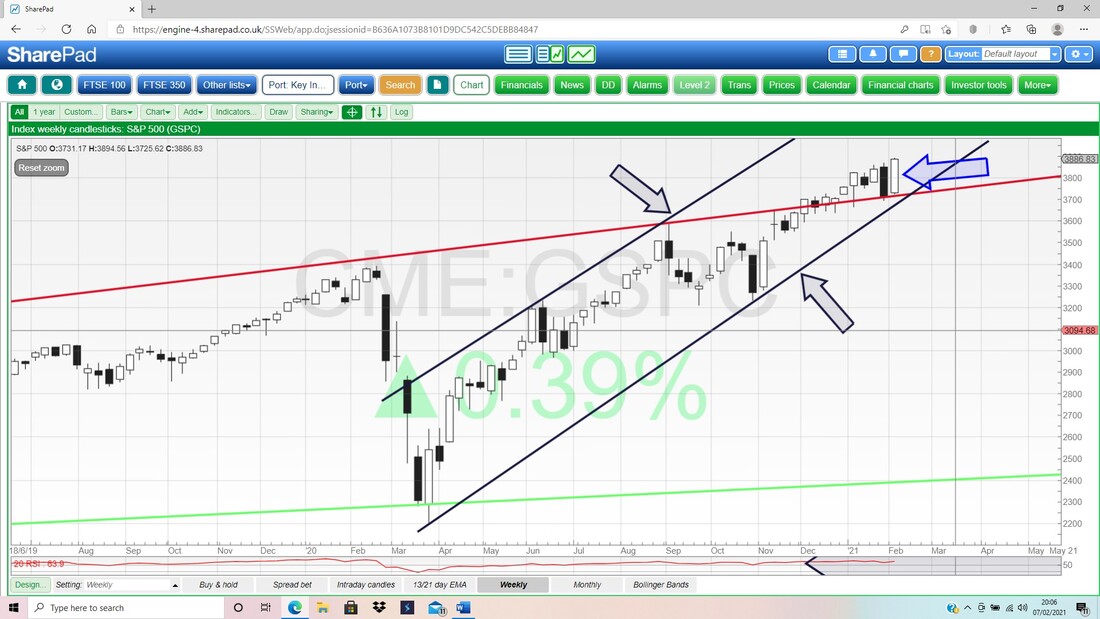
Next we have Daily Candles for the S&P500. My main interest here is the Wiggly Black 13 Day EMA Line (Exponential Moving Average) and the Wavy Red 21 Day EMA Line. Where the Green Arrow is we had a Bull Cross between these Lines and the 13 Day EMA has stayed above the 21 ever since.
Note where my Black Arrow is that there was a bit of weakness at the end of January and the Lines got closer together, but again they missed a Bear Cross and are looking nicely Bullish again. 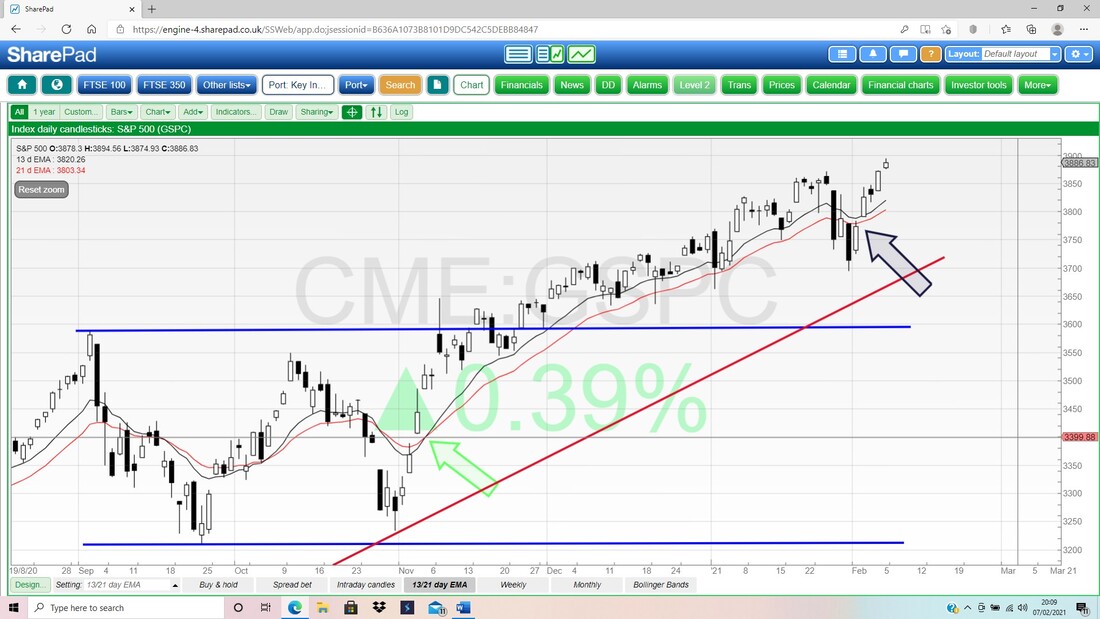
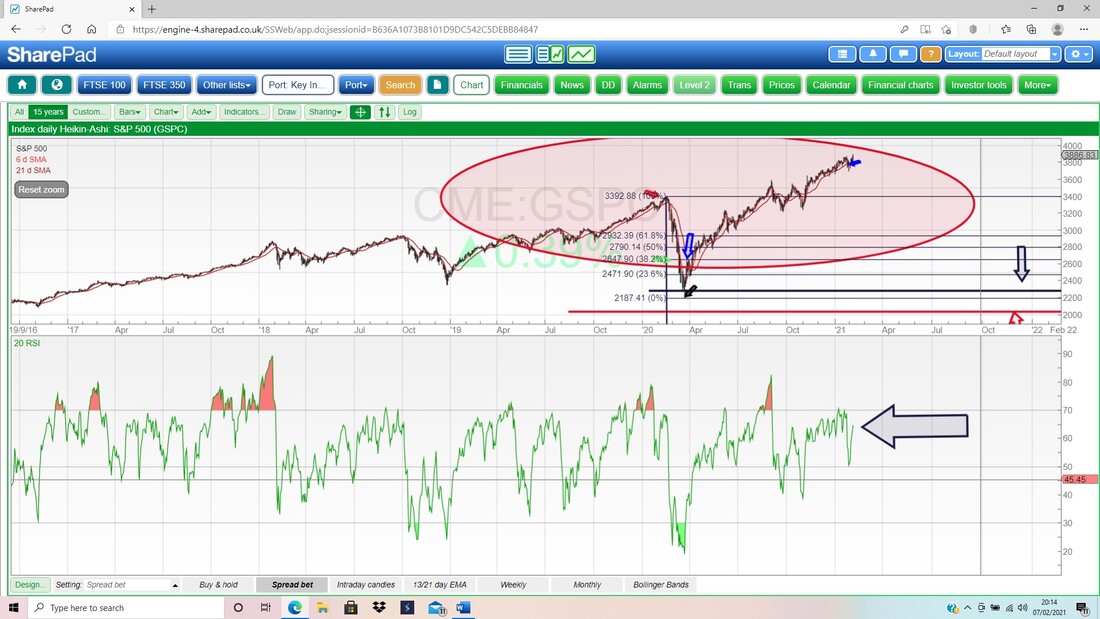
In the bottom window on the Screen below we have the RSI (Relative Strength Index) for the S&P500 Daily and on a Reading of RSI 65 where my Black Arrow is, this is getting high but it is not yet extreme and means the S&P500 can keep moving up in coming days, if it is in the mood.
Finally for the S&P500 we have the Daily Candles with the Pink Zone marking the Upper and Lower Bollinger Bands. My Blue Arrow is pointing to a small Doji Candle from Friday and this in itself isn’t a strong Reversal Signal but it does suggest that even though the S&P500 gained on Friday, it wasn’t easy for the Bulls and the Bears are fighting back.
The Upper Band is at about 3923 and this could be Resistance. 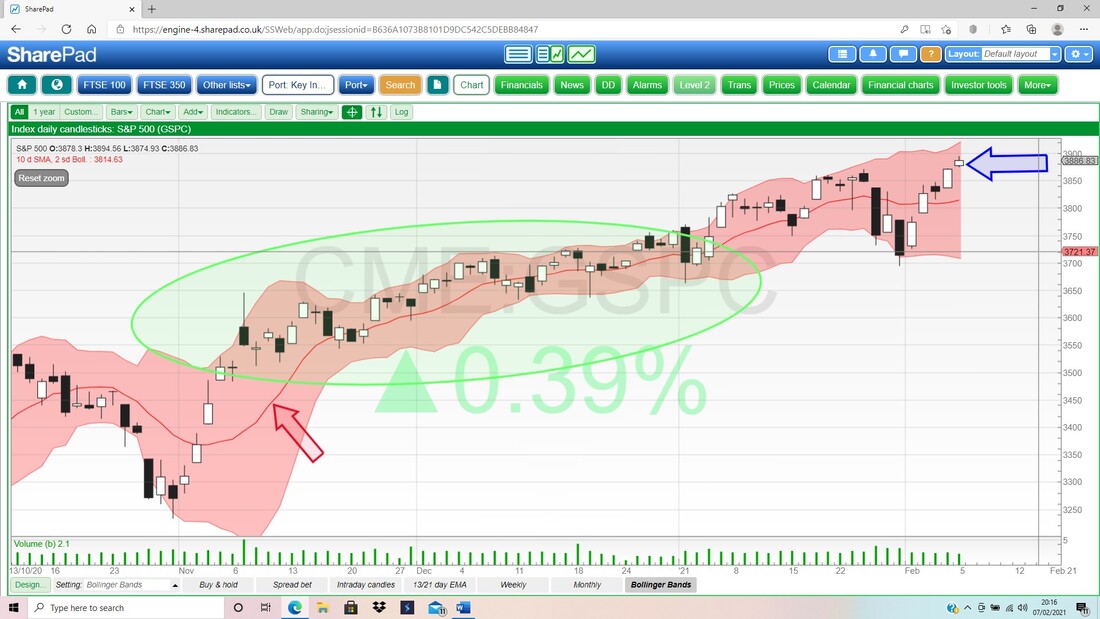
Brent Oil Composite
This next Chart is interesting. Just remember how beat-up Oil was back in March 2020 – what a stunning recovery this has had. My Chart below is the Weekly Candles and my Green Arrow is pointing to a Big White Up Candle from last week and note how it has nearly Broken-out over that Red Resistance Line marked by my Red Arrow. It is early days and could be an over-shoot, but in coming days/weeks we will know if Oil has broken-out and if it can go higher. To me it looks pretty Bullish still. My Blue Ellipse is marking a big Zone of Resistance and this runs first off at $60, which is pretty much where Brent Oil Comp closed on Friday, and then it goes up to $70, $75 and ultimately $86. 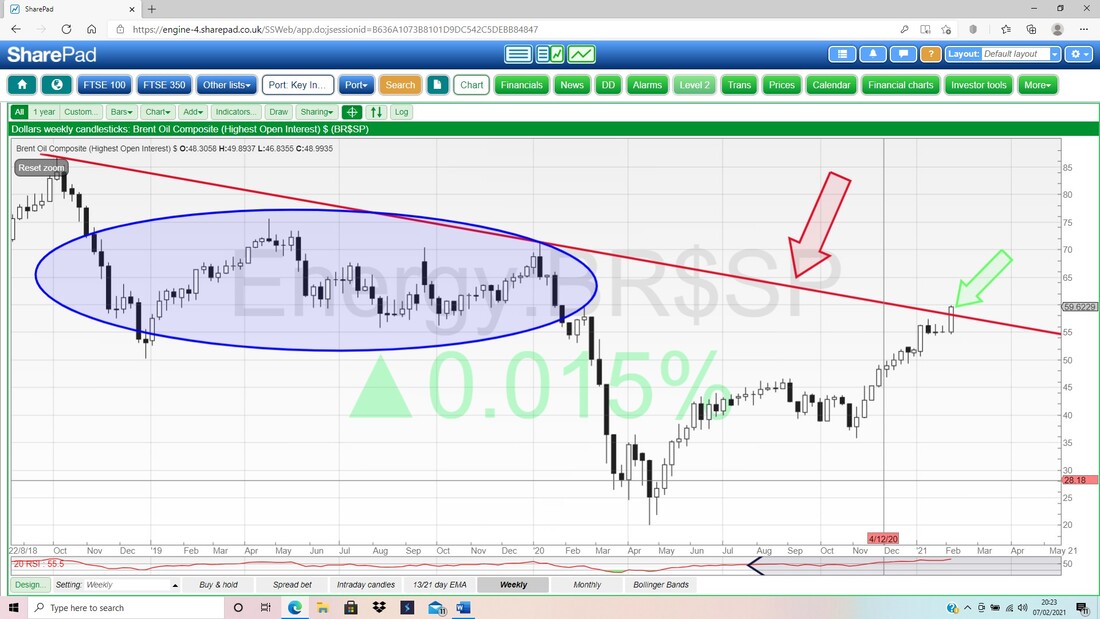
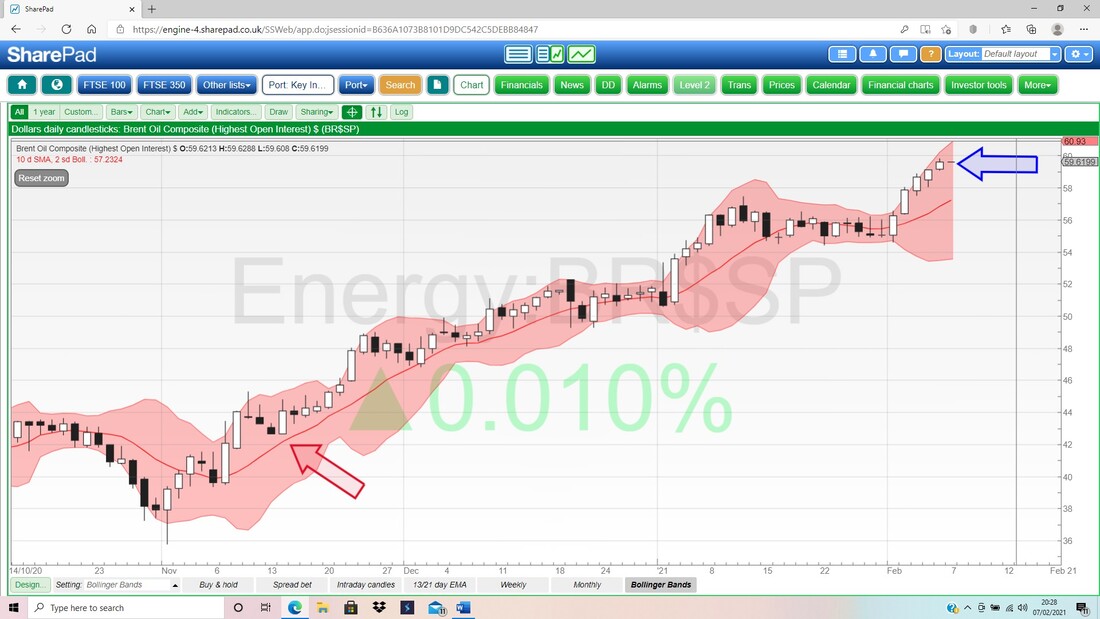
Next the Daily Candles for Brent Oil Comp with the Pink Bollinger Bands. My Blue Arrow is pointing to a Tiny Flat Doji from Friday where the Oil Price did nothing much (that’s strange and might be a data error I suspect). Anyway, the Upper Band is at about $61 which may be Resistance and there is Support from the Red Midpoint Line (Red Arrow) at about $57.25 and the Bottom Band should be Support at $53.6.
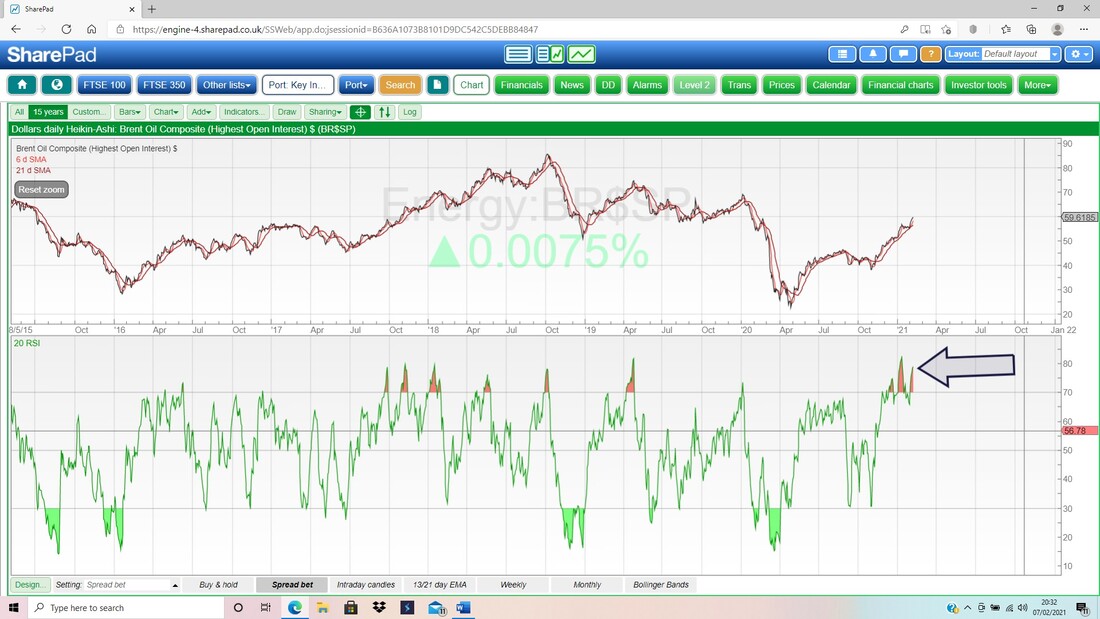
In the bottom window we have the RSI for the Daily Brent Oil Comp and where my Black Arrow is we are hitting crazy levels up at RSI 79. It has been slightly higher in the recent past but not much and clearly a Pullback is needed here or at least some sideways moves to do a Consolidation and take the over-excitement out.
FTSE100
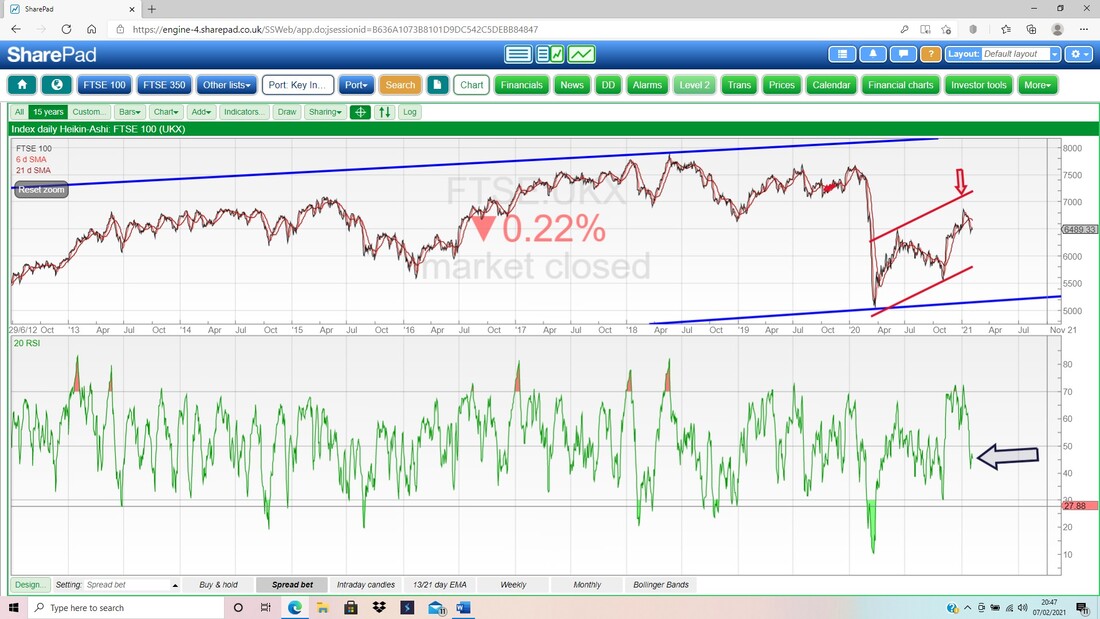
First up the Weekly Candles. My Blue Arrow is pointing to a Small White Up Candle from last week and in combination with the Big Black Down Candle from the week before, this could perhaps be a Bullish Harami pattern. It is not a great context as you would ideally want more of a fall before the Harami, but chances are this can rise from here. There is Support at 6315 and 6263 and the Black Ellipse shows more Support below. To the upside, we need a Breakout over 6903 to set up more gains. 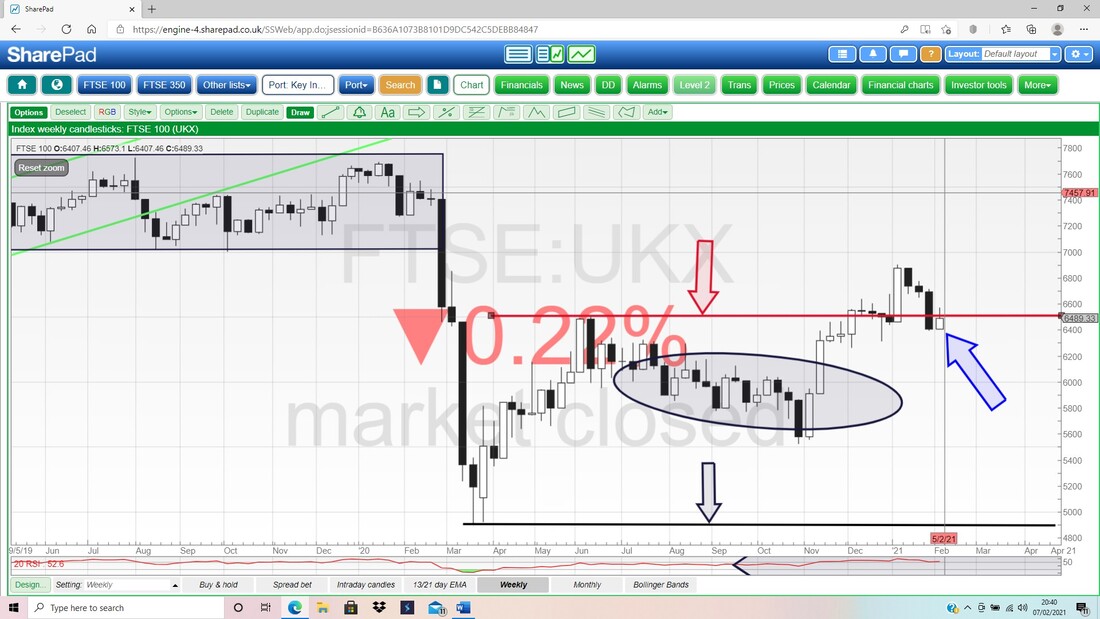
On the next Chart we have the Daily Candles but my focus is on the Black 13 Day EMA Wavy Line and the Red 21 Day EMA Wavy Line. Where the Red Arrow is we had a Bear Cross and this is a problem as it implies more weeks of downside.
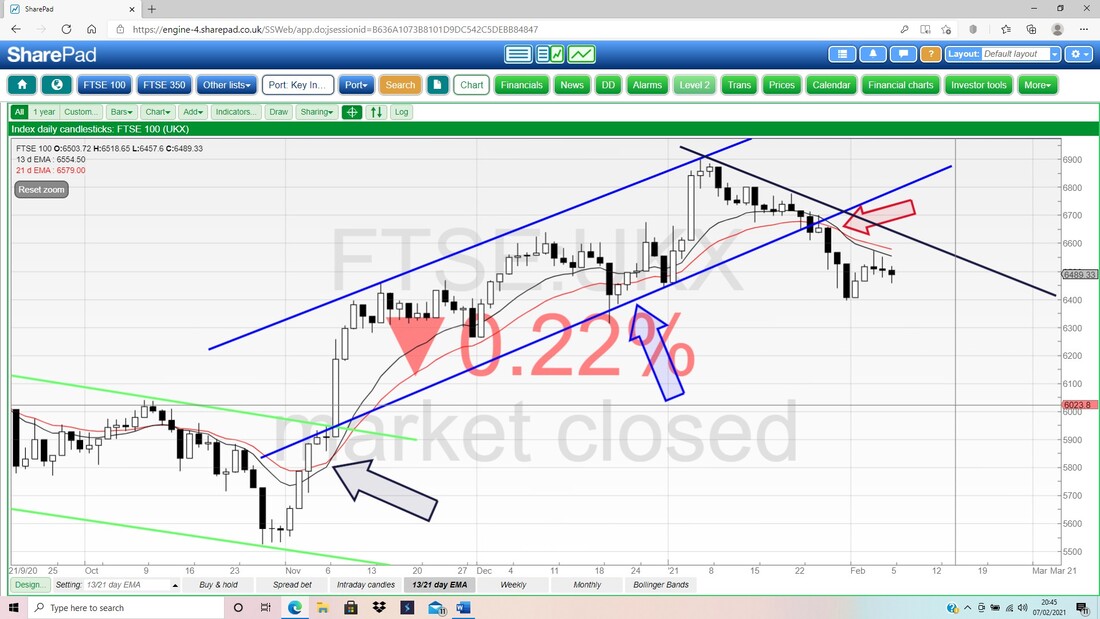
In the bottom window below we have the RSI for the Daily FTSE100 and on a Reading of RSI 45 where my Black Arrow is this is near the Neutral 50 Level and tells us this is not Overbought nor Oversold.
Next the Daily Candles with the Pink Zone marking the Bollinger Bands. My Blue Arrow is pointing to a Doji Candle from Friday and look how the Red Bollinger Midpoint Line (marked by my Red Arrow) is capping the upside on the FTSE100 at the moment with it hitting Resistance at this Midpoint Line several times of late.
To the downside there is Support from the Bottom Band at about 6390. To the upside, we need the FTSE100 to Close above 6573 to show any signs of life. 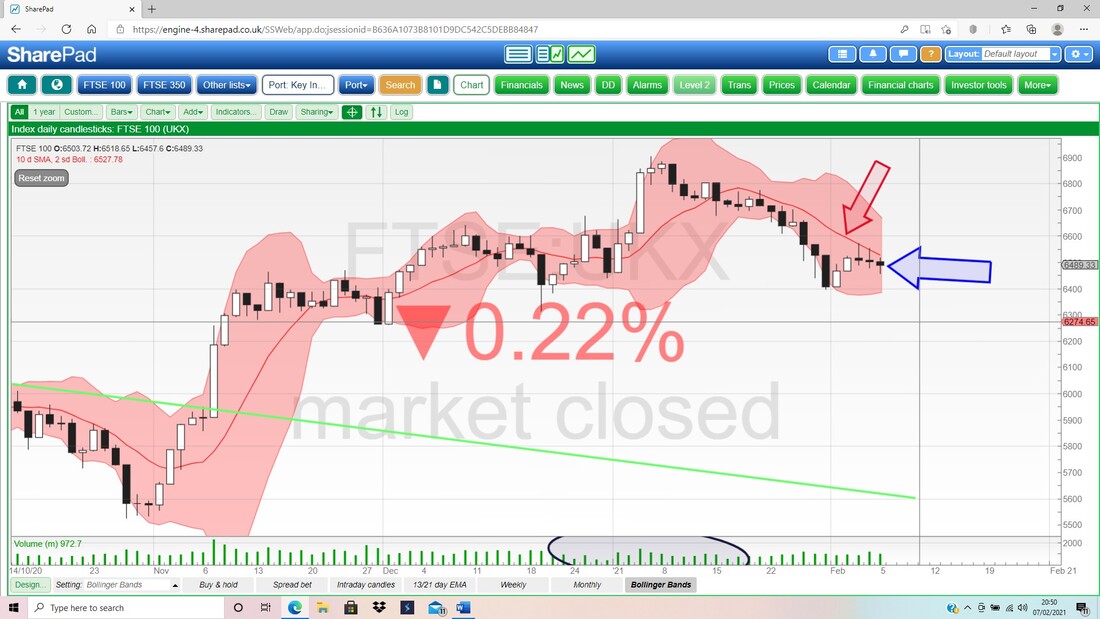
FTSE250
Finally for tonight I just wanted to show how the FTSE250 is totally bucking the trends from the FTSE100 and looks so so much better. This chart has the Weekly Candles and my Blue Arrow is pointing to a nice Big White Up Candle and it looks Bullish. My Red Ellipse is marking the All Time Highs and we are not far off hitting those Levels. As always, if the FTSE250 can Breakout over the ATH then it is ‘Clear Blue Water’ and nothing to hold it back. Anyway, Good Luck for the coming week and don’t eat the yellow snow !! Cheers, WD. 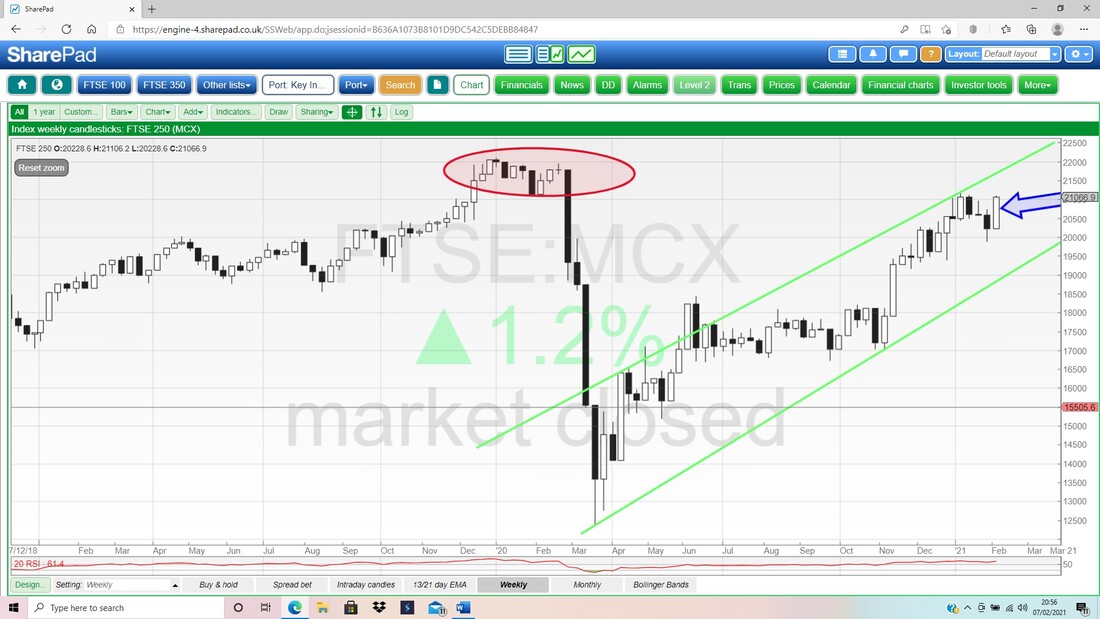
0 Comments
Leave a Reply. |

Stocks & Markets WheelieBlogsThese tend to be more Markets and Stocks related and timely - the Blog Page on the Main WheelieDealer Website has the 'Educational' stuff (well that's the theory anyway !!). Archives
October 2021
Categories
All
|
