

|
stocks & Markets blog |
|
Again I will make this short and sweet. Last week was a bit ‘sub-optimal’ with me receiving 2 Profit Warnings (BOO and IOM) in the latter 2 days. This hit my performance and the Hedges did not offset the hit as I had hoped, but of course this is all part of the Great Game and it is just something to mentally put in the past, and to keep moving forwards and sticking to the Strategy/Approach.
October can be an iffy month with many of the classic Market Crashes of the past having taken place during this month. However, I don’t expect anything like this and the weakness we are suffering now is pretty normal and I see it as a prelude to more gains ahead. We may however see more sector rotation as many Stocks have got daftly overvalued. Valuation ALWAYS matters. Brent Oil Composite All the Charts I show are taken from the excellent SharePad software I use and if you click on the images then they should get a bit bigger on your screen (I recommend you read these Blogs on a big screen rather than just a Fone – there is a lot of detail to be seen). I know some Readers actually look at their Charts on SharePad or whatever method they use as they read through my blogs.
If you fancy using SharePad or ShareScope yourself, then you can get 1 month’s Free Data if you go to the ‘Subscribe’ page on their website and then select the Product you want, and then you should see a ‘Promo Code’ box and if you type ‘twinpetes’ into that box, then the discount will apply. You can also get this by clicking on the Adverts that are all over my websites. I get a small payment for introducing you, so thank you very much !! (it’s just a shame I can’t spend it on beer much at the moment…..)
https://www.sharescope.co.uk/ I noticed also that SharePad/ShareScope have updated the landing page on their website and there is much better detail regarding the capabilities and features of their software now. In fact, Podcast TPI 50 contains a discussion with the Founder of SharePad/ShareScope, Martin Stamp. Highly recommended and of course you can find that one on the ‘Twin Petes Investing Podcast’ page on WD2. I am especially interested in the FTSE100 because I am hedged 35% or so on my Portfolio via Short Spreadbets on the FTSE100 (all on my ‘Trades’ page on WD1), and my inclination to look at Brent Oil Comp arises because of how it can move the FTSE100, with the Oil Majors like RDSB and BP. having quite a weighting. On top of that, I opened a small Short on the S&P500 last week (see my ‘Trades’ page) and if the general malaise continues (as I suspect it will), then I might open up another small Short on this major US Index. It will also be interesting to see what the Monthly Candles are telling us, now that September (historically the Worst Month) is over. This coming Friday we have the US Non-Farm Payroll numbers, and these can cause some fun on the afternoon but this is more a thing for Traders than Investors. It is always best to look at the ‘big picture’ first and then to drill in. This is an important discipline and it is worth getting into the habit (for the simple reason that longer trends dominate over the short term, and even if you are trading short timescales, the bigger view can give you more context to make decisions within). In that vein, we are starting with the Monthly Candles for Brent Oil Comp and my Red Arrow is pointing to a Big White Up Candle for September and this is Bullish (note the little tiny smidge of a Candle is for October, and is not valid until October is over). Nearby Resistance is at $80 which was hit last week, and above that we have $86.7 where my Green Arrow is. I haven’t shown it here, but if Oil can crack $86.7, then there is more Resistance between around $95 to $130 in a wide band. To the downside, there is good Support at $65. 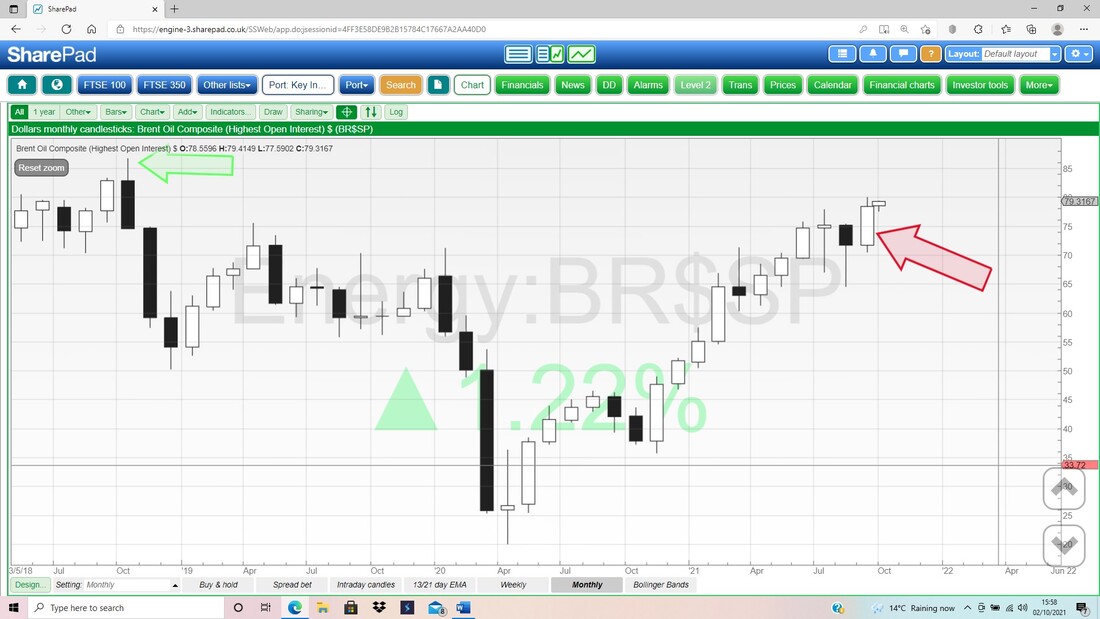
Next up another great big picture tool, which is where the Black 13 Day EMA Line (Exponential Moving Average) and the Red 21 Day EMA Line cross over. My Red Arrow is pointing to a ‘Bull Cross’ on this Chart for Brent Oil Comp and note this means the Bulls are very much in charge (bit like Pamplona).
Ignore the weird Candle things. 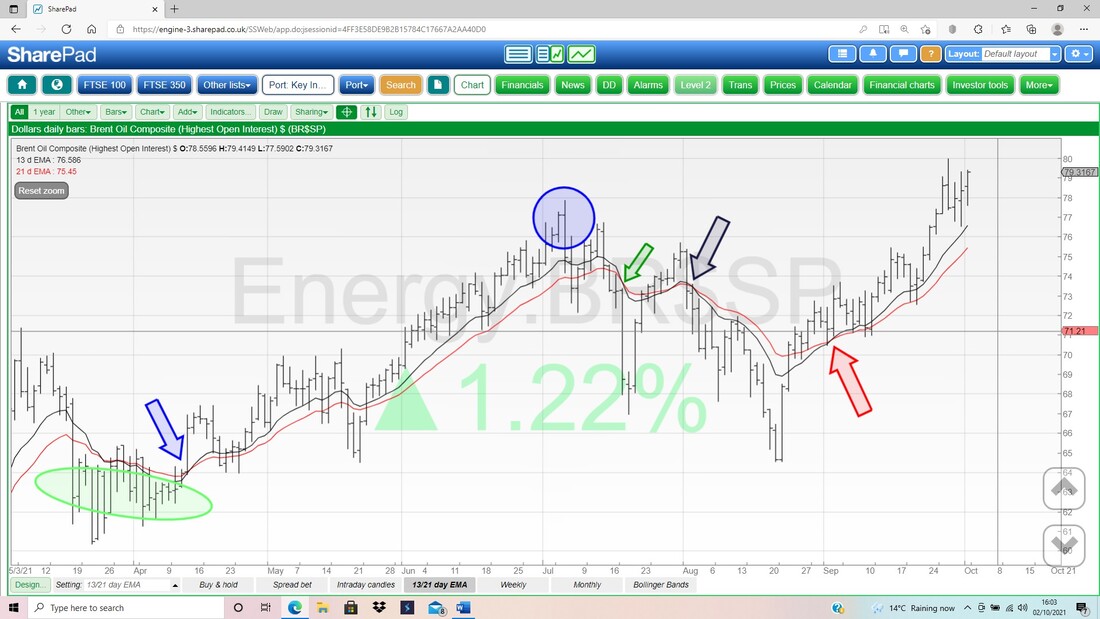
Next up the Weekly Candles for Brent Oil Comp and my Red Arrow is pointing to a nice White Up Candle from last week. This is Bullish. Note how the Price is behaving nicely within the confines of the Uptrend Channel I have marked with my parallel Black Lines.
My Blue Ellipse marks that $86.7 Resistance Level again. 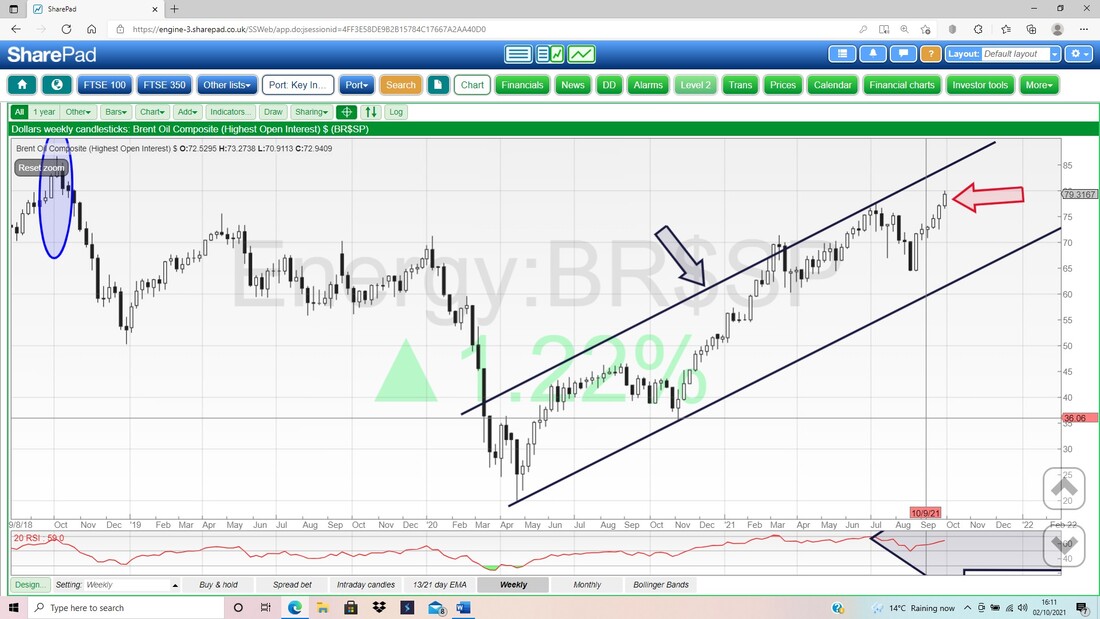
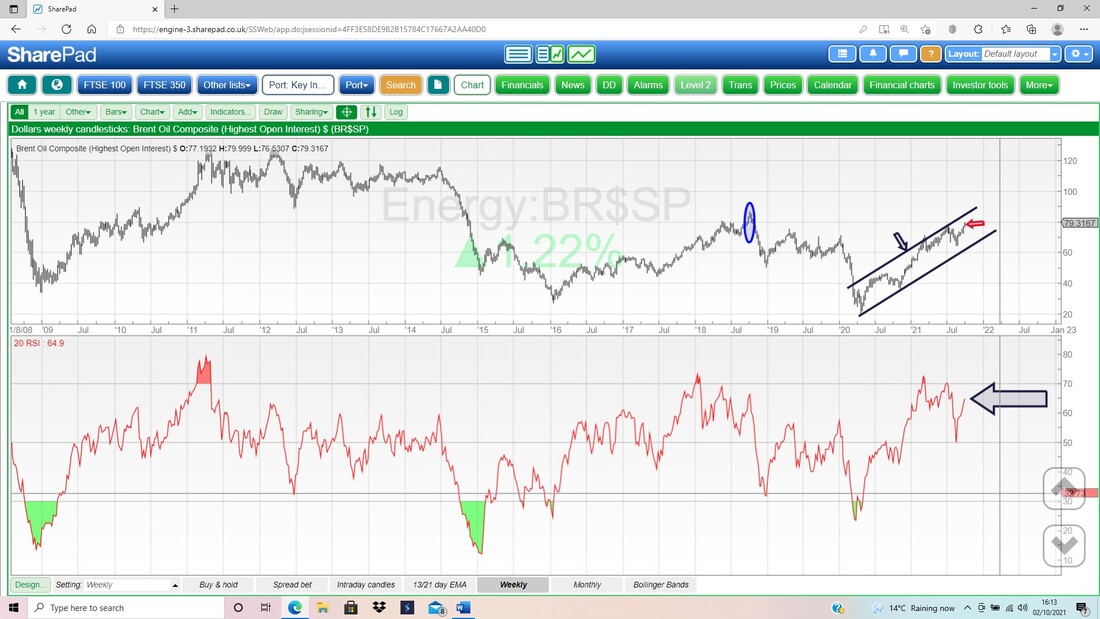
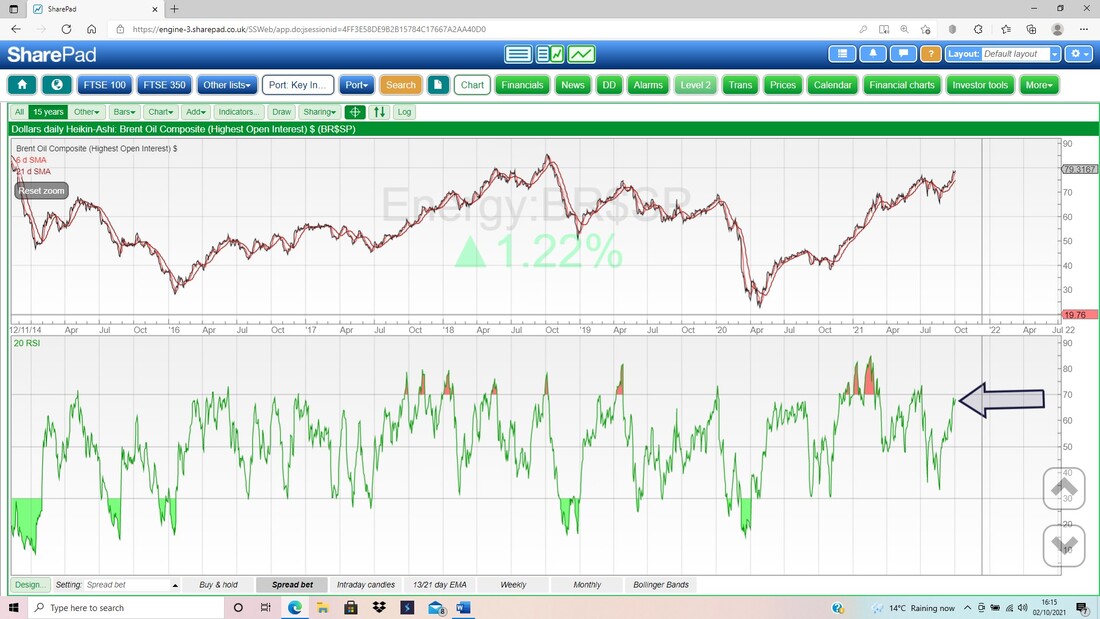
In the bottom window on my next screen we have the RSI (Relative Strength Index) for the Weekly Brent Oil Comp. On a Reading of RSI 65 where my Arrow is, this is high but not extreme and it can move up more.
In the bottom window on my next screen we have the RSI for the Daily Brent Oil Comp. On a Reading of RSI 68 this is very high but again it could go up a little more before needing to consolidate (sideways or pullback [retrace] a bit).
Finally for Brent Oil Comp we have the Daily Candles with the Pink bit marking the Upper and Lower Bollinger Bands (these are based on Standard Deviations and you can look it up, but to be honest, you don’t need to understand how they are derived). My Blue Arrow is pointing to a nice Up Candle from Friday and the Top Band is at about $86.6 which chimes with that infamous Resistance Level I talked about earlier.
The Red Midpoint Line (Red Arrow) is at about $77 and could be Support. 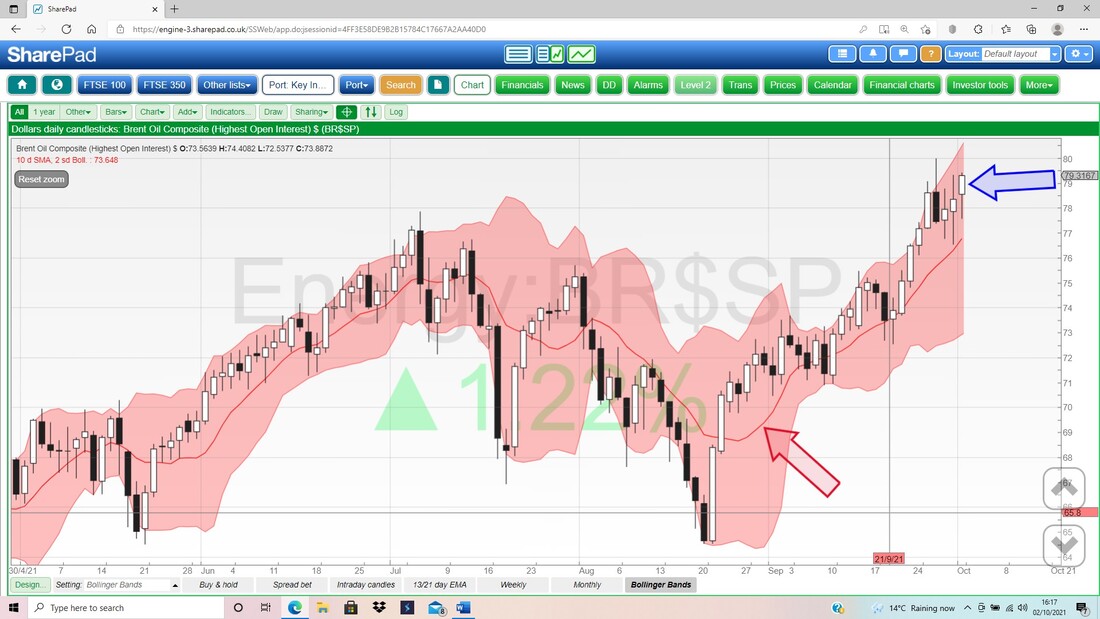
FTSE100
As I mentioned, I have quite a Short Position on the FTSE100 and with the strength in Oil, this could be a bit uncomfortable. However, much of the strength in the FTSE100 last week was down to AZN AstraZeneca doing well and I suspect this was partly because it had some good news on treatments and stuff it is developing. However, the catch with higher Oil is that it can drag on most other Sectors and even Miners may suffer because Oil is a huge element of their cost bases (how on earth Miners will be able to truly go ‘green’ is a bit of a mystery because only Oil is likely to be able to supply the immense power/torque needed to power the massive equipment. In time hydrogen might be the answer but it is a long way off I suspect). First for the FTSE100 I am showing the Monthly Candles. My Blue Arrow is pointing to the Doji that was formed for September (again, you need to ignore the little black splodge that comes after because that is the start of October and not yet valid). For the last 5 months, the FTSE100 has really been wiggling about in a tight range between roughly 7225 and 6800. To the upside, it needs to Break out over 7224 and my huge Red Ellipse is highlighting a big zone of Resistance up to 7906. Below, there is Support at 6813 then around 6700 and I think 6500 looks very strong Support. 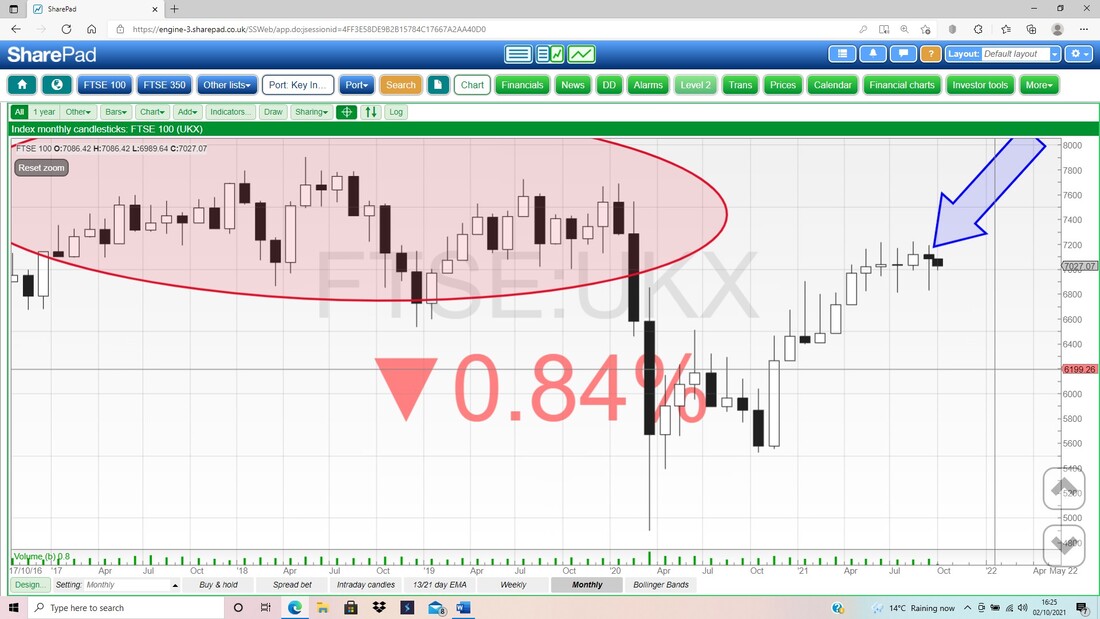
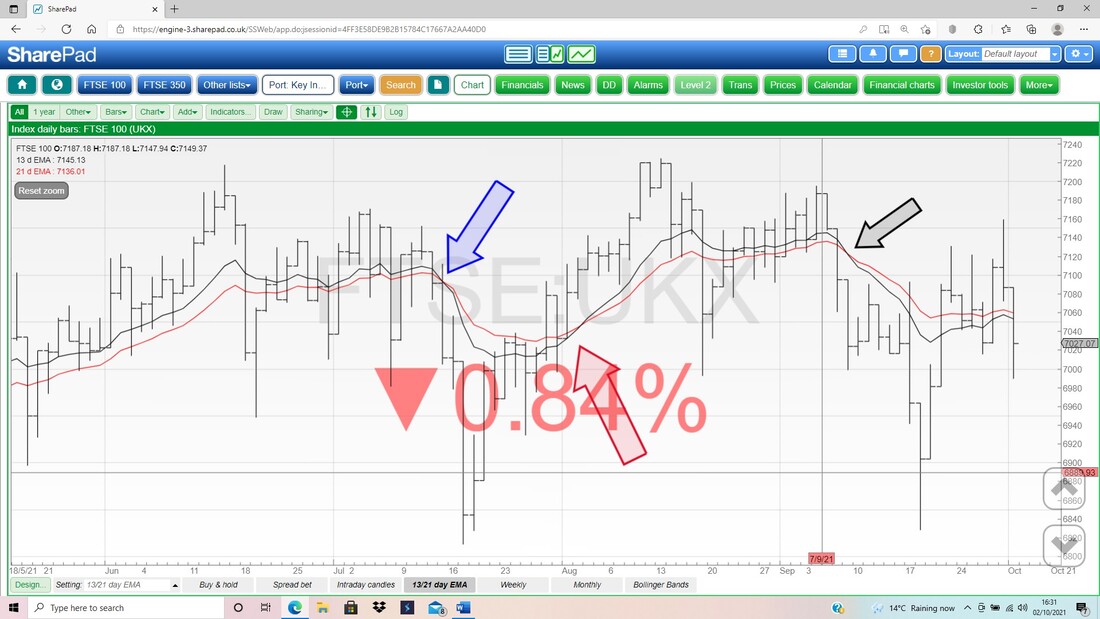
Next the EMA Lines and my Black Arrow marks a ‘Bear Cross’ where the Black 13 Day EMA dropped below the Red 21 Day EMA. Note how the Lines have moved closer together, but it is possible that the Black 13 Day is falling away again. We shall see, but Bulls cannot relax until a ‘Bull Cross’ gets triggered and cemented.
Next we have the Weeklies for the FTSE100. My Blue Arrow is pointing to a Doji Candle from last week and note how it was unable to hold the High of the week. However, it is still within the Pink/Mauve Parallel Lines of my Uptrend Channel, and the Bears have not really got a grip until they can drag it below this Channel and take on that 6800 Support Level.
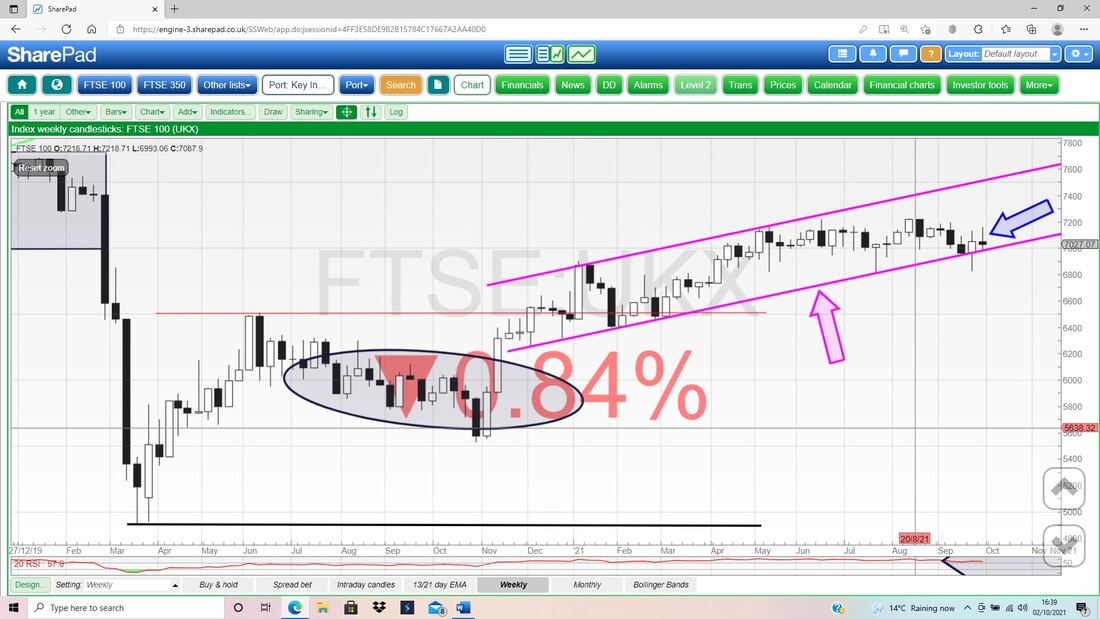
In my bottom window next, we have the RSI for the Daily FTSE100. On a Reading of RSI 48 where my Black Arrow is, this is pretty much Neutral.
I won’t show it, but the Weekly RSI is similarly at Neutral, which makes total sense because the FTSE100 has been going sideways and of course cannot be Overbought nor Oversold in such a motion. 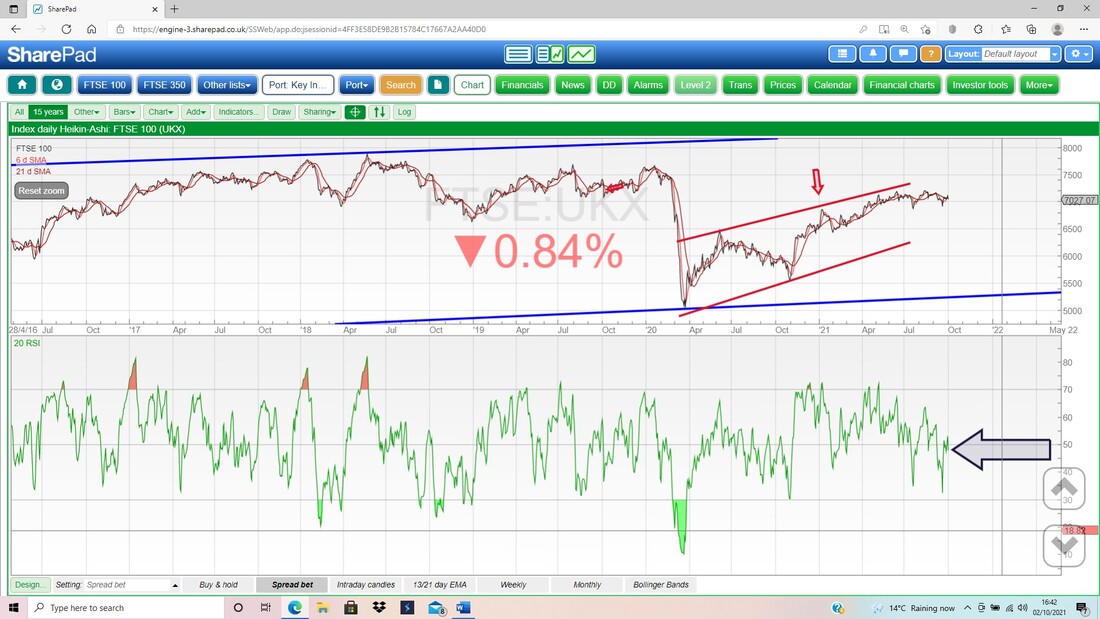
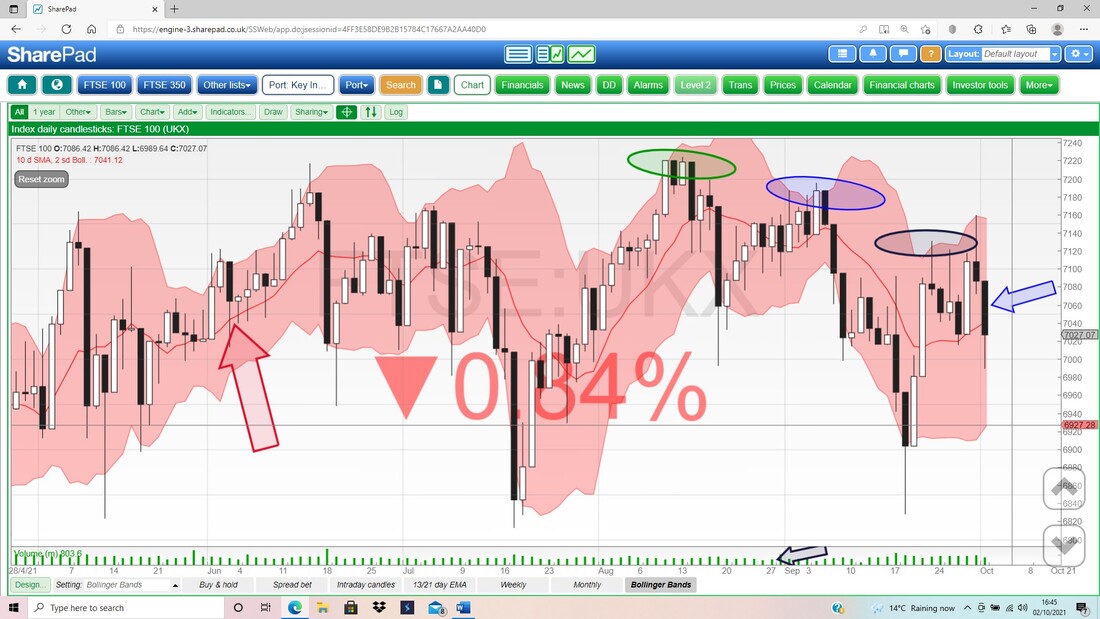
Finally for the FTSE100, the Dailies with the Bollies. My Blue Arrow is pointing to a Down Candle for Friday but it did manage to get off the Low at 6989. Look how it turned down off the Candle from Thursday which peaked out at the Top Bollinger Band at 7159. The Bottom Band is at about 6927.
S&P500
As with the others, I am kicking off with the Monthly Candles. My Blue Arrow is pointing to a Big Black Down Candle for September (keeping up its nasty record as the worst month !!). This has Turned down off the ATH (All Time High) at 4545 and clearly Bulls need to get it over this level to get back in charge. That will be difficult I suspect. To the downside, there is Support around 4000 especially. 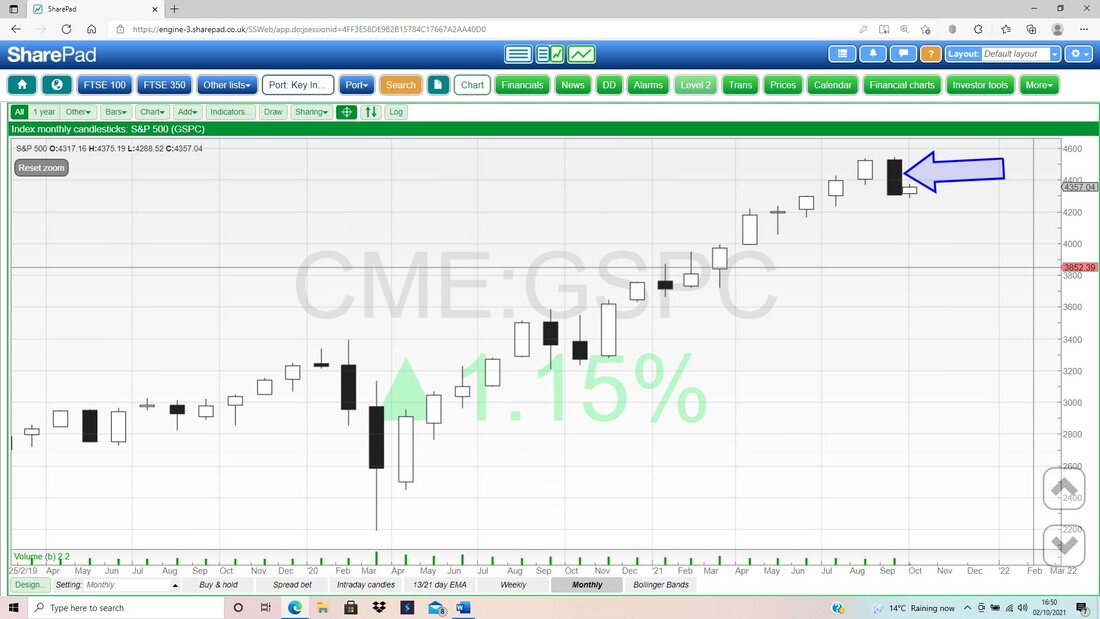
Below my Green Arrow is marking a ‘Bear Cross’ between the 13 and 21 Day EMAs; and by now you should know what this means !!!
I am very happy to be Short on the S&P500 when the 13/21s are Bearish like this, and it supports my nascent thoughts about shorting a little more. 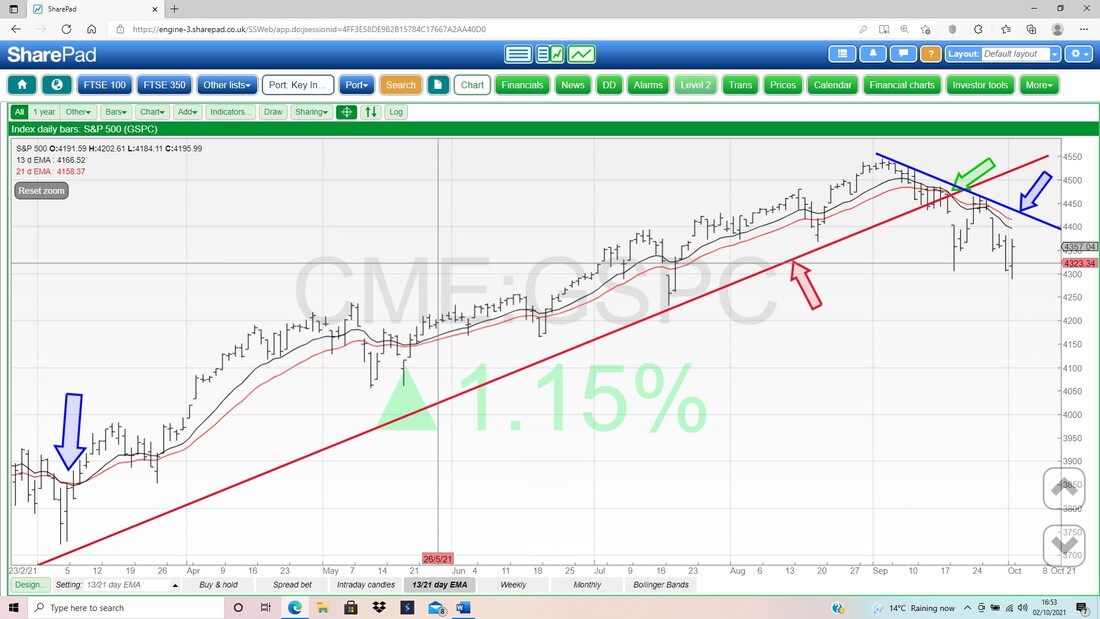
My next screen has the Weekly Candles for the S&P500. My Blue Arrow marks a big Black Down Candle but note it did manage to rise off the Low at 4288. It is vital this level holds.
Note the S&P500 has fallen out off my very well-defined Uptrend Channel marked by my Parallel Black Lines (sounds a bit like a Blondie album). 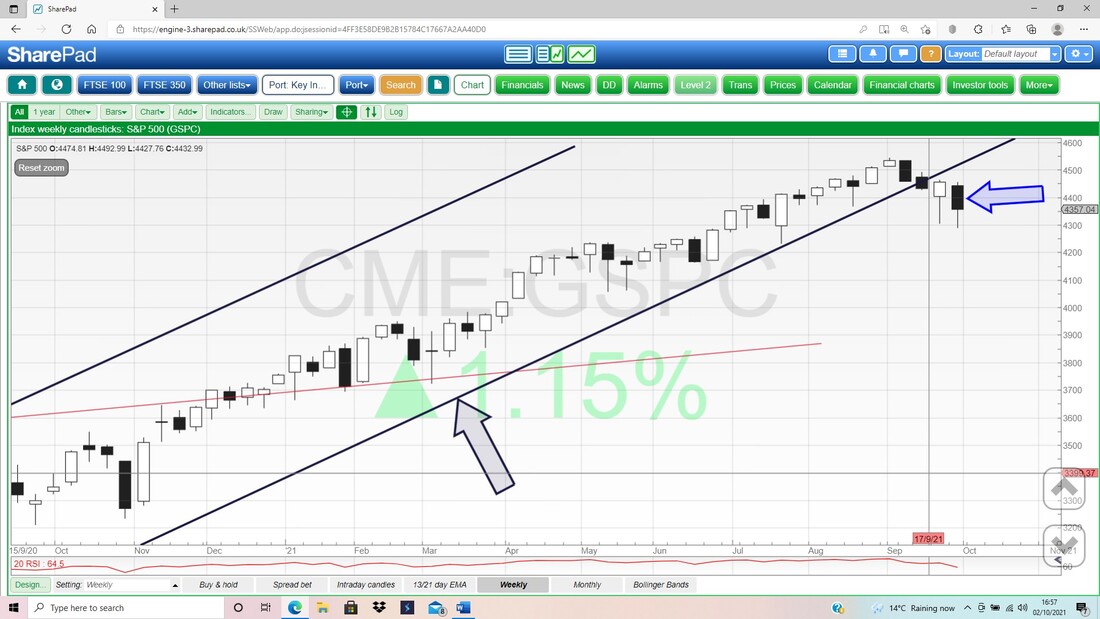
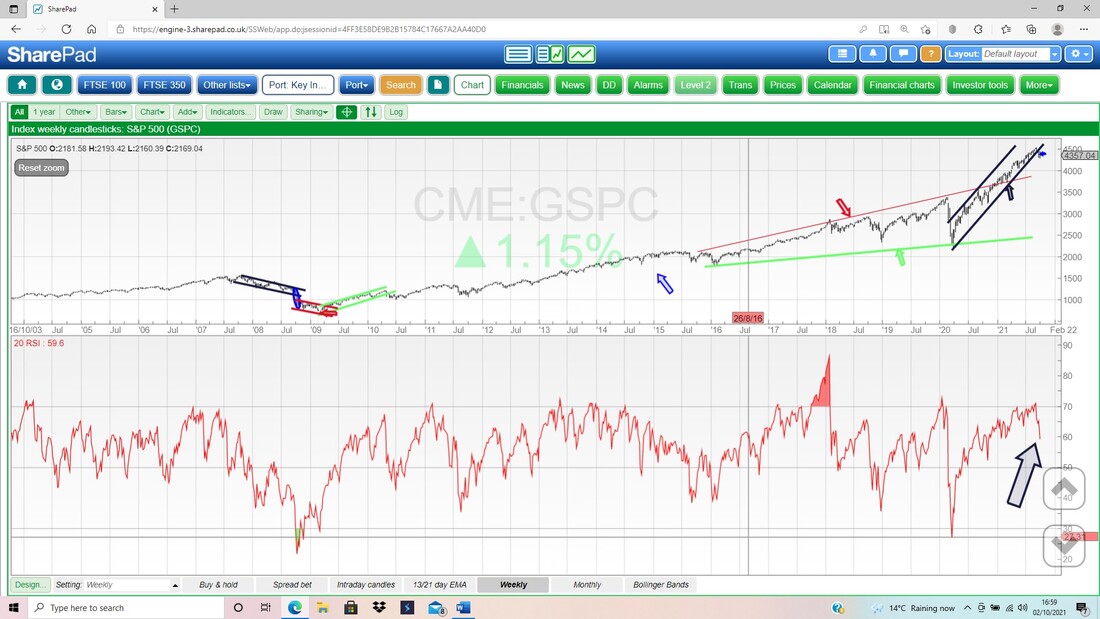
In the bottom window up next we have the RSI for the Weekly S&P500. On a Reading of RSI 59 this is not extreme but can clearly fall plenty more.
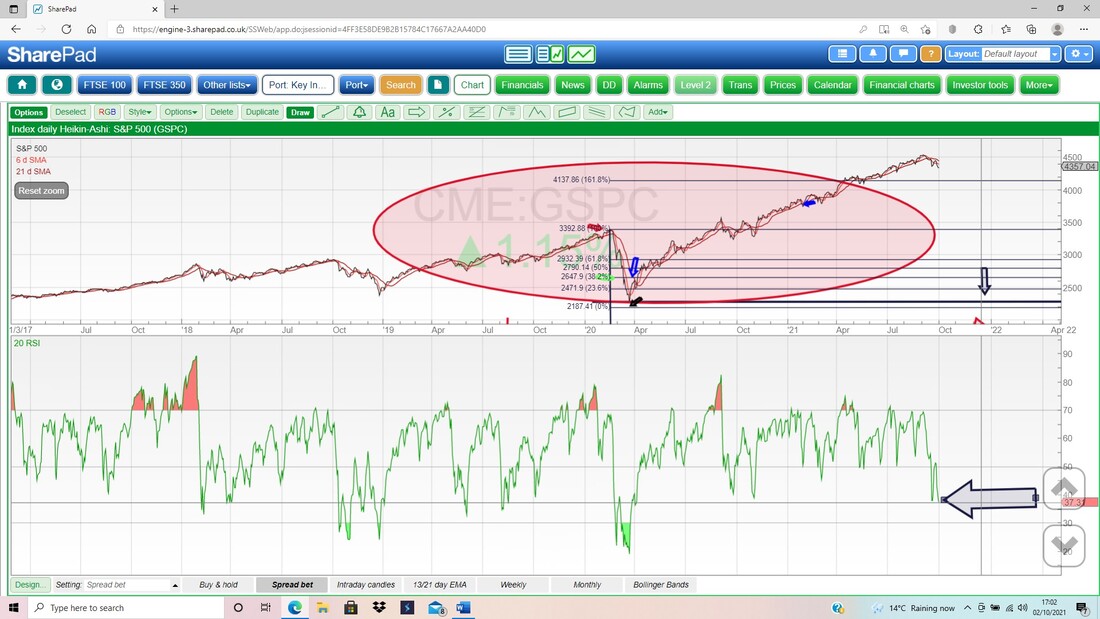
Next in the bottom window we have the RSI for the S&P500 Daily. On a Reading of RSI 37 this is low but not an extreme level. This means it could fall a bit more, but my hunch is it might try to move up a bit, but then fall again.
And last up tonight we have the Daily Candles with the Bollingers for the S&P500. On Friday the S&P500 rallied but note it couldn’t quite reach the Red Midpoint Line at 4385 and that could be Resistance. The Bottom Band is at that 4288 Support Level mentioned earlier (which is a rather nice coincidence/congruence).
The Candle from Friday combined with the Candle from Thursday have formed an ‘Inside Day’ 2 Day Pattern and this means we need a third Candle from Monday, to point the direction from here. OK, that’s this week’s Charts well and truly looked at. Good luck for the coming week and keep it controlled and sensible, and in particular don’t let that exposure run away from you !! Cheers, WD. 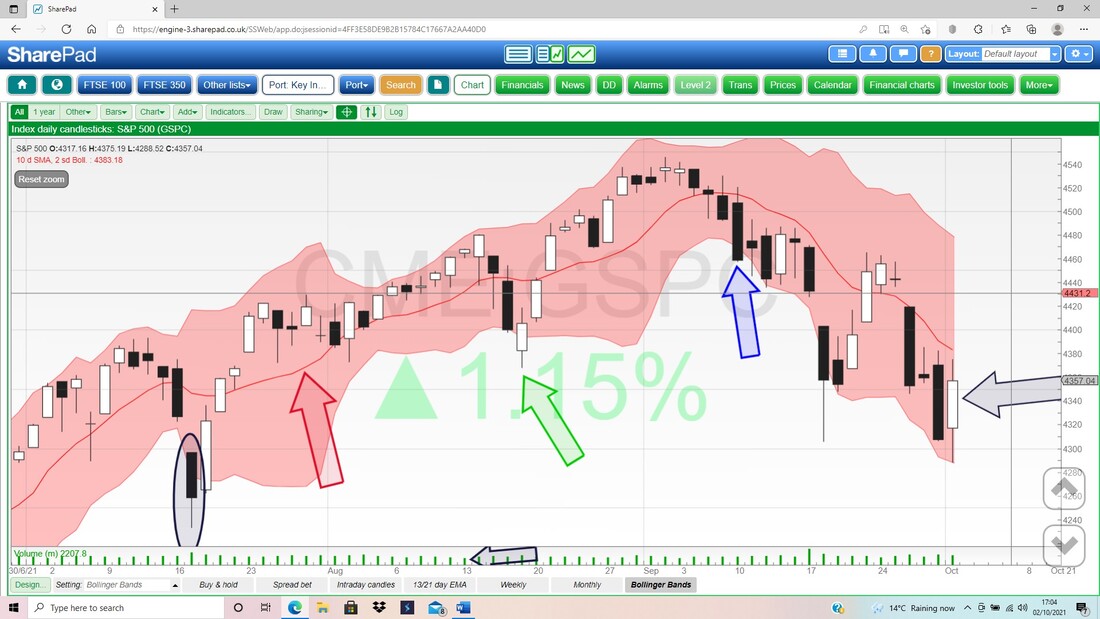
0 Comments
Leave a Reply. |

Stocks & Markets WheelieBlogsThese tend to be more Markets and Stocks related and timely - the Blog Page on the Main WheelieDealer Website has the 'Educational' stuff (well that's the theory anyway !!). Archives
October 2021
Categories
All
|
